Abstract
Vascular calcification, which contributes to cardiovascular disease in patients with uremic hyperphosphatemia, is associated with vascular cell expression of osteogenic genes, including bone morphogenetic protein (BMP)-2 and osteopontin (OPN). High inorganic phosphate levels in vitro stimulate the osteogenic conversion of smooth muscle cells; however, the mechanism governing this is not clear. We found that high-phosphate medium increased the expression of BMP-2 and OPN in mouse smooth muscle cells in culture. However, this effect was lost in the presence of the mineralization inhibitor, pyrophosphate, suggesting a contribution of calcium phosphate crystals. Addition of 1–2 mmol/l phosphate alone to growth medium was sufficient to induce nanosized crystals after 1 day at 37 °C. Isolated crystals were about 160 nm in diameter and had a calcium to phosphate ratio of 1.35, consistent with the hydroxyapatite precursor octacalcium phosphate. Nanocrystal formation increased fourfold in the absence of serum, was blocked by fetuin-A, and was dependent on time and on the concentrations of phosphate and calcium. Purified synthetic hydroxyapatite nanocrystals and isolated high-phosphate-induced nanocrystals, but not nanocrystal-free high-phosphate medium, also induced BMP-2 and OPN. Thus, our results suggest that BMP-2 and OPN are induced by calcium phosphate nanocrystals, rather than soluble phosphate. This mechanism may contribute, in part, to hyperphosphatemia-related vascular cell differentiation and calcification.
Keywords: gene transcription, hyperphosphatemia, osteopontin, phosphate, vascular calcification
Vascular calcification is now recognized as a significant factor in cardiovascular diseases.1–3 It manifests as hydroxyapatite deposition and, to varying degrees, the ectopic development of bone and/or cartilage-like tissue.4,5 Vascular calcification may occur within atherosclerotic plaque, where it may regulate plaque stability,6,7 in cardiac valves,8,9 where it impairs cardiac output, and in the medial layer of large arteries, wherein it contributes significantly to cardiovascular morbidity associated with both diabetes and chronic kidney disease.3 Vascular calcification is primarily associated with smooth muscle cells (SMCs) and their progenitors, both of which undergo osteogenic differentiation and calcification in vitro, and which are used as in vitro models of vascular calcification.8,10–12
The clinical condition associated with most severe vascular calcification is end-stage renal disease, in which evidence points to inorganic phosphate (Pi) and its inhibitor, pyrophosphate (PPi), as central regulators.12,13 End-stage renal disease patients are often hyperphosphatemic, defined as a phosphate concentration of 2 mmol/l, compared with 1–1.5 mmol/l in healthy patients.2,12 In mice, serum phosphate is higher at baseline (~2.6 mmol/l) and surgically induced chronic kidney disease can result in Pi levels as high as ~3.5 mmol/l.14 In vitro studies and animal models of vascular calcification suggest that Pi not only participates in hydroxyapatite crystal formation, but also directly induces osteogenic gene expression when applied at concentrations similar to those in hyperphosphatemic subjects in vivo.12,14–16 Li et al.12 showed that the effects of high Pi on core-binding-factor α1 (Cbfa1/Runx2) and osteocalcin in human SMCs are mediated by Pi import through the sodium-dependent phosphate co-transporter Pit-1, as demonstrated by Pit-1 small interfering RNA knockdown. However, some studies have attributed the effects of high Pi, such as osteopontin (OPN) induction,17,18 to Pit-1, based on the use of phosphonoformic acid (PFA) as a specific inhibitor of phosphate transport. However, PFA, an analog of PPi, is a more potent inhibitor of calcium crystal formation than of Pit-1.19 Interestingly, micro- or nanoscale hydroxyapatite and other calcium phosphate crystals may also have the ability to regulate cell phenotype.6,20,21 In this study, we investigated the mechanism(s) by which increased concentrations of Pi may regulate osteogenic gene expression in mouse aortic SMCs (MASMCs) and demonstrate that calcium phosphate nanocrystals, formed in the presence of high Pi, may regulate gene expression independently of free Pi.
RESULTS
High levels of Pi induce calcification and osteogenic gene expression in MASMCs
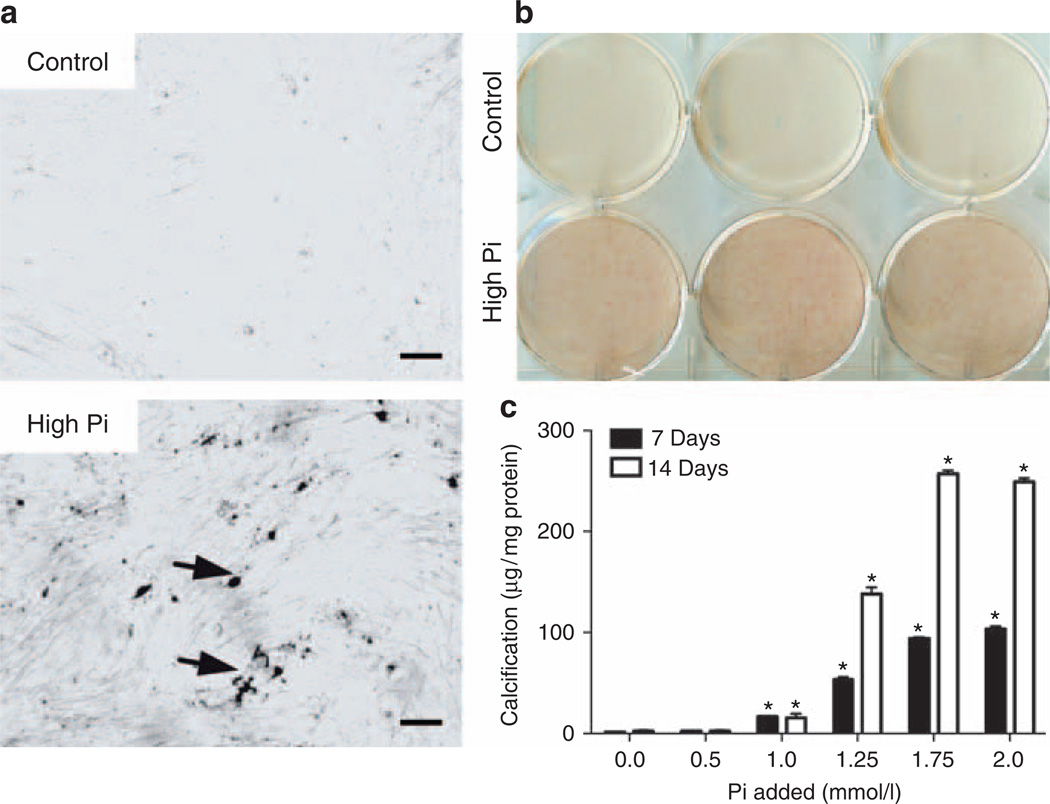
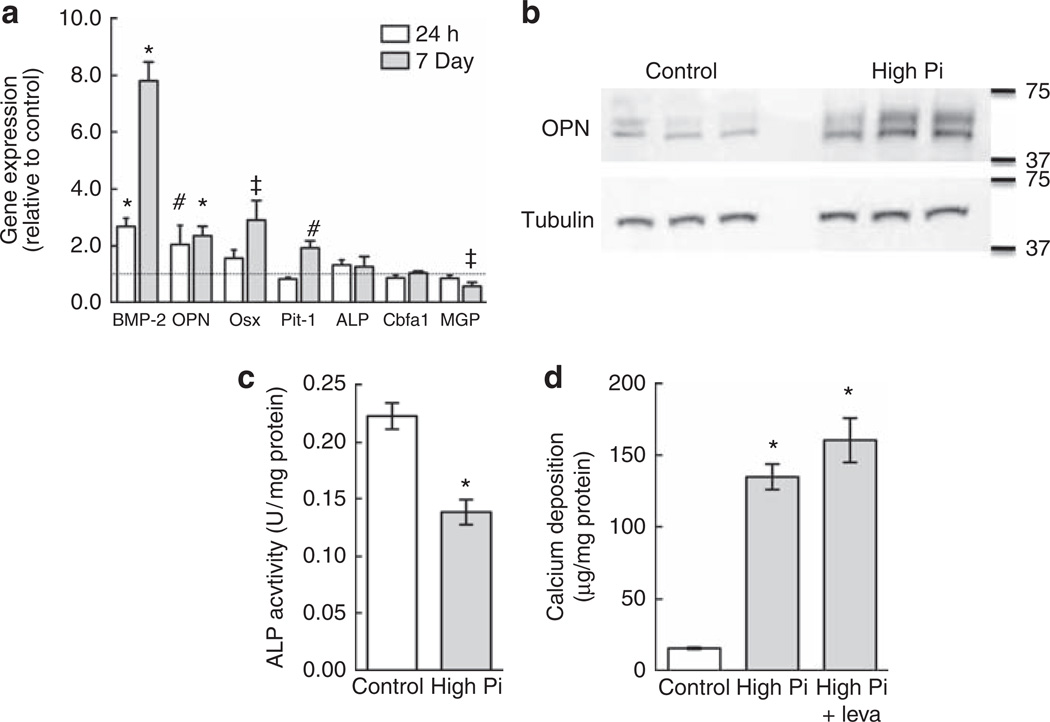
Vascular calcification is modeled in vitro by treating SMCs with high-Pi medium (2–4 mmol/l Pi),14,19,22 corresponding to hyperphosphatemic concentrations. This approach is an alternative to supplementation with organic phosphate (β-glycerophosphate; 5–10 mmol/l), a standard addition to medium for bone cell culture. MASMCs were incubated in control medium (10% of fetal bovine serum–α modified Eagle’s medium (FBS–αMEM); ~1 mmol/l Pi) or high-Pi medium (additional 2 mmol/l Pi) for 7 days. High-Pi-medium induced calcification in MASMC cultures in a diffuse pattern, as detected by staining with von Kossa (Figure 1a) and Alizarin red (Figure 1b). Quantitative assays of calcium deposition at 7 or 14 days with Pi supplementation (0.5–2 mmol/l) showed that Pi supplementation in excess of 1 mmol/l increased calcification (Figure 1c). To determine whether MASMCs undergo osteogenic differentiation in response to high Pi, we tested the effects of high Pi on the expression of osteogenic differentiation factor, bone morphogenetic factor-2 (BMP-2), and its inhibitor, matrix gamma carboxyglutamic acid (GLA) protein, the osteogenic transcription factors, Cbfa1 and osterix, and the mineralization regulators, alkaline phosphatase (ALP; tissue-non-specific isoform) and OPN. As the sodium-dependent Pi transporter, Pit-1, has been implicated as an upstream regulator of calcification in human SMCs,12 we also tested its response to high-Pi medium in mouse SMCs. Gene expression was quantified by real-time PCR using RNA from MASMCs incubated in control or high-Pi medium for 24 h or 7 days (Figure 2a). High Pi significantly induced BMP-2 and OPN expression at 24 h but had no effect on the other genes, although there was a trend toward increased osterix expression (P = 0.08). After 7 days, the BMP-2 induction was even more pronounced, whereas OPN was induced by a similar level at 24 h and 7 days. At 7 days, high Pi significantly induced osterix and Pit-1, whereas matrix GLA protein expression was significantly downregulated. High Pi significantly increased OPN protein levels after 7 days compared with control, as determined by western blotting (Figure 2b). BMP-2 protein levels, detected by enzyme-linked immunosorbent assay, were also increased in the conditioned medium of MASMC treated for 7 days with high Pi (48.2 ± 7.3 pg/ml compared with 8.4 ± 5.9 pg/ml in controls).
Figure 1. High inorganic phosphate (Pi) dose dependently induces calcification in mouse aortic smooth muscle cell (MASMC) cultures.
(a) Von Kossa staining of MASMCs treated for 7 days with control or high-Pi medium. Bar = 100 µm. (b) Alizarin red staining of MASMCs treated for 7 days with control or high-Pi medium. (c) Calcium deposition normalized to total protein after 7 or 14 days with control or high-Pi (0.5–2 mmol/l) medium. *P<0.05 versus control (0).
Figure 2. High inorganic phosphate (Pi) induces osteogenic gene expression but not alkaline phosphatase (ALP) activity.
(a) Effect of high-Pi medium on the expression of bone morphogenetic protein-2 (BMP-2), osteopontin (OPN), osterix (Osx), Pit-1, core-binding-factor α1 (Cbfa1), ALP, and matrix GLA protein (MGP) after 24 h or 7 days. Expression levels were normalized to β-actin and expressed relative to control medium (1; dotted line). (b) Effect of high-Pi medium on OPN protein levels in mouse aortic smooth muscle cells (MASMCs) after 7 days determined by western blotting. Tubulin was used as a loading control. (c) Total ALP activity of MASMCs treated for 7 days with control or high-Pi medium (representative experiment). (d) Calcium deposition in MASMCs treated as in c with or without levamisole (leva; 100 µm). *P<0.001; #P<0.01; ‡P<0.05 versus control. GLA, gamma carboxyglutamic acid.
Pi-induced MASMC calcification is ALP independent
ALP, an important marker of osteogenic differentiation, permits calcification through the removal of inhibitory PPi or, when β-glycerophosphate is used in the culture medium, through increased extracellular Pi concentration. After 7 days of treatment, high Pi significantly inhibited ALP activity levels in MASMCs compared with the control medium (Figure 2c). This suggests that ALP is unnecessary for Pi-induced calcification of MASMCs. Indeed, ALP inhibition with levamisole (100 µm) failed to attenuate high-Pi-induced calcification (Figure 2d).
PPi prevents Pi-induced expression of BMP-2 and OPN
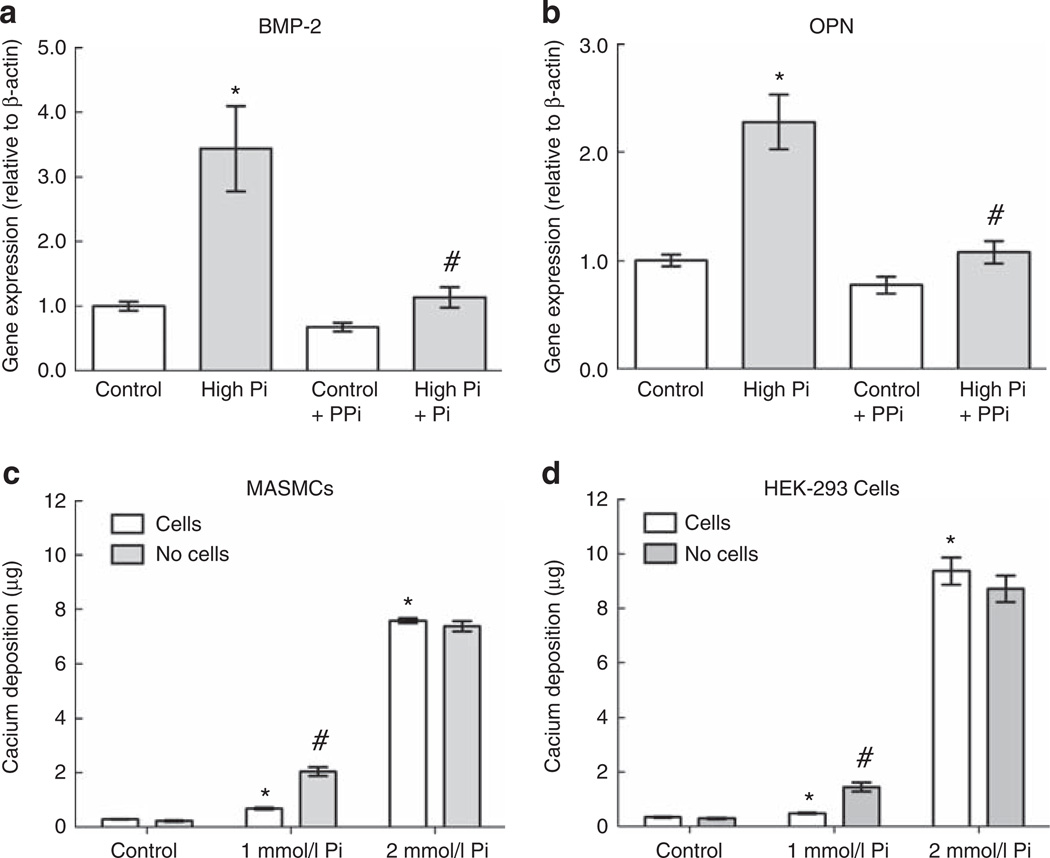
To test the hypothesis that, similar to PFA, PPi might regulate high Pi induction of gene expression, we tested the effects of PPi on gene expression in cells treated with high-Pi medium. As BMP-2 and OPN were significantly induced by high Pi at 24 h, we chose to focus on these genes and this time point in subsequent gene expression experiments. MASMCs were treated for 24 h with high Pi and/or PPi (10 µm). The induction of BMP-2 and OPN by high Pi was completely blocked by co-treatment with PPi, which alone had no effect on expression of either gene (Figure 3a and b).
Figure 3. Pyrophosphate (PPi) prevents high-inorganic phosphate (Pi)-induced early gene expression.
(a, b) Effect of high-Pi medium with or without PPi (10 µm) on expression of bone morphogenetic protein-2 (BMP-2; a) and osteopontin (OPN; b) after 24 h (normalized to β-actin). *P<0.001 versus control; #P<0.001 versus Pi alone. (c, d) Calcium deposition after 7 days with control, 1, or 2 mmol/l Pi medium in the absence of cells or with mouse aortic smooth muscle cells (MASMCs; c; representative experiment) or human embryonic kidney-293 (HEK-293) cells (d). *P<0.05 versus control + cells; #P<0.05 versus 1 mmol/l + cells.
Characterization of high-Pi-induced calcium deposition
As a major extracellular function of PPi is inhibition of calcium crystal formation,13,23,24 we tested whether its inhibitory effect on high-Pi-induced gene expression was because of its inhibition of calcium phosphate crystals themselves. To determine whether crystals were forming independently of cells, we quantified calcium deposition in the presence or absence of cells in wells 7 days after incubation with control or high-Pi (additional 1 or 2 mmol/l) medium. In the presence of cells, calcium deposition increased 27-fold with 2 mmol/l added (high) Pi medium (Figure 3c). Importantly, the same level and fold increase occurred in the absence of cells. Indeed, with 1 mmol/l high-Pi medium, results showed significantly more calcium deposition in the absence of cells (Figure 3c), suggesting that the cells inhibited calcium deposition in this situation. The high-Pi medium had similar effects on calcium deposition in cultures of human embryonic kidney-293 cells (Figure 3d), which are not known to undergo osteogenic differentiation. The induction of calcium deposits by high-Pi medium was robust, irrespective of pH of the Pi stock solution (pH 4.3, 7.4, or 8.3), presence or absence of cells, type of medium (Dulbecco’s modified Eagle’s medium versus αMEM), type of cell, size of culture wells (6-, 12-, 48-well plates), or whether the wells had been pre-incubated with control medium (data not shown).
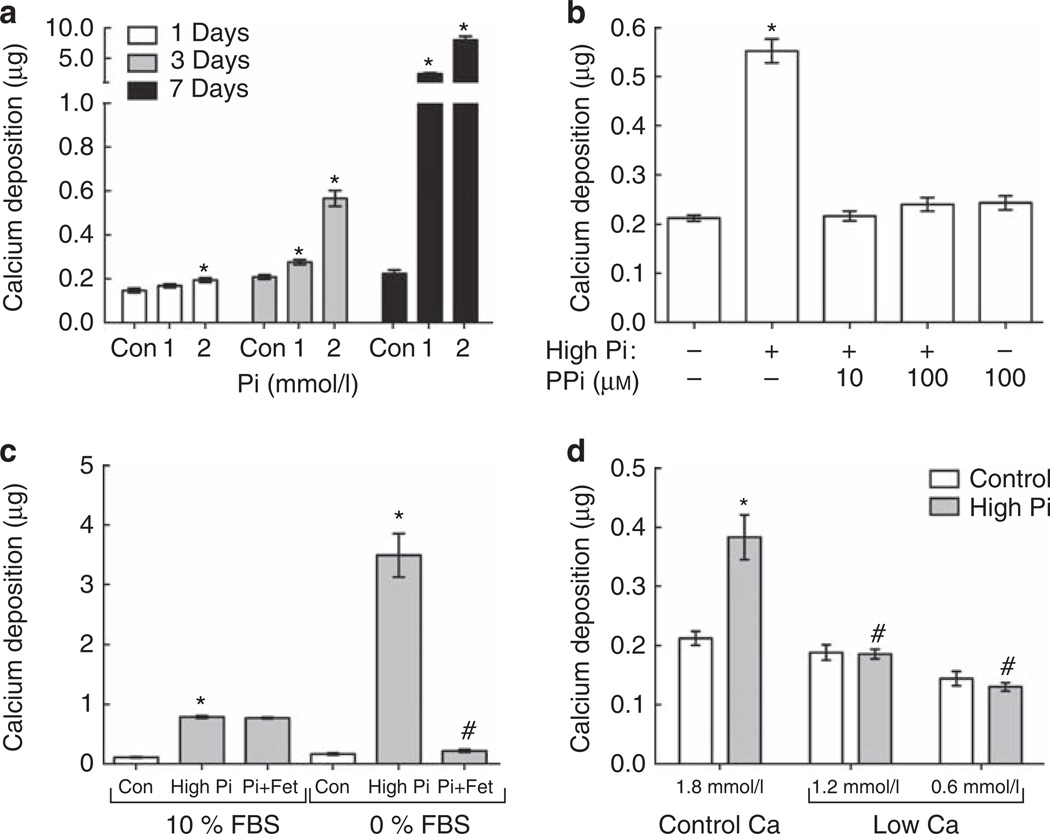
Significant, cell-free calcium deposition was detectable after 24 h, with 2 mmol/l high-Pi medium, and after 3 days, with 1 mmol/l Pi; it increased significantly by 7 days with both doses (Figure 4a). The effect of high-Pi medium on calcium deposition was also modulated by serum calcium concentration and PPi treatment, assessed after 3 days. Importantly, calcium deposition was completely prevented by PPi (10–100 µm; Figure 4b). As previously shown,25 the absence of serum (FBS) significantly increased calcium deposition fourfold in high-Pi medium compared with 10% of FBS (Figure 4c). The inhibitory effect of serum on crystal formation may be primarily because of the serum protein fetuin-A.26,27 In this study, the addition of fetuin-A (10 µm) completely inhibited calcium deposition in serum-free medium but had no additional inhibitory effect in the presence of FBS, which contains 100–200 µm fetuin-A28 (Figure 4c). Reducing the medium Ca concentration from 1.8 mmol/l (control) to 1.2 or 0.6 mmol/l prevented high-Pi-induced calcium deposition (Figure 4d).
Figure 4. Regulation of calcium deposition in high-inorganic phosphate (Pi) medium.
(a) Cell-free nanocrystal formation (calcium deposition) after 1 (n = 3), 3 (n = 7), and 7 (n = 4) days with control (Con), 1, or 2 mmol/l excess Pi medium. *P<0.05 versus control at the same time point. (b–d) Effect of (b) pyrophosphate (PPi; 10 or 100 µm), (c) serum (fetal bovine serum (FBS)) and/or fetuin (Fet)-A (100 µm) or (d) Ca concentration (0.6, 1.2, and 1.8 mmol/l) on high-Pi-induced calcium deposition after 3 days. (b) *P<0.001 versus control. (c) *P<0.001 versus respective control; #P<0.001 versus 0% FBS/high Pi. (d) *P<0.001 versus 1.8 mmol/l Ca/control; #P<0.001 versus 1.8 mmol/l Ca/high Pi.
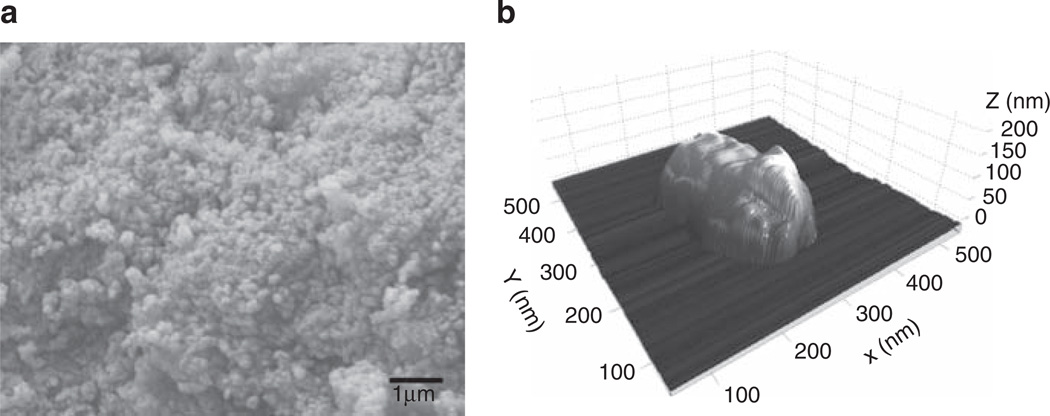
To further characterize these deposits, we isolated them by centrifugation (see Materials and Methods) from high-Pi medium after 3 days at 37 °C. Scanning electron microscopic and electron dispersive spectroscopic analysis of crystals, as shown in Figure 5a, determined that the crystals had a Ca:P ratio of 1.36 ± 0.013, identifying them as octacalcium phosphate (Ca8(HPO4)2(PO4)4 · 5H2O), a precursor of hydroxyapatite. Further analysis of crystal size by atomic force microscopy (Figure 5b) identified that the crystals varied in diameter from 30 to 500 nm (mean 161 ± 13 nm, n = 46) and had an aspect ratio of 2.6 ± 0.1. Therefore, in this report, we subsequently use the term nanocrystals to refer to these high-Pi-induced crystals.
Figure 5. Characterization of high-inorganic phosphate (Pi)-induced nanocrystals.
(a) Scanning electron microscopy of nanocrystals isolated from high-Pi medium after 3 days. (b) Atomic force microscopy of a representative nanocrystal isolated from high-Pi medium after 3 days.
High-Pi-induced nanocrystals, rather than free Pi, enhance BMP-2 and OPN expression in MASMCs
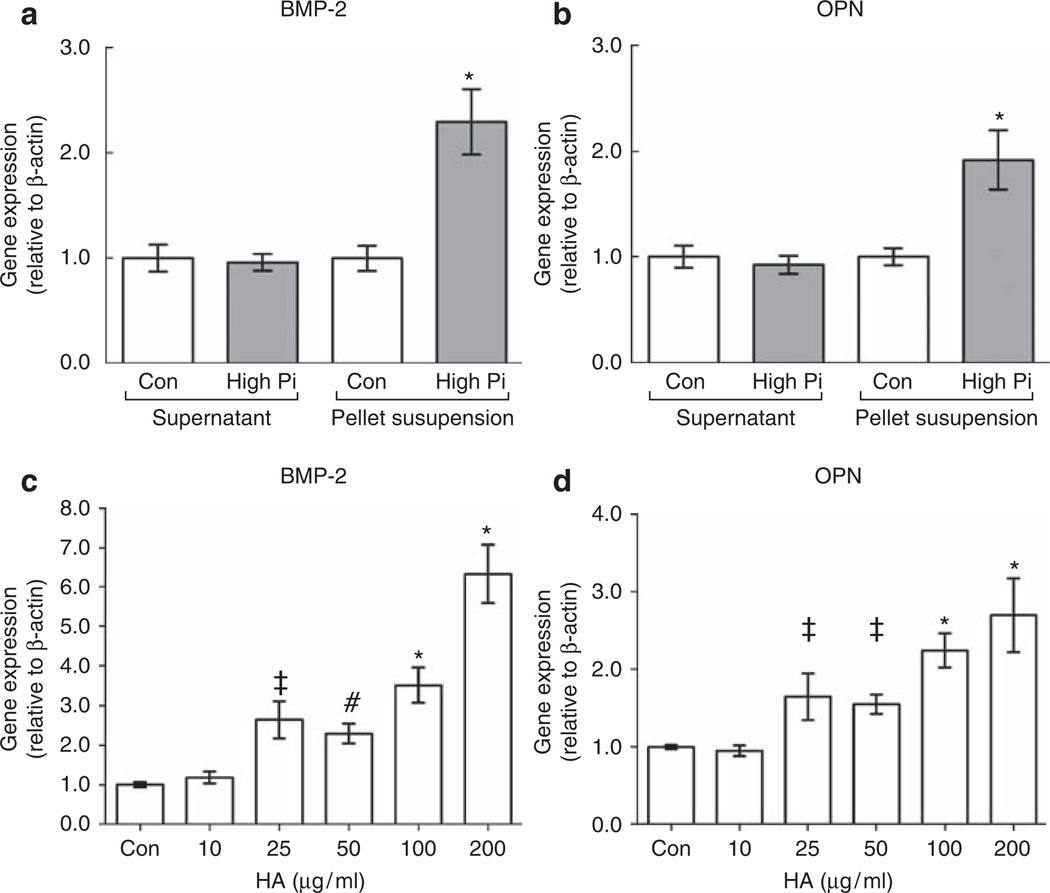
To compare the relative effects of free Pi versus Pi-induced nanocrystals on gene expression, we isolated nanocrystals from high-Pi medium by centrifugation and resuspended them in the control medium for comparison with the supernatant. Pellets (nanocrystals) centrifuged from 1 ml of high-Pi medium contained 21 ± 1.6 µg (0.53 ± 0.11 µmol) calcium and 0.30 ± 0.01 µmol Pi (Table 1). This led to a 0.5 and 0.3 mmol/l reduction in medium Ca and Pi concentration of the supernatant, respectively (Table 1). The control supernatant Ca and Pi concentration was not significantly affected, and the high-Pi pellet did not redissolve after resuspension in the control medium, as similar levels of pellet calcium and phosphate were recovered after recentrifugation (Table 1). The high-Pi pellet resuspension significantly induced both BMP-2 and OPN compared with control medium, whereas the high-Pi supernatant did not (Figure 6a and b).
Table 1.
Phosphate and calcium levels in medium and nanocrystal pellets
| Day 3, medium | Day 3, pellet resuspensiona | ||||
|---|---|---|---|---|---|
| Day 0, medium (mmol/l) | Supernatant (mmol/l) | Pellet (µmol) | Supernatanta (mmol/l) | Pelleta (µmol) | |
| Phosphate | |||||
| Control | 0.97 ± 0.02 | 0.96 ± 0.03 | 0.01 ± 0.002 | 0.99 ± 0.02 | 0.02 ± 0.003 |
| High Pi | 3.06 ± 0.02 | 2.72 ± 0.09 | 0.30 ± 0.014 | 0.92 ± 0.06 | 0.31 ± 0.019 |
| Calcium | |||||
| Control | 2.27 ± 0.04 | 2.24 ± 0.09 | 0.02 ± 0.002 | 2.19 ± 0.04 | 0.01 ± 0.001 |
| High Pi | 2.27 ± 0.01 | 1.71 ± 0.06 | 0.53 ± 0.040 | 2.26 ± 0.05 | 0.51 ± 0.007 |
After centrifugation, day 3 pellets were resuspended in fresh control medium then recentrifuged.
Figure 6. Calcium phosphate nanocrystals, not free inorganic phosphate (Pi), induce bone morphogenetic protein-2 (BMP-2) and osteopontin (OPN) in mouse aortic smooth muscle cells.
(a, b) Effect of control (Con) or high-Pi medium supernatants or pellet resuspensions (nanocrystals) on expression of BMP-2 (a) and OPN (b; normalized to β-actin) after 24 h. *P<0.001 versus control pellet resuspension. (c, d) Effect of 10–200 µg/ml synthetic hydroxyapatite nanocrystals on the expression of BMP-2 (c) and OPN (d; normalized to β-actin) after 24 h. *P<0.001; #P<0.01; ‡P<0.05 versus control. HA, hydroxyapatite.
Synthetic nanocrystals induce BMP-2 and OPN
To further test whether the induction of gene expression is attributable to nanocrystals, we used synthetic hydroxyapatite nanocrystals <200 nm in diameter, the size range of the nanocrystals induced by high Pi. By assuming the Mw and formula of high-Pi-induced nanocrystals to be octacalcium phosphate, in the experiments with resuspended high-Pi nanocrystal pellets, we used crystals concentrations of ~30 µg/ml. Previous investigators have used concentrations of 100–200 µg/ml.6,29 Synthetic hydroxyapatite nanocrystals (10–200 µg/ml) dose-dependently induced expression of BMP-2 and OPN in MASMCs at 24 h (Figure 6c and d), with 25 µg/ml being the lowest dose at which a significant effect was observed. Consistent with the effect of high Pi (Figure 2a), the synthetic hydroxyapatite nanocrystals caused a greater induction of BMP-2 than that of OPN (Figure 6c and d).
DISCUSSION
Hyperphosphatemia is closely associated with vascular calcification, and elevated levels of Pi in cultured SMCs induce osteogenic genes. In this study, we describe the novel finding that calcium phosphate nanocrystals induce the expression of BMP-2 and OPN, genes associated with vascular calcification in vitro and in vivo.15,30
BMP-2 is a potent pro-osteogenic factor consistently associated with vascular calcification, which is expressed by both endothelial cells and SMCs.31 OPN deficiency in mouse SMCs in vitro promotes calcium deposition,22 but OPN has multiple functions, and probably multiple roles, in atherosclerosis and vascular calcification in vivo.32 Importantly, a key osteoblast regulatory factor, ALP, is not induced by high-Pi medium in these MASMCs (Figure 2a and b). The lack of ALP induction by high Pi was previously observed by others in SMCs and osteoblasts.13,24 Our finding that high-Pi medium induces expression of osterix, but not Cbfa1, is consistent with results of Mathew et al.14 and Prosdocimo et al.24 and suggests that high Pi is not sufficient to induce the full spectrum of osteogenic differentiation. In immortalized human SMC, Li et al.12 found Cbfa1 induction by high levels of Pi and its inhibition by knockdown of the Pi transporter Pit-1. Species differences and/or immortalization may explain this difference.
We set out to develop a murine cell model of high-Pi-induced vascular calcification. Following the protocols of previous studies, we observed a diffuse pattern of calcium deposition as described by others.12,14,24 Interestingly, we found similar levels of calcium deposition from high-Pi medium in the absence of cells, suggesting that it was not cell dependent. Indeed, calcification was actually inhibited by cells in the medium with 1 mmol/l excess Pi (Figure 3c), an effect that may be explained by a recent study showing that high-Pi medium transiently increases extracellular PPi.24 Our finding of cell-independent calcium deposition with 1 mmol/l excess Pi is consistent with those of Yang et al.33 and Young et al.27 showing crystalline calcium phosphate deposition in medium or serum with 1–1.3 mmol/l excess Pi. It also fits with those of Reynolds et al.,34 which shows that the presence or absence of SMCs did not affect the degree of calcification in serum-free high-Ca/Pi medium. Young et al.27 derived crystalline particles from Pi-supplemented serum-containing medium that consisted of colloids of hydroxyapatite mineral, albumin, and fetuin-A, an abundant serum protein that forms colloids with nascent calcium phosphate crystals, preventing further growth (Figure 5b; Heiss et al.26). Although the nanocrystals in our experiments may also be associated with serum proteins, such as fetuin-A, these proteins seem to be unnecessary for gene induction, as synthetic hydroxyapatite nanocrystals also had gene induction activity (Figure 6c and d).
We demonstrate that high-Pi-induced nanocrystals, rather than free Pi itself, may be the active factor that induces BMP-2 and OPN in MASMCs, as high-Pi-induced gene expression was prevented by the crystallization inhibitor PPi. Although we cannot exclude the possibility that PPi blocks the effect of free Pi on gene induction, to our knowledge, there is no precedent for such a phenomenon. Furthermore, at a much higher concentration (500 µm), PPi actually induces OPN expression.23 In support of our findings, the PPi analog, PFA, is known to block the induction of OPN by high-Pi medium.17,18 PFA has been used as an inhibitor of Pit-1; however its effects on calcification have been attributed to its direct inhibition of calcium crystal formation.19
Our in vitro findings suggest a potential role for nanocrystals in vivo. Nanocrystals are present within human calcification,6,35 consisting of hydroxyapatite, carbonate-substituted hydroxyapatite, and/or amorphous calcium phosphate.6,36 Nanocrystals may potentially arise, under permissive conditions, from circulating fetuin–mineral complexes,26,27 which are found at high levels in rat serum under conditions that cause medial calcification.37 Whether nanocrystals are present before osteochondrogenic changes in vivo is currently unknown. A number of studies show that osteochondrogenic gene expression seems to precede light microscopic evidence of matrix calcification.15,38–40 However, nanocrystals may precede microscopic matrix mineralization, and Neven et al.41 recently observed that both increased chondrogenic genes and calcification appear at the same time in uremic rats. More sensitive techniques that detect nanocrystals in the artery wall42 may be required to answer this important question.
Nanocrystals have pleiotropic effects, including the induction of inflammatory cytokines in macrophages,21 mitogenesis and matrix metalloproteinases in osteoblasts20 and fibroblasts,29 autophagy,43 and, under serum-free conditions, the induction of apoptosis in SMCs.6 Cheung and coworkers29 showed that nanocrystals were endocytosed, and our preliminary results also suggest these nanocrystals are endocytosed (data not shown). However, the molecular mechanism or pathway by which these nanocrystals act on gene expression remains to be elucidated. Ewence et al.6 showed that endocytosed nanocrystals were dissolved within lysosomes, causing a cytoplasmic calcium burst leading to apoptosis. It is also possible that nanocrystals directly affect DNA transcription complexes, as they have been reported to enter the nucleus and interact with histones.44 Nevertheless, our findings support the view proposed by Shanahan45 that vascular calcium crystals are far from inert and may promote the pro-inflammatory, pro-osteogenic environment associated with vascular calcification.
In summary, we have found that calcium phosphate nanocrystals regulate gene expression of SMCs in vitro. This adds a further dimension to the already complex network of interactions between the inflammatory cytokines, growth factors, hormones, matrix proteins, enzymes, and mineral ions that regulate vascular calcification in vivo.
MATERIALS AND METHODS
Cell culture
A primary cell line of MASMCs was cultured as previously described46 in 10% FBS–αMEM (Mediatech, Manassas, VA) and used at passages 6–8. Major experiments were replicated with similar results in two independent MASMC lines (data not shown). Human embryonic kidney-293 cells were cultured in 10% FBS–αMEM. For calcification and ALP assays, cells in 48-well plates (10,000 cells/cm2) were treated for the indicated times starting from 24 h after plating; in RNA experiments, MASMCs were plated in 6- or 12-well plates and treated for 24 h or 7 days, starting from 48 h after plating. When indicated, the media Pi concentration was increased using 0.5 mol/l sodium phosphate, pH 7.4 (a mixture of NaH2PO4 and Na2HPO4). Basal 10% FBS–αMEM medium contains ~1.0 mmol/l Pi. Unless otherwise stated in the results, ‘high-Pi’ medium refers to a medium with an additional 2 mmol/l Pi (~3 mmol/l final). In experiments in which Ca concentration was varied calcium-free Dulbecco’s modified Eagle’s medium (HyClone/ThermoFisher, Logan, UT) with added calcium chloride and 10% FBS was used. Levamisole and synthetic hydroxyapatite nanocrystals (<200 nm in diameter) were obtained from Sigma (St Louis, MO). Synthetic nanocrystals suspended in culture medium were sonicated before treatment of cells. Images of cells were acquired using an Olympus CKX41 microscope (Olympus, Center Valley, PA) and adjusted to the same extent for brightness and contrast using ImageJ software (NIH, Bethesda, MD).
ALP activity assay
ALP activity was assessed in quintuplicate colorimetrically using p-nitrophenol as substrate. Cells in 48-well plates were washed with phosphate-buffered saline, lysed in 100 µl lysis buffer (1 mmol/l MgCl2, 0.2% Igepal CA-630; Sigma), and sonicated. Enzyme activity (sigma units; µmol p-nitrophenol/h) was determined using p-nitrophenol phosphate (Sigma) as substrate. Values were normalized to total protein levels, as assessed by the Bradford method (Bio-Rad, Hercules, CA).
Calcium and phosphate assays
Calcium deposition was quantified by the o-cresolphthalein method as previously described.46 In experiments analyzing cell-free deposition, all the wells (with and without cells) were not washed with phosphate-buffered saline between removal of culture medium and addition of 0.6 mol/l HCl, as in the absence of cells calcium deposits did not adhere to the culture dish. Phosphate was quantified using a Malachite Green phosphate assay kit according to the manufacturer’s protocol (Biochain, Hayward, CA). Calcification was visualized by von Kossa or Alizarin red staining as previously described.30
RNA isolation and real-time PCR
Total RNA was isolated using TRIzol (Invitrogen, Carlsbad, CA) and one-step reverse transcriptase-quantitative PCR (Biochain) performed using gene-specific primers (Table 2) as previously described.46
Table 2.
PCR primer sequences
| Gene name | Forward primer (5′–3′) | Reverse primer (5′–3′) |
|---|---|---|
| β-Actin | GGCTGTATTCCCCTCCATCG | CCAGTTGGTAACAATGCCATGT |
| BMP-2 | CGGACTGCGGTCTCCTAA | GGGGAAGCAGCAACACTAGA |
| OPN | CCCGGTGAAAGTGACTGATT | TTCTTCAGAGGACACAGCATTC |
| Cbfa1 | CTACCAGCCTCACCATAC | AGGACAGCGACTTCATTC |
| Osx | GCCGCTTTGTGCCTTTGAAATG | CGTTATGCTCTTCCCAGACTCC |
| ALP | TGAATCGGAACAACCTGAC | CCACCAGCAAGAAGAAGC |
| MGP | GCCTGCGATGACTACAAG | CGAAACTCCACAACCAAATG |
| Pit-1 | ACGAGTGGGTAGAGAGTC | ATGGCGGATTAGAGAAAGG |
Abbreviations: ALP, alkaline phosphatase; BMP-2, bone morphogenetic factor-2; Cbfa1, core-binding-factor α1; MGP, matrix GLA protein; OPN, osteopontin; Osx, osterix.
Western blotting and enzyme-linked immunosorbent assay
Whole-cell lysates were prepared using lysis buffer supplemented with phosphatase and protease inhibitors, and western analysis was performed using standard protocols using antibodies against mouse OPN (R&D Systems, Minneapolis, MN) and α/β-tubulin (Cell Signaling, Danvers, MA). BMP-2 in MASMC conditioned medium was detected by enzyme-linked immunosorbent assay according to the manufacturer’s instructions (R&D Systems).
Treatment of cells with calcium phosphate nanocrystals
Control or high-Pi medium (1 ml) was incubated at 37 °C for 3 days and then centrifuged at 16,000 × g for 1 h.27 The pellets (nanocrystals), resuspended in 1 ml fresh control medium (pellet resuspensions), and the supernatants were then each used to treat cells and RNA extracted after 24 h. Alternatively, pellets dissolved in 0.6 mol/l HCl and supernatants diluted with water were analyzed for calcium and phosphate concentrations.
Scanning electron microscopy, energy-dispersive spectroscopy, and atomic force microscopy
High-Pi medium (1 ml) was incubated at 37 °C for 3 days, then centrifuged at 16,000 × g for 1 h. Pellets were washed with H2O, then recentrifuged. For scanning electron microscopy and electron-dispersive spectroscopy, the pellets were dried, transferred onto carbon tape, and coated with gold (5 nm) before imaging using a JEOL JSM-6700F (JEOL, Tokyo, Japan); the Ca:P ratio was determined with on-board energy dispersive spectroscopy and EDAX Genesis software (Ametek, NJ). For atomic force microscopy, the pellets were resuspended in H2O and transferred onto mica disks, then dried with nitrogen gas. Samples were scanned in tapping mode using a Veeco Bioscope II and RTESP cantilever (Veeco, Santa Barbara, CA). Data were analyzed using SPIP software (version 4.8, Nanoscience Instruments, Phoenix, AR).
Statistical analysis
All experiments were performed in at least triplicate per treatment and repeated in three independent experiments. Results are presented as the mean ± s.e.m. of data from three experiments combined unless otherwise stated. Data were analyzed by unpaired t-test (between two groups) or one-way analysis of varaince with Tukey or Dunnett post-test analysis (for three or more groups) using Graphpad Prism software (San Diego, CA); a P value of <0.05 was considered significant.
ACKNOWLEDGMENTS
We thank S Sharma (California NanoSystems Institute, UCLA) for help with atomic force microscopy and I Martini (Molecular Instrumentation Center, UCLA) for scanning electron microscopy and electron dispersive spectroscopy. This work was supported by the National Institutes of Health (DK081346 to YT, HL081202 to LLD) and the American Heart Association (0825033F to APS).
Footnotes
DISCLOSURE
All the authors declared no competing interests.
REFERENCES
- 1.Demer LL, Tintut Y. Vascular calcification: pathobiology of a multifaceted disease. Circulation. 2008;117:2938–2948. doi: 10.1161/CIRCULATIONAHA.107.743161. [DOI] [PMC free article] [PubMed] [Google Scholar]
- 2.Giachelli CM. The emerging role of phosphate in vascular calcification. Kidney Int. 2009;75:890–897. doi: 10.1038/ki.2008.644. [DOI] [PMC free article] [PubMed] [Google Scholar]
- 3.Shao JS, Cai J, Towler DA. Molecular mechanisms of vascular calcification: lessons learned from the aorta. Arterioscler Thromb Vasc Biol. 2006;26:1423–1430. doi: 10.1161/01.ATV.0000220441.42041.20. [DOI] [PubMed] [Google Scholar]
- 4.Doherty TM, Fitzpatrick LA, Inoue D, et al. Molecular, endocrine, and genetic mechanisms of arterial calcification. Endocr Rev. 2004;25:629–672. doi: 10.1210/er.2003-0015. [DOI] [PubMed] [Google Scholar]
- 5.Neven E, Dauwe S, De Broe ME, et al. Endochondral bone formation is involved in media calcification in rats and in men. Kidney Int. 2007;72:574–581. doi: 10.1038/sj.ki.5002353. [DOI] [PubMed] [Google Scholar]
- 6.Ewence AE, Bootman M, Roderick HL, et al. Calcium phosphate crystals induce cell death in human vascular smooth muscle cells: a potential mechanism in atherosclerotic plaque destabilization. Circ Res. 2008;103:e28–e34. doi: 10.1161/CIRCRESAHA.108.181305. [DOI] [PubMed] [Google Scholar]
- 7.Hoshino T, Chow LA, Hsu JJ, et al. Mechanical stress analysis of a rigid inclusion in distensible material: a model of atherosclerotic calcification and plaque vulnerability. Am J Physiol Heart Circ Physiol. 2009;297:H802–H810. doi: 10.1152/ajpheart.00318.2009. [DOI] [PMC free article] [PubMed] [Google Scholar]
- 8.Chen JH, Yip CY, Sone ED, et al. Identification and characterization of aortic valve mesenchymal progenitor cells with robust osteogenic calcification potential. Am J Pathol. 2009;174:1109–1119. doi: 10.2353/ajpath.2009.080750. [DOI] [PMC free article] [PubMed] [Google Scholar]
- 9.Rajamannan NM, Subramaniam M, Rickard D, et al. Human aortic valve calcification is associated with an osteoblast phenotype. Circulation. 2003;107:2181–2184. doi: 10.1161/01.CIR.0000070591.21548.69. [DOI] [PMC free article] [PubMed] [Google Scholar]
- 10.Abedin M, Lim J, Tang TB, et al. N-3 fatty acids inhibit vascular calcification via the p38-mitogen-activated protein kinase and peroxisome proliferator-activated receptor-gamma pathways. Circ Res. 2006;98:727–729. doi: 10.1161/01.RES.0000216009.68958.e6. [DOI] [PubMed] [Google Scholar]
- 11.Collett GD, Sage AP, Kirton JP, et al. Axl/phosphatidylinositol 3-kinase signaling inhibits mineral deposition by vascular smooth muscle cells. Circ Res. 2007;100:502–509. doi: 10.1161/01.RES.0000258854.03388.02. [DOI] [PubMed] [Google Scholar]
- 12.Li X, Yang HY, Giachelli CM. Role of the sodium-dependent phosphate cotransporter, Pit-1, in vascular smooth muscle cell calcification. Circ Res. 2006;98:905–912. doi: 10.1161/01.RES.0000216409.20863.e7. [DOI] [PubMed] [Google Scholar]
- 13.Harmey D, Hessle L, Narisawa S, et al. Concerted regulation of inorganic pyrophosphate and osteopontin by akp2, enpp1, and ank: an integrated model of the pathogenesis of mineralization disorders. Am J Pathol. 2004;164:1199–1209. doi: 10.1016/S0002-9440(10)63208-7. [DOI] [PMC free article] [PubMed] [Google Scholar]
- 14.Mathew S, Tustison KS, Sugatani T, et al. The mechanism of phosphorus as a cardiovascular risk factor in CKD. J Am Soc Nephrol. 2008;19:1092–1105. doi: 10.1681/ASN.2007070760. [DOI] [PMC free article] [PubMed] [Google Scholar]
- 15.El-Abbadi MM, Pai AS, Leaf EM, et al. Phosphate feeding induces arterial medial calcification in uremic mice: role of serum phosphorus, fibroblast growth factor-23, and osteopontin. Kidney Int. 2009;75:1297–1307. doi: 10.1038/ki.2009.83. [DOI] [PMC free article] [PubMed] [Google Scholar]
- 16.Neven E, Dams G, Postnov A, et al. Adequate phosphate binding with lanthanum carbonate attenuates arterial calcification in chronic renal failure rats. Nephrol Dial Transplant. 2009;24:1790–1799. doi: 10.1093/ndt/gfn737. [DOI] [PubMed] [Google Scholar]
- 17.Beck GR, Jr, Zerler B, Moran E. Phosphate is a specific signal for induction of osteopontin gene expression. Proc Natl Acad Sci USA. 2000;97:8352–8357. doi: 10.1073/pnas.140021997. [DOI] [PMC free article] [PubMed] [Google Scholar]
- 18.Chen NX, O’Neill KD, Duan D, et al. Phosphorus and uremic serum up-regulate osteopontin expression in vascular smooth muscle cells. Kidney Int. 2002;62:1724–1731. doi: 10.1046/j.1523-1755.2002.00625.x. [DOI] [PubMed] [Google Scholar]
- 19.Villa-Bellosta R, Sorribas V. Phosphonoformic acid prevents vascular smooth muscle cell calcification by inhibiting calcium-phosphate deposition. Arterioscler Thromb Vasc Biol. 2009;29:761–766. doi: 10.1161/ATVBAHA.108.183384. [DOI] [PubMed] [Google Scholar]
- 20.Major ML, Cheung HS, Misra RP. Basic calcium phosphate crystals activate c-fos expression through a Ras/ERK dependent signaling mechanism. Biochem Biophys Res Commun. 2007;355:654–660. doi: 10.1016/j.bbrc.2007.01.177. [DOI] [PMC free article] [PubMed] [Google Scholar]
- 21.Nadra I, Mason JC, Philippidis P, et al. Proinflammatory activation of macrophages by basic calcium phosphate crystals via protein kinase C and MAP kinase pathways: a vicious cycle of inflammation and arterial calcification? Circ Res. 2005;96:1248–1256. doi: 10.1161/01.RES.0000171451.88616.c2. [DOI] [PubMed] [Google Scholar]
- 22.Speer MY, Chien YC, Quan M, et al. Smooth muscle cells deficient in osteopontin have enhanced susceptibility to calcification in vitro. Cardiovasc Res. 2005;66:324–333. doi: 10.1016/j.cardiores.2005.01.023. [DOI] [PubMed] [Google Scholar]
- 23.Addison WN, Azari F, Sorensen ES, et al. Pyrophosphate inhibits mineralization of osteoblast cultures by binding to mineral, up-regulating osteopontin, and inhibiting alkaline phosphatase activity. J Biol Chem. 2007;282:15872–15883. doi: 10.1074/jbc.M701116200. [DOI] [PubMed] [Google Scholar]
- 24.Prosdocimo DA, Wyler SC, Romani A, et al. Regulation of vascular smooth muscle cell calcification by extracellular pyrophosphate homeostasis: synergistic modulation by cyclic AMP and hyperphosphatemia. Am J Physiol Cell Physiol. 2010;298:C702–C713. doi: 10.1152/ajpcell.00419.2009. [DOI] [PMC free article] [PubMed] [Google Scholar]
- 25.Reynolds JL, Joannides AJ, Skepper JN, et al. Human vascular smooth muscle cells undergo vesicle-mediated calcification in response to changes in extracellular calcium and phosphate concentrations: a potential mechanism for accelerated vascular calcification in ESRD. J Am Soc Nephrol. 2004;15:2857–2867. doi: 10.1097/01.ASN.0000141960.01035.28. [DOI] [PubMed] [Google Scholar]
- 26.Heiss A, Eckert T, Aretz A, et al. Hierarchical role of fetuin-A and acidic serum proteins in the formation and stabilization of calcium phosphate particles. J Biol Chem. 2008;283:14815–14825. doi: 10.1074/jbc.M709938200. [DOI] [PubMed] [Google Scholar]
- 27.Young JD, Martel J, Young D, et al. Characterization of granulations of calcium and apatite in serum as pleomorphic mineralo-protein complexes and as precursors of putative nanobacteria. PLoS One. 2009;4:e5421. doi: 10.1371/journal.pone.0005421. [DOI] [PMC free article] [PubMed] [Google Scholar]
- 28.Suzuki M, Shimokawa H, Takagi Y, et al. Calcium-binding properties of fetuin in fetal bovine serum. J Exp Zool. 1994;270:501–507. doi: 10.1002/jez.1402700603. [DOI] [PubMed] [Google Scholar]
- 29.Sun Y, Zeng XR, Wenger L, et al. Basic calcium phosphate crystals stimulate the endocytotic activity of cells-inhibition by anti-calcification agents. Biochem Biophys Res Commun. 2003;312:1053–1059. doi: 10.1016/j.bbrc.2003.11.048. [DOI] [PubMed] [Google Scholar]
- 30.Bostrom K, Watson KE, Horn S, et al. Bone morphogenetic protein expression in human atherosclerotic lesions. J Clin Invest. 1993;91:1800–1809. doi: 10.1172/JCI116391. [DOI] [PMC free article] [PubMed] [Google Scholar]
- 31.Cola C, Almeida M, Li D, et al. Regulatory role of endothelium in the expression of genes affecting arterial calcification. Biochem Biophys Res Commun. 2004;320:424–427. doi: 10.1016/j.bbrc.2004.05.181. [DOI] [PubMed] [Google Scholar]
- 32.Mizobuchi M, Towler D, Slatopolsky E. Vascular calcification: the killer of patients with chronic kidney disease. J Am Soc Nephrol. 2009;20:1453–1464. doi: 10.1681/ASN.2008070692. [DOI] [PubMed] [Google Scholar]
- 33.Yang H, Curinga G, Giachelli CM. Elevated extracellular calcium levels induce smooth muscle cell matrix mineralization in vitro. Kidney Int. 2004;66:2293–2299. doi: 10.1111/j.1523-1755.2004.66015.x. [DOI] [PubMed] [Google Scholar]
- 34.Reynolds JL, Skepper JN, McNair R, et al. Multifunctional roles for serum protein fetuin-a in inhibition of human vascular smooth muscle cell calcification. J Am Soc Nephrol. 2005;16:2920–2930. doi: 10.1681/ASN.2004100895. [DOI] [PubMed] [Google Scholar]
- 35.Reid JD, Andersen ME. Medial calcification (whitlockite) in the aorta. Atherosclerosis. 1993;101:213–224. doi: 10.1016/0021-9150(93)90118-e. [DOI] [PubMed] [Google Scholar]
- 36.Verberckmoes SC, Persy V, Behets GJ, et al. Uremia-related vascular calcification: more than apatite deposition. Kidney Int. 2007;71:298–303. doi: 10.1038/sj.ki.5002028. [DOI] [PubMed] [Google Scholar]
- 37.Price PA, Williamson MK, Nguyen TM, et al. Serum levels of the fetuin-mineral complex correlate with artery calcification in the rat. J Biol Chem. 2004;279:1594–1600. doi: 10.1074/jbc.M305199200. [DOI] [PubMed] [Google Scholar]
- 38.Graciolli FG, Neves KR, dos Reis LM, et al. Phosphorus overload and PTH induce aortic expression of Runx2 in experimental uraemia. Nephrol Dial Transplant. 2009;24:1416–1421. doi: 10.1093/ndt/gfn686. [DOI] [PubMed] [Google Scholar]
- 39.Koleganova N, Piecha G, Ritz E, et al. Arterial calcification in patients with chronic kidney disease. Nephrol Dial Transplant. 2009;24:2488–2496. doi: 10.1093/ndt/gfp137. [DOI] [PubMed] [Google Scholar]
- 40.Mizobuchi M, Finch JL, Martin DR, et al. Differential effects of vitamin D receptor activators on vascular calcification in uremic rats. Kidney Int. 2007;72:709–715. doi: 10.1038/sj.ki.5002406. [DOI] [PubMed] [Google Scholar]
- 41.Neven E, Persy V, Dauwe S, et al. Chondrocyte Rather Than Osteoblast Conversion of Vascular Cells Underlies Medial Calcification in Uremic Rats. Arterioscler Thromb Vasc Biol. 2010;30:1741–1750. doi: 10.1161/ATVBAHA.110.204834. [DOI] [PubMed] [Google Scholar]
- 42.Aikawa E, Nahrendorf M, Figueiredo JL, et al. Osteogenesis associates with inflammation in early-stage atherosclerosis evaluated by molecular imaging in vivo. Circulation. 2007;116:2841–2850. doi: 10.1161/CIRCULATIONAHA.107.732867. [DOI] [PubMed] [Google Scholar]
- 43.Stern ST, Zolnik BS, McLeland CB, et al. Induction of autophagy in porcine kidney cells by quantum dots: a common cellular response to nanomaterials? Toxicol Sci. 2008;106:140–152. doi: 10.1093/toxsci/kfn137. [DOI] [PMC free article] [PubMed] [Google Scholar]
- 44.Nabiev I, Mitchell S, Davies A, et al. Nonfunctionalized nanocrystals can exploit a cell’s active transport machinery delivering them to specific nuclear and cytoplasmic compartments. Nano Lett. 2007;7:3452–3461. doi: 10.1021/nl0719832. [DOI] [PubMed] [Google Scholar]
- 45.Shanahan CM. Inflammation ushers in calcification: a cycle of damage and protection? Circulation. 2007;116:2782–2785. doi: 10.1161/CIRCULATIONAHA.107.749655. [DOI] [PubMed] [Google Scholar]
- 46.Huang MS, Sage AP, Lu J, et al. Phosphate and pyrophosphate mediate PKA-induced vascular cell calcification. Biochem Biophys Res Commun. 2008;374:553–558. doi: 10.1016/j.bbrc.2008.07.062. [DOI] [PMC free article] [PubMed] [Google Scholar]


