Abstract
There is a growing concern about chronic diseases and other health problems related to diet including obesity and cancer. Dietary intake provides valuable insights for mounting intervention programs for prevention of chronic diseases. Measuring accurate dietary intake is considered to be an open research problem in the nutrition and health fields. In this paper, we describe a novel mobile telephone food record that provides a measure of daily food and nutrient intake. Our approach includes the use of image analysis tools for identification and quantification of food that is consumed at a meal. Images obtained before and after foods are eaten are used to estimate the amount and type of food consumed. The mobile device provides a unique vehicle for collecting dietary information that reduces the burden on respondents that are obtained using more classical approaches for dietary assessment. We describe our approach to image analysis that includes the segmentation of food items, features used to identify foods, a method for automatic portion estimation, and our overall system architecture for collecting the food intake information.
Index Terms: dietary assessment, diet record method, mobile telephone, mobile device, classification, pattern recognition, image texture, feature extraction, volume estimation
1. INTRODUCTION
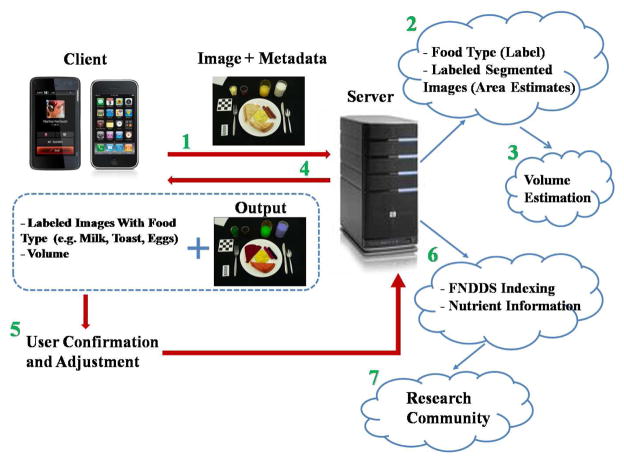
There is a growing concern about chronic diseases and other health problems related to diet including obesity and cancer. Dietary intake, the process of determining what someone eats during the course of a day, provides valuable insights for mounting intervention programs for prevention of many chronic diseases. Accurate methods and tools to assess food and nutrient intake are essential in monitoring the nutritional status of patients for epidemiological and clinical research on the association between diet and health. Measuring accurate dietary intake is considered to be an open research problem in the nutrition and health fields. The accurate assessment of diet is problematic, especially in adolescents [1]. The availability of “smart” mobile telephones with higher resolution imaging capability, improved memory capacity, network connectivity, and faster processors allow these devices to be used in health care applications. Mobile telephones can provide a unique mechanism for collecting dietary information that reduces burden on record keepers. A dietary assessment application for a mobile telephone would be of value to practicing dietitians and researchers [2]. Previous results among adolescents showed that dietary assessment methods using a technology-based approach, e.g., a personal digital assistant with or without a camera or a disposable camera, were preferred over the traditional paper food record [3]. This suggests that for adolescents, dietary methods that incorporate new mobile technology may improve cooperation and accuracy. To adequately address these challenges, we describe a dietary assessment system that we have developed using a mobile device (e.g., a mobile telephone or PDA-like device) to provide a measure of daily food and nutrient intake. In this paper, we describe the image analysis methods we have developed for the mobile telephone food record we outlined in [4]. The system must be easy to use and not place a burden on the user by having to take multiple images, carry another device or attaching other sensors to their mobile device. Figure 1 shows the overall architecture of our proposed system, which we describe in detail in Section 3. Our goal is to use a mobile device with a built-in camera, network connectivity, integrated image analysis and visualization tools, and a nutrient database, to allow a user to easily record foods eaten. Images acquired before and after foods are eaten can be used to estimate the amount of food consumed [5, 6]. We have deployed a prototype system on the iPhone. This prototype system is only available for testing, not for commercial distribution, and it is currently being tested by professional dietitians and nutritionists in the Department of Foods and Nutrition at Purdue University for various adolescent and adult controlled diet studies.
Fig. 1.
Overall System Architecture for Dietary Assessment.
2. IMAGE ANALYSIS SYSTEM
This section describes the proposed methods to automatically estimate the food consumed at a meal from images acquired using the embedded camera of a mobile device.
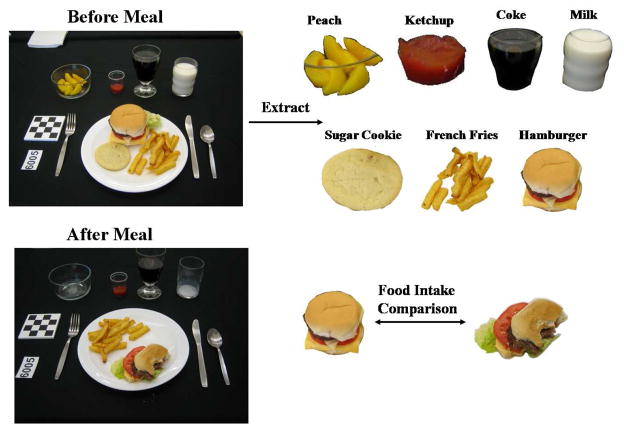
Our approach is shown in Figure 2. Each food item is segmented, identified, and its volume is estimated. “Before” and “after” meal images are used to estimate the food intake. From this information, the energy and nutrients consumed is determined.
Fig. 2.
An Ideal Food Image Analysis System.
Automatic identification of food items in an image is not an easy problem. We fully understand that we will not be able to recognize every food. Some food items look very similar, e.g. margarine and butter. In other cases, the packaging or the way the food is served will present problems for automatic recognition. In some cases, if a food is not correctly identified or its volume is incorrect it may not make much difference with respect to the energy or nutrients consumed. For example, if our system identifies a “brownie” as “chocolate cake” there is not a significant difference in the energy or nutrient content. Similarly, if we incorrectly estimate the amount of lettuce consumed this will also have little impact on the estimate of the energy or nutrients consumed in the meal due to the low energy content of lettuce [3, 2]. Again, we emphasize that our goal is to provide a tool for better assessment of dietary intake to professional dietitians and researchers that is currently available using existing methods such as a food record, the 24-hour dietary recall, and a food frequency questionnaire.
2.1. Image Segmentation
We have developed a very simple protocol for users to measure the amount of food in the image [3, 2]. This protocol involves the use of a calibrated fiducial marker consisting of a compact color checkerboard pattern that is placed in the field of view of the camera. This allow us to do geometric and color correction to the images so that the amount of food present can be estimated.
We have investigated a two step approach to segment food items from an image using connected components [5]. However, due to the increasing complexity of the images collected from our studies, more sophisticated segmentation techniques are needed to better perform this task.
Active contours are used to detect objects in an image using techniques of curve evolution. The basic idea is to deform an initial curve to boundary of the object under some constraints from the image. We employed the approach described in [7] to partition an image into foreground and background regions. Let ui,0 be the ith channel of an image with i = 1, …, N and C the evolving curve. Let and be two unknown constant vectors. The goal is to minimize the following energy function
| (1) |
where μ > 0 and are parameters for each channel. In our implementation, we used the RGB color components of the image.
The active contours model works well when the food items are separated from each other, however, it sometimes fails to distinguish multiple food items that are connected. As a result, we only use this approach in the controlled diet studies where images of simple types of food are provided.
Normalized cut is a graph partition method first proposed by Shi and Malik [8]. This method treats an image pixel as a node of a graph and considers segmentation as a graph partitioning problem. This approach measures both the total dissimilarity between the different groups as well as the total similarity within the groups. The optimal solution of splitting points is obtained by solving a generalized eigenvalue problem. Various image features such as intensity, color, texture, contour continuity, motion are treated in one uniform framework. Let X(i) be the spatial location of node i, i.e., the coordinates in the original image I, and F(i) be a feature vector, we can define the graph edge weight connecting the two nodes i and j as
| (2) |
We use components of the L*a*b* color space as the images features of the normalized cut.
2.2. Food Features
Two types of features are extracted/measured for each segmented food region: color features and texture features. As noted above, as part of the protocol for obtaining food images the subjects are asked to take images with a calibrated fiducial marker consisting of a color checkerboard that is placed in the field of view of the camera. This allows us to correct for color imbalance in the mobile device’s camera. For color features, the average value of the pixel intensity (i.e. the gray scale) along with two color components are used. The color components are obtained by first converting the image to the CIELAB color space. The L* component is the known as the luminance and the a* and b* are the two chrominance components. For texture features, we used Gabor filters to measure local texture properties in the frequency domain. In particular, we use the Gabor filter-bank proposed in [9] where texture features are obtained by subjecting each image (or in our case each block) to a Gabor filtering operation in a window around each pixel and then estimating the mean and the standard deviation of the energy of the filtered image. In our implementation, we divide each segmented food item into N ×N non-overlapped blocks and used Gabor filters on each block. We use the following Gabor parameters: 4 scales and 6 orientations.
2.3. Classification
For classification of the food item, we used a support vector machine (SVM). Constructing a classifier typically requires training data. Each element in the training set contains one class label and several “attributes” (features). The feature vectors used for our work contain 51 entries, namely, 48 texture features and 3 color features. The feature vectors for the training images (which contain only one food item in the image) were extracted and a training model was generated using the SVM with a Gaussian radial basis kernel. We used the LIBSVM [10], a library for support vector machines.
2.4. Volume Estimation
The labeled food type along with the segmented image is sent to the automatic portion estimation module where camera parameter estimation and model reconstruction are utilized to determine the volume of food, from which the nutritional content is then determined. Our volume estimation consists of a camera calibration step and a 3D volume reconstruction step. Figure 3 illustrates this process. Two images are used as inputs: one is a meal image taken by the user, the other is the segmented image described in the previous section. The camera calibration step estimates camera parameters comprised of intrinsic parameters (distortion, the principal point, and focal length) and extrinsic parameters (camera translation and orientation). We use the fiducial marker discussed above as a reference for the scale and pose of the food item identified. The fiducial marker is detected in the image and the pose is estimated. The system for volume estimation partitions the space of objects into “geometric classes,” each with their own set of parameters. Feature points are extracted from the segmented region image and unprojected into the 3D space. A 3D volume is reconstructed by the unprojected points based on the parameters of the geometric class. Once the volume estimate for a food item is computed, the nutrient intake consumed is derived from the estimate based on the USDA Food and Nutrient Database for Dietary Studies (FNDDS) [11]. A complete description of our volume estimation methods is presented in [6].
Fig. 3.
Our Food Portion Estimation Process.
3. OVERALL ARCHITECTURE
We have developed two different configurations for our dietary assessment system: a standalone configuration and a client-server configuration. Each approach has potential benefits depending on the operational scenario.
The Client-Server configuration is shown in Figure 1. In most applications this will be the default mode of operation. The process starts with the user sending the image and metadata (e.g. date, time, and perhaps GPS location information) to the server over the network (Step 1) for food identification and volume estimation (Step 2 and 3), the results of Step 2 and 3 are sent back to the client where the user can confirm and/or adjust this information if necessary (Step 4). Once the server obtains the user confirmation (Step 5), food consumption information is stored in another databases at the server, and is used for finding the nutrient information using the FNDDS database [11] (Step 6). The FNDDS database contains the most common foods consumed in the U.S., their nutrient values, and weights for typical food portions. Finally, these results can be sent to dietitians and nutritionists in the research community or the user for further analysis (Step 7). A prototype system has been deployed on the Apple iPhone as the client and we have verified its functionality with various combination of foods. A prototype of the client software has also been deployed on the Nokia N810 Internet Tablet.
It is important to note that our system has two modes for user input. In the ”automatic mode” the label of the food item, the segmented image, and the volume estimation can be adjusted/resized after automatic analysis by the user using the touch screen on the mobile device. These corrections are then used for nutrient estimation using the FNDDS. The other mode concerns the case where no image is available. For some scenarios it might be impossible for users to acquire meal images. For example, the user may not have their mobile telephone with them or may have forgotten to acquire meal images. To address these situations, we developed an Alternative Method in our system that is based on user interaction and food search using the FNDDS database [11]. With the help of experts from the Foods and Nutrition Department at Purdue University, the Alternative Method captures sufficient information for a dietitian to perform food and nutrient analysis, including date and time, food name, measure description, and the amount of intake.
The standalone configuration performs all the image analysis and volume estimation on the mobile device. By doing the image analysis on the device the user does not need to rely on network connectivity. One of the main disadvantages of this approach is the higher battery consumption on the mobile device.
4. EXPERIMENTAL RESULTS
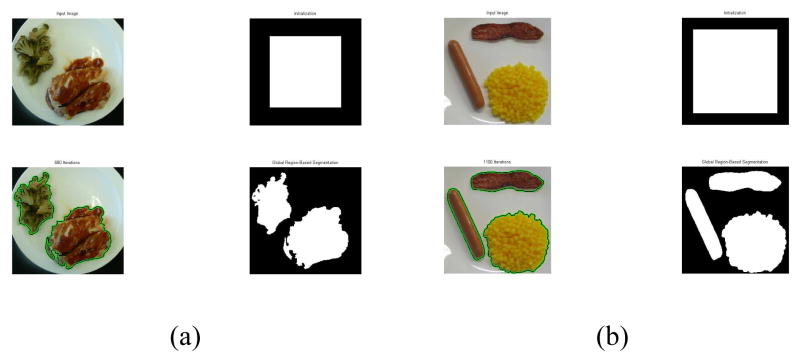
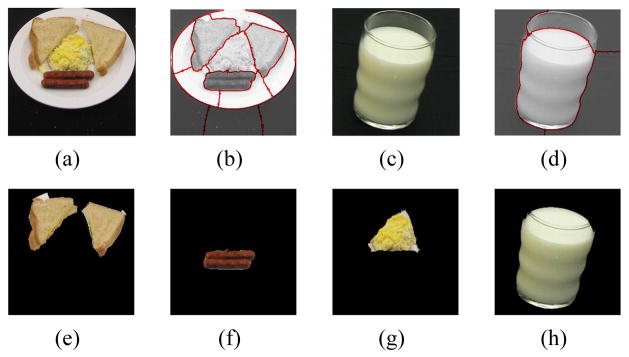
Several controlled diet studies were conducted by the Department of Foods and Nutrition at Purdue University whereby participants were asked to take pictures of their food before and after meals [2]. These meal images were used for our experiments. Currently, we have collected more than 3000 images in our image database. To assess the accuracy of our various segmentation methods, we obtained groundtruth segmentation data for the images. For each image, we manually traced the contour of each food item and generated corresponding mask images along with the correct food labels. Since these were controlled studies the correct nutrient information was also available. Figure 4 and Figure 5 show sample results from the use of active contour and normalized cut segmentation, respectively.
Fig. 4.
Sample Results of our Active Contour.(a) and (b) each contains the original image (upper left), initial contour (upper right), segmented object boundary (lower left), and binary mask (lower right).
Fig. 5.
Sample Results of Normalized Cut. (a) and (c) are the original images, (b) and (d) show the segmented object boundary, (e)–(h) are the extracted objects, respectively.
For our classification tests we considered 19 food items from 3 different meal events (total of 63 images). All images were acquired in the same room with the same lighting conditions. Three experiments were conducted each with different number of images used for training and the number of images used for testing. For these experiments, we used the groundtruth segmentation data to evaluate the performance of the classification. First, we considered 10% of images for training and the rest, 90%, for testing. In the second experiment we considered 25% of images for training and 75% for testing. We then considered 50% of images for training and for testing in the third experiment. A total of 1392 classifications were performed in our experiments. Table 1 presents results from the three experiments in terms of the average of correct classifications. We randomly selected training and testing data, therefore, when we consider only 10% of the data for training purposes, each data item has a large influence on the classifier’s performance. Some foods are inherently difficult to classify due to their similarity in the feature space we use. Examples of such errors are scrambled eggs misclassified as margarine and Catalina dressing misclassified as ketchup. We also have shown from our experiments that the performance of image segmentation plays a crucial role in achieving correct classification results.
Table 1.
Classification Accuracy of Food Items Using Different Number of Training Images.
| Percentage of Training Data | Percentage of Correct Classification | Percentage of Misreported Nutrient Information |
|---|---|---|
| 10% | 88.1% | 10% |
| 25% | 94.4% | 3% |
| 50% | 97.2% | 1% |
Nutrient information and meal images were collected from the controlled studies where a total of 78 participants (26 males, 52 females) ages 11 to 18 years used our system. The energy intake measured from the known food items for each meal was used to validate the performance of our system. Based on the the number of images used for training, we estimated the mean percentage error of our automatic methods compared to nutrient data collected from the studies as shown in Table 1. With 10% training data, the automatic method reported within a 10% margin of the correct nutrient information. With 25% training data, the automatic method improved to within a 3% margin of the correct nutrient information. With 50% training data, the improvement was within 1% margin of the correct nutrient information. Our experimental results indicated that our mobile telephone food record is a valid and accurate tool for dietary assessment.
5. CONCLUSIONS AND DISCUSSION
In this paper we described the development of a dietary assessment system using mobile devices. As we indicated, measuring accurate dietary intake is an open research problem in the nutrition and health fields. We feel we have developed a tool that will be useful for replacing the traditional food record methods currently used. We are continuing to refine and develop the system to increase its accuracy and usability.
Acknowledgments
We would like to thank our colleagues and collaborators, TusaRebecca Schap and Bethany Six of the Department of Foods and Nutrition; Professor David Ebert and his graduate students Junghoon Chae, SungYe Kim, Karl Ostmo, and Insoo Woo of the School of Electrical and Computer Engineering at Purdue University for their help in collecting and processing the images used in our studies. More information about our project can be found at www.tadaproject.org.
This work was sponsored by grants from the National Institutes of Health under grants NIDDK 1R01DK073711-01A1 and NCI 1U01CA130784-01.
References
- 1.Livingstone M, Robson P, Wallace J. Issues in dietary intake assessment of children and adolescents. British Journal of Nutrition. 2004;92:S213–S222. doi: 10.1079/bjn20041169. [DOI] [PubMed] [Google Scholar]
- 2.Six B, Schap T, Zhu F, Mariappan A, Bosch M, Delp E, Ebert D, Kerr D, Boushey C. Evidence-based development of a mobile telephone food record. Journal of American Dietetic Association. 2010 January;:74–79. doi: 10.1016/j.jada.2009.10.010. [DOI] [PMC free article] [PubMed] [Google Scholar]
- 3.Boushey C, Kerr D, Wright J, Lutes K, Ebert D, Delp E. Use of technology in children’s dietary assessment. European Journal of Clinical Nutrition. 2009:S50–S57. doi: 10.1038/ejcn.2008.65. [DOI] [PMC free article] [PubMed] [Google Scholar]
- 4.Zhu F, Mariappan A, Kerr D, Boushey C, Lutes K, Ebert D, Delp E. Technology-assisted dietary assessment. Proceedings of the IS&T/SPIE Conference on Computational Imaging VI; San Jose, CA. January 2008; [DOI] [PMC free article] [PubMed] [Google Scholar]
- 5.Mariappan A, Bosch M, Zhu F, Boushey CJ, Kerr DA, Ebert DS, Delp EJ. Personal dietary assessment using mobile devices. Proceedings of the IS&T/SPIE Conference on Computational Imaging VII; San Jose, CA. January 2009; [DOI] [PMC free article] [PubMed] [Google Scholar]
- 6.Woo I, Otsmo K, Kim S, Ebert DS, Delp EJ, Boushey CJ. Automatic portion estimation and visual refinement in mobile dietary assessment. Proceedings of the IS&T/SPIE Conference on Computational Imaging VIII; San Jose, CA. January 2010; [DOI] [PMC free article] [PubMed] [Google Scholar]
- 7.Chan T, Sandberg B, Vese L. Active contours without edges for vector-valued images. Journal of Visual Communication and Image Representation. 2000;11(2):130–141. [Google Scholar]
- 8.Shi J, Malik J. Normalized cuts and image segmentation. IEEE Transactions on pattern analysis and machine intelligence. 2000;22(8):888–905. [Google Scholar]
- 9.Jain A, Farrokhnia F. Unsupervised texture segmentation using gabor filters. Pattern recognition. 1991;24(12):1167–1186. [Google Scholar]
- 10.Chang CC, Lin CJ. LIBSVM: a library for support vector machines. 2001 software available at http://www.csie.ntu.edu.tw/cjlin/libsvm.
- 11.Usda food and nutrient database for dietary studies, 1.0. Beltsville, MD: Agricultural Research Service, Food Surveys Research Group; 2004. [Google Scholar]


