

Abstract
The purpose of our study was to validate the ability of pinhole micro-single-photon emission computed tomography/computed tomography (SPECT/CT) to 1) accurately resolve the intratumoral dispersion pattern and 2) quantify the infection percentage in solid tumors of an oncolytic measles virus encoding the human sodium iodide symporter (MV-NIS). NIS RNA level and dispersion pattern were determined in control and MV-NIS infected BxPC-3 pancreatic tumor cells and mouse xenografts using quantitative, real-time, reverse transcriptase, polymerase chain reaction, autoradiography, and immunohistochemistry (IHC). Mice with BxPC-3 xenografts were imaged with 123I or 99TcO4 micro-SPECT/CT. Tumor dimensions and radionuclide localization were determined with imaging software. Linear regression and correlation analyses were performed to determine the relationship between tumor infection percentage and radionuclide uptake (% injected dose per gram) above background and a highly significant correlation was observed (r2 = 0.947). A detection threshold of 1.5-fold above the control tumor uptake (background) yielded a sensitivity of 2.7% MV-NIS infected tumor cells. We reliably resolved multiple distinct intratumoral zones of infection from noninfected regions. Pinhole micro-SPECT/CT imaging using the NIS reporter demonstrated precise localization and quantitation of oncolytic MV-NIS infection and can replace more time-consuming and expensive analyses (eg, autoradiography and IHC) that require animal sacrifice.
Keywords: NIS, measles virus, micro-SPECT/CT, oncolytic virus, quantitation, sodium iodide symporter
INTRODUCTION
Oncolytic viruses that can selectively replicate to high levels in tumor cells are a promising strategy for targeted cancer therapy. To facilitate in vivo monitoring of viral delivery and tumor response, several viruses including replicating 1, 2 and nonreplicating adenoviruses 3, 4, vesicular stomatitis virus 5, and measles virus (MV) 6 have been genetically engineered to express the sodium iodide symporter (NIS). NIS is a protein normally expressed on the basolateral surface of thyroid follicular cells that mediates uptake of plasma iodide and other molecules with similar charge density (eg, pertechnetate). Uptake can be monitored noninvasively with planar gamma-camera, single-photon emission computed tomography (SPECT), or positron emission tomography (PET) imaging 7-10.
In this study, we used an attenuated vaccine strain of measles virus expressing the NIS gene (MV-NIS) as an imaging reporter. This replication-competent, lytic RNA virus induces a strong cytopathic effect as a result of massive syncytia formation 6, 11, 12. Although the use of NIS as an imaging reporter for gene and viral therapy has been reported extensively, most studies have focused on the amount of NIS-mediated radionuclide uptake within an entire tumor and compared that with control tumors lacking NIS. However, because of potential heterogeneity in the tumor microenvironment and in viral infection patterns, it is equally desirable to monitor the dynamic intratumoral viral infection pattern within a solid tumor. In this study, we aimed to determine whether NIS-mediated pinhole micro-SPECT/CT could accurately resolve intratumoral viral dispersion patterns in a human pancreatic xenograft model infected with MV-NIS. We also sought to quantify the infection percentage using this method. Our results suggest that in-vivo, noninvasive monitoring of MV-NIS by pinhole micro-SPECT/CT compares favorably with the more time-consuming and expensive analyses that require animal sacrifice.
RESULTS
Percentage of Infected Tumor Cells Required for Detection of NIS-Mediated 123I Tumor Uptake above Background with Pinhole Micro-SPECT/CT
For NIS to be a clinically beneficial reporter gene that guides oncolytic viral therapy, it is crucial to determine several factors: 1) the minimum percentage of NIS-expressing tumor cells required for the detection of radionuclide uptake (above background) in solid tumors, and 2) a practical threshold of micro-SPECT/CT activity that confirms whether an adequate number of tumor cells are initially infected to “seed” and promote the oncolytic cycle.
By using quantitative, real-time, reverse transcriptase, polymerase chain reaction (qRT-PCR), we determined the total number of NIS RNA copies per cell in control and maximally MV-NIS-infected BxPC-3 human pancreatic cancer cells in vitro. Control (uninfected) BxPC-3 cells contained 8.28 × 10³ ± 1.01 × 10³ NIS RNA copies per μg of total RNA. BxPC-3 cells infected under conditions that yielded maximal radioiodide uptake (multiplicity of infection, 0.1 at 48 h) contained 5.29 × 10⁷ ± 2.18 × 10⁷ NIS RNA copies/ μg (Figure 1A). The total yield of NIS RNA from control BxPC-3 cells was 19.33 pg/cell. From this number, we calculated that uninfected BxPC-3 cells expressed 0.16 copies of NIS RNA per cell and optimally MV-NIS-infected BxPC-3 cells expressed 1,023 copies of NIS RNA/cell.
Figure 1.
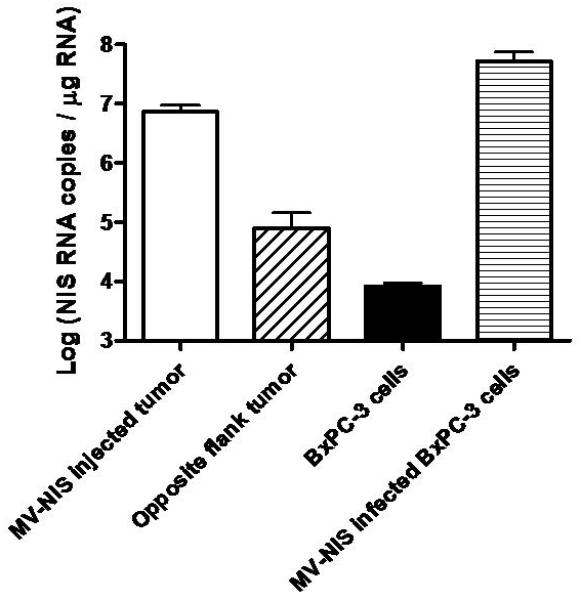
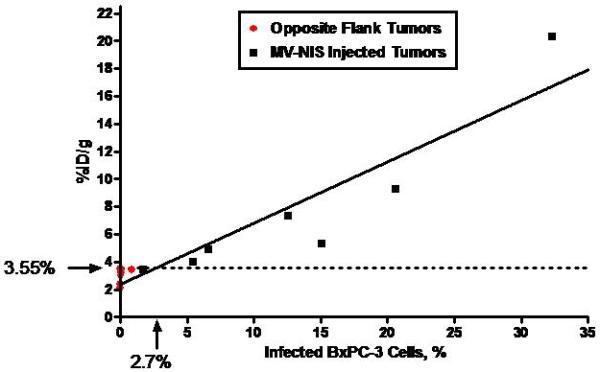
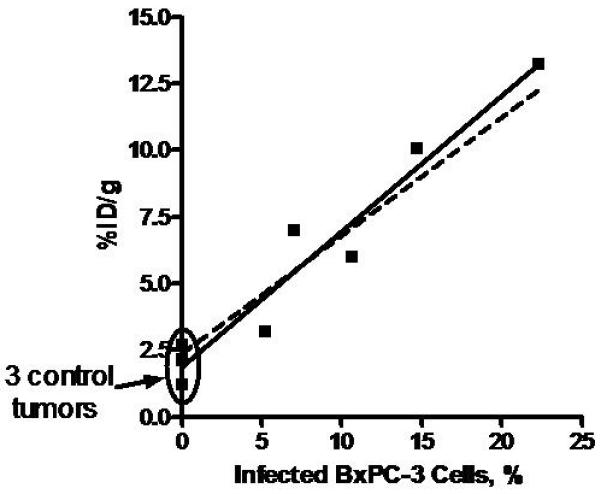
A, Human NIS RNA Levels after Infection with MV-NIS. Tumor homogenates were created from subcutaneous tumors in nude mice (7 MV-NIS–injected tumors and 7 noninjected tumors from the opposite flank). Cultured BxPC-3 cells were optimally infected with MV-NIS. RNA levels were measured by qRT-PCR. The level of NIS RNA/μg in opposite flank tumors and uninfected BxPC-3 cells in vitro was not significantly different. NIS RNA/μg in MV-NIS injected tumors was significantly different than the level in opposite flank tumors (p < 0.01 by t-test). B, Linear regression of 123I uptake (%ID/g) in infected and uninfected BxPC-3 subcutaneous dual flank tumors (n = 7 mice) versus percent infected BxPC-3 cells (as calculated by RNA yield). The dotted line shows the detection sensitivity threshold value (3.55 %ID/g, 1.5 times y-intercept of the regression line) (r2 of linear regression = 0.872, p < 0.001). This corresponded to 2.7% infected tumor cells. %ID/g denotes percent injected dose per gram; MV-NIS, measles virus expressing human NIS; NIS, sodium iodide symporter; qRT-PCR, quantitative, real-time, reverse transcriptase, polymerase chain reaction.
Next, we used micro-SPECT/CT to image 7 mice with control (opposite flank, no MV-NIS injection) and MV-NIS-injected flank xenografts. One hour after intraperitoneal injection of 123I, mice were imaged and then immediately euthanized. Tumors were excised and weighed; control and MV-NIS–injected tumors weighed 0.32 ± 0.06 g and 0.44 ± 0.07 g, respectively. Dose calibrator measurements of intratumoral 123I uptake showed a percent injected dose per gram (%ID/g) of 2.1 to 3.5 (mean+/− SE 3.0+/−0.2 %ID/g) for control tumors and 3.4 to 20.3 %ID/g (mean+/−SE 7.8+/−2.2 %ID/g) for MV-NIS-injected tumors. Control tumors contained 8.00×10⁴ ± 6.53×10⁴ copies of NIS RNA per μg of total RNA, and MV-NIS–injected tumors contained 7.24×10⁶ ± 2.13×10⁶ copies/μg (Figure 1A). The NIS RNA content of control, opposite flank tumors was not significantly different than control BxPC-3 cells.
The 123I tumor uptake data were plotted against the percent of infected BxPC-3 tumors cells (calculated based on RNA yield from maximally infected BxPC-3 cells) (Figure 1B). Linear regression analysis was performed to determine the relationship between intratumoral 123I level and % infection of BxPC-3 tumor cells. The y-intercept of the regression line was 2.67 %ID/g, which represented 0% infected cells. We chose a detection sensitivity threshold value that was 1.5-times the background tumor radionuclide localization level (ie, y-intercept multiplied by 1.5). Radionuclide uptake at or above this level (3.55 %ID/g) was indicative of NIS-mediated localization. The threshold value, which corresponded to at least 2.7% BxPC-3 cells infected with MV-NIS at the time of imaging, excluded all opposite flank tumors, as well as the lowest-activity MV-NIS–injected tumor.
Using the regression line, the percent of tumor cells infected with MV-NIS in this tumor model could be estimated accurately. The predicted maximal 123I uptake (corresponding to 100% infection rate of BxPC-3 cells) was 46.3 %ID/g. Although this estimate could not be confirmed directly because of the asynchronous nature of the low MV-NIS multiplicity of infection, it was similar to that obtained previously from stably transduced BxPC-3-NIS tumors (37.4 %ID/g) 13.
Comparison of Pinhole Micro-SPECT/CT with Gold Standard Immunohistochemistry for Quantitation of Intratumoral Viral Load
Because MV-NIS infects only human tumor cells and not mouse stromal cells, any volume-based method of infection quantitation requires an estimate of the tumor volume occupied by tumor cells (versus stroma). First, we manually determined the percentage of tumor occupied by BxPC-3 cancer cells and by stroma by using region-of-interest image analysis on hematoxylin-stained tumor sections. Figure 2 shows manually selected outlines of the boundaries of MV-NIS–infected syncytia. After examining 10 representative sections the mean ± SD of BxPC-3 cells per total area was 0.70 ± 0.05.
Figure 2.
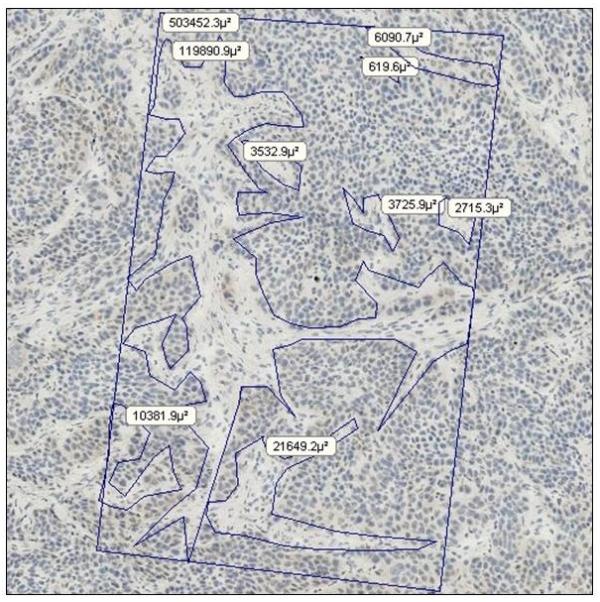
Determination of Tumor Cell and Stroma Percentages within a Human Pancreatic Cancer Xenograft. Hematoxylin-stained, frozen sections (original magnification, ×200) were analyzed to determine the percentage of tumor occupied by BxPC-3 cells in 5 MV-NIS-infected and 3 uninfected control tumors. The rectangle represents a known area, and regions of interest (ie, stroma [fibroblasts, collagen, etc]) were outlined manually for image analysis.
Next, we compared manually determined volumes with a quantitative technique that applied automated threshold pixel analysis (Figure 3). For consistency, the image threshold was set such that the nucleoli (stained only with hematoxylin) were just below the threshold. Immunohistochemical (IHC) staining of individual syncytium on frozen sections showed a patchy distribution of colorimetric precipitate. This nonuniform staining caused the image analysis software to underestimate the syncytial area. Fortunately, the underestimate was very consistent among syncytia; the true infected area could be approximated by applying a recovery coefficient to the software measurement. After evaluating 10 representative automated threshold images, we determined the mean ± SD recovery coefficient was 0.396 ± 0.09.
Figure 3.
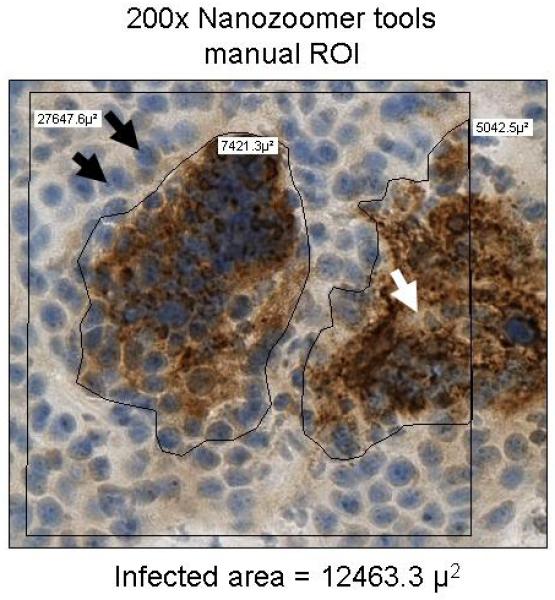
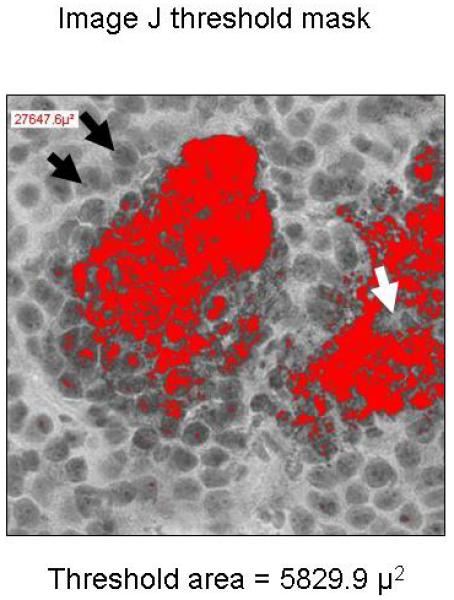
Comparison of Manual Region-of-Interest Analysis and Automated Threshold Pixel Analysis. Images of immunohistochemically stained sections of 5 MV-NIS–infected tumors were quantified manually with region-of-interest analysis (A) or automated threshold pixel analysis (B). The mean recovery coefficient of the automated analysis for 10 randomly selected images (mean 0.396 ± 0.09 × the manual ROI) was used to correct for nonuniformity of staining within MV-NIS–infected syncytia. Black arrows show nucleoli used to establish the image threshold; the white arrow denotes a region in the center of a syncytium that is weakly stained and below the designated threshold. MV-NIS denotes measles virus expressing sodium iodide symporter.
Automated threshold pixel analysis was then performed on 10 equally spaced, whole-tumor, IHC-stained sections (Figure 4A) to determine the percentage of infected BxPC-3 tumor cells. In this representative tumor, the total area of the 10 sections was 209.941 mm2. When corrected for stromal content (multiplying by 0.70), the area occupied by BxPC-3 cells was calculated to be 146.96 mm2. With automated threshold pixel analysis, the infected area was measured as 12.965 mm2; after correction with the recovery coefficient (dividing by 0.396), the area was 32.79 mm2. Therefore, the percentage of BxPC-3 cells infected with MV-NIS was 22.3%. The measured 123I uptake for the tumor was 13.1 %ID/g. Applying the linear regression equation calculated above (Figure 1B), 13.1 %ID/g corresponded to a predicted 24.2% infection of BxPC-3 cells. This technique was performed on 8 additional tumors (in total, 5 infected, 3 control tumors). Figure 4B shows the relationship between the infection rates predicted by IHC quantitation and measured by 123I uptake. The close agreement between the 2 methods (NIS RNA–based prediction and MV-NIS–based IHC quantitation with automated threshold pixel analysis) validates the quantitative NIS-mediated radionuclide accumulation method to predict the percentage of infected tumor cells.
Figure 4.
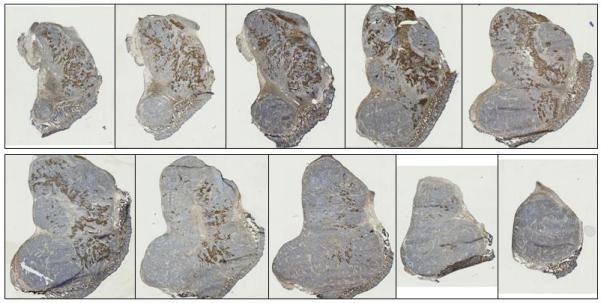
Quantitation of Percent Tumor Cell Infection and Correlation with NIS-Mediated Ex Vivo 123I Uptake. A, Representative tumor is divided into 10 equally spaced, immunohistochemically stained sections. B, 123I uptake for 5 BXPC-3 tumors infected with MV-NIS and 3 control tumors (no MV-NIS) was plotted against percentage of infected BxPC-3 cells (determined by automated threshold pixel analysis). The solid line is a linear fit to the data (r2 = 0.947; P<.0001); the dashed line is a simulation using values for percentage of infected cells determined by NIS RNA analysis. NIS denotes sodium iodide symporter; MV-NIS, measles virus expressing NIS.
Up to this point, all experiments used 123I as the imaging isotope. In all subsequent imaging experiments with pinhole collimation, we used pertechnetate 99m (99mTcO4). Advantages of 99mTcO4 include 1) higher-resolution images due to lower scattering; 2) no special aerosol precautions for handling animals, cages, or ex vivo 99mTc-containing tissues (in contrast, iodide can be oxidized to volatile iodine); and 3) 99mTcO4 is less than 10% of the cost of 123I. In addition, the combination of 99mTc04 with pinhole collimation minimizes partial volume losses, which greatly simplifies in vivo quantitation of small tumors by pinhole micro-SPECT volume of interest (VOI) analysis. A strong correlation (p<0.0001) was observed for both micro-CT and pinhole-micro-SPECT VOI analysis in comparison to ex vivo measurements in a group of mice bearing BxPC-3 tumors ranging in size from 0.1 to 0.6 ccm (Figure 5).
Figure 5.
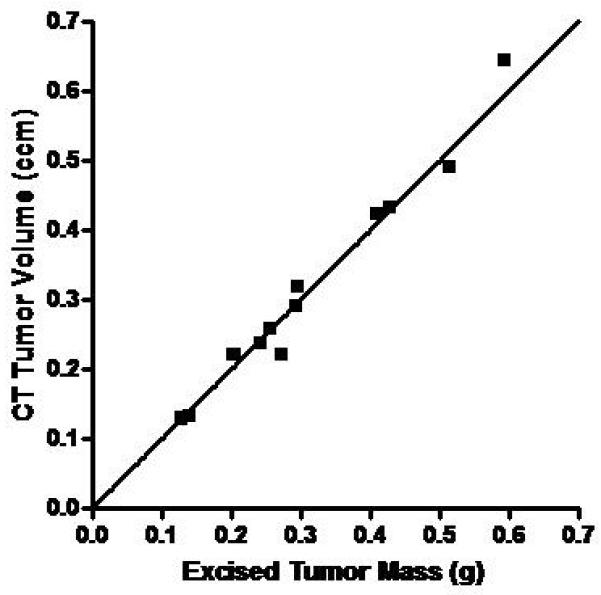
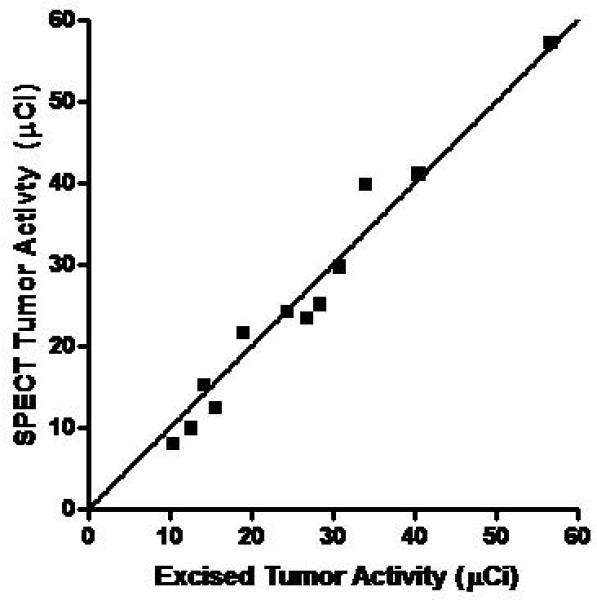
Correlation of In Vivo Micro-CT and Micro-SPECT Tumor Measurements with Ex Vivo Analysis. Mice with MV-NIS-injected BxPC-3 flank tumors (n=12) were imaged with 99mTcO4 pinhole micro-SPECT/CT. Immediately after imaging, mice were euthanized and tumors were excised, weighed, and counted in a dose calibrator. A, CT volume measured with region-of-interest software image analysis was highly correlated with ex vivo tumor mass (r2 = 0.977, p<0.0001). B, Micro-SPECT quantitation of tumor activity was highly correlated with ex vivo tumor activity (r2 = 0.966, p<0.0001).
Comparison of Immunohistochemistry and Autoradiography for Documenting Intratumoral MV-NIS Infection
Although the comparison between ex vivo radionuclide quantitation, IHC staining, or NIS RNA quantitation and micro-SPECT/CT analysis demonstrated the quantitative and predictive value of imaging, it was not clear whether the signal was coming from individual infected cells or multinucleated syncytia, nor was it clear whether all syncytia accumulated a similar concentration of imaging radionuclide. To address these questions, we compared IHC and autoradiography of the same tumor sections. Mice (n=11) with BxPC-3 flank tumors underwent intratumoral or intravenous injection with MV-NIS (3.5×10⁶ 50% tissue culture infective dose [TCID50]). Day 3 or day 14 after MV-NIS injection, mice were injected intraperitoneally with 99mTcO4 (37 MBq) and imaged 1 hour later with pinhole micro-SPECT/CT. Mice were euthanized immediately after imaging and tumors were removed for analysis. Figure 6 shows a high resolution image of a tumor section from the extreme of the group (14 days post IV injection of MV-NIS). These results, along with those of 10 other tumors (data not shown), demonstrated that 1) multinucleated syncytia retained adequate integrity to support 99mTcO4 transport across the multinucleated cell plasma membrane; 2) the majority of MV N-protein reactivity was associated with intact syncytia rather that lytic debris, even as late as 14 days after the initial infection; and 3) loss of NIS activity due to accumulation of random mutations in the viral NIS transgene did not appear to occur, at least not during this time frame of infection.
Figure 6.
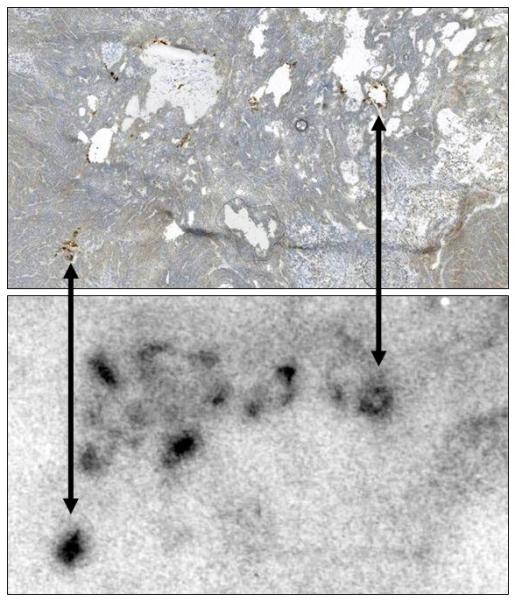
Comparison of Immunohistochemistry and Autoradiography for Identifying MV-NIS-Infected Regions of Tumors. Nine mice with MV-NIS-infected BxPC-3 flank tumors (6 intratumorally-injected and 3 intravenously-injected) and two control mice (no MV-NIS) were injected with 99mTc04 (37 MBq). Tumors were excised, frozen, sectioned, and mounted on slides. Images were taken from a representative tumor, removed 14 days after intravenous injection of MV-NIS. Upper panel, Autoradiographic image of a tumor section. Lower panel, The same section processed for immunohistochemical detection of the measles virus N protein. All MV-NIS–infected syncytia were positive by autoradiography. Arrows denote alignment of MV-NIS–infected regions. Note that areas of high cell density (lower right corner) correspond to low levels of background 99mTcO4 localization; areas of necrosis (holes) in the tumor have higher levels of background localization due to radionuclide pooling. MV-NIS denotes measles virus expressing sodium iodide symporter.
High-Resolution Pinhole Micro-SPECT/CT Imaging and Quantitation of Separate Intratumoral Foci of MV-NIS Infection
Ultimately, we aimed to track individual foci of viral infection and predict intratumoral viral load in vivo when virus is deposited in multiple sites within a tumor. From the ex vivo autoradiography analysis (Figure 6), it was clear that background localization of 99mTcO4 varied considerably among different regions of a tumor (low background in regions of densely packed proliferating cells, high background in regions with lower cell density). We assumed that this was attributable to heterogeneity in extracellular fluid content within the tumor. The analysis needed to account for this heterogeneity to avoid false-positives when attempting to separate foci of intratumoral radionuclide localization.
Because control tumors showed some background 99mTc localization, we first determined a practical lookup table (LUT) scale for image analysis that would exclude false-positives and intratumoral background radionuclide localization. A group of 2 control and 5 MV-NIS–infected BxPC-3 flank xenografts were evaluated using volume-of-interest image analysis. We applied a threshold that was 1.5-fold greater than the maximal background level when attempting to visually resolve distinct intratumoral foci of MV-NIS infection from uninfected regions. In the example shown in Figure 7A, the maximum pixel intensity value for background radioactivity was 37.0. The color LUT scale was adjusted such that all pixels below the threshold value of 56 (ie, 37×1.5) were colorless and those above the threshold were colored with the greatest intensity (red) of the LUT scale. In practice, an upper limit that was 10 to 15 LUT units above the threshold (in this example, 70) resulted in a smoother image because it provided some midrange colors for interpolation when the micro-SPECT image was scaled to the higher pixel density of the computer monitor.
Figure 7.
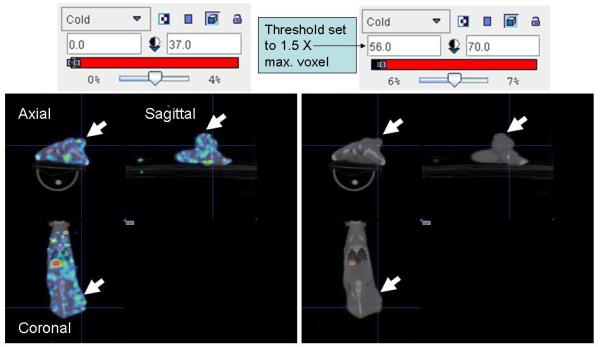
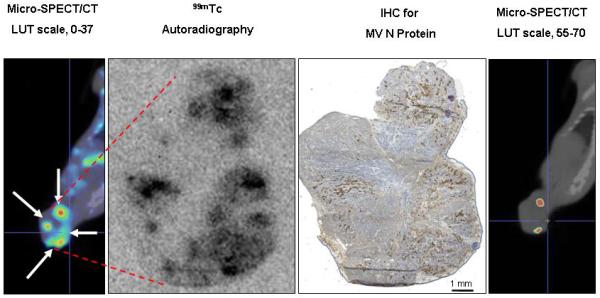
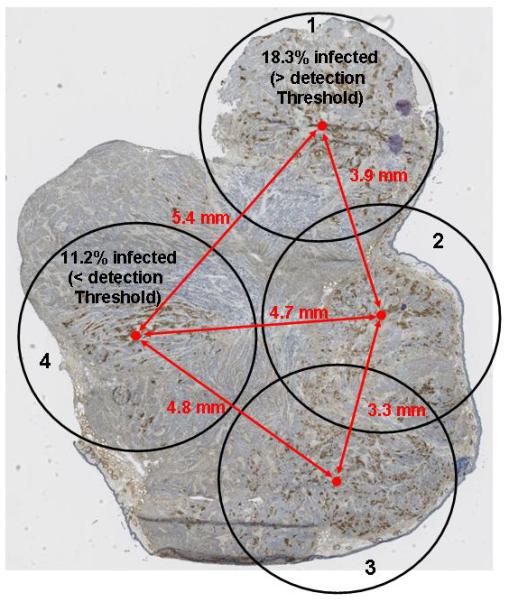
Sensitivity of Pinhole Micro-SPECT/CT for Detection of Separate Intratumoral Foci of MV-NIS Infection. A, Control BxPC-3 tumors (without MV-NIS infection) showed background 99mTcO4 localization (maximal pixel intensity, 37). A threshold 1.5-fold higher than the maximal background intensity (threshold value, 56) was applied to avoid false-positives. Note that the threshold-adjusted image on the right no longer shows background radioactivity. B, Example of a tumor from a mouse euthanized 4 days after MV-NIS injection. Far left panel, Coronal micro-SPECT/CT image. Arrows indicate sites of tumor injection. Middle left panel, Autoradiogram. Middle right panel, IHC stain of the same tumor section. Far right panel, Threshold-adjusted micro-SPECT/CT image. The in vivo micro-SPECT/CT and ex vivo autoradiography and IHC showed excellent spatial correlation. Note that 2 of the 4 injection points (seen as regions of high intensity on micro-SPECT/CT, far left panel) had radionuclide levels exceeding the 1.5-fold background threshold (far right panel). C, IHC tumor section shows the 4 injection zones (4.5-mm circles), which corresponded to 3 times the full-width, half-maximal spatial resolution of the imaging equipment. Quantitative IHC was used to calculate the percent of infected BxPC-3 cells in injection zones 1 and 4. The same experiment on a total of 7 injection sites from 5 tumors revealed a mean of 12.85%+/−1.7 % infected BxPC-3 cells per injection site. IHC denotes immunohistochemical stain; LUT, lookup table; SPECT/CT, single-photon emission computed tomography/computed tomography; MV, measles virus; MV-NIS, measles virus expressing sodium iodide symporter.
We applied this technique to additional MV-NIS–infected tumors. Figure 7B shows a xenograft that was excised 4 days after intratumoral MV-NIS injection. Care was taken during MV-NIS injections (one administered in each tumor quadrant) and during ex vivo mounting for cryosectioning to center all injection sites on the same tumor section. In addition, the 3-dimensional, reconstructed, micro-SPECT/CT images were rotated such that the coronal slice matched the orientation of the excised tumor. Figure 7B shows a coronal micro-SPECT/CT image, autoradiogram, and image after IHC stain from the same tumor section. Two of the 4 injection regions, corresponding to zones of MV-NIS infection, showed radionuclide uptake above the threshold for visual resolution and thus were considered to be NIS-mediated. Pinhole micro-SPECT/CT appeared to accurately detect separate foci of intratumoral infection within different sites of a tumor. However, if the LUT scale was set too high, some areas (depending on the volume of infection) could be below the resolution of the imaging equipment, and if the LUT scale was set too low, images could include false-positive localization.
To estimate the number of MV-NIS–infected BxPC-3 cells resulting from each of the 4 injections, we performed a more detailed analysis of the same tumor by using the quantitative IHC method. Figure 7C shows 4 circles (zones of infection) of 4.5 mm diameter, centered about the midpoint of infection for each injection site. This diameter was 3 times the reconstruction voxel width of our pinhole micro-SPECT/CT and thus captured nearly all counts emanating from the infection zone. Site 4, which was below our empirical threshold of detection, contained 11.2% infected cells; in contrast, site 1 was clearly above the threshold and contained 18.3% infected BxPC-3 cells. The same experiment on a total of 7 injection sites from 5 tumors revealed a mean of 12.85%+/−1.7 % infected BxPC-3 cells per injection site. The site with the lowest infection (6.9% infected cells) was below the threshold for detection, while one site with 8.3% infected cells was above the imaging threshold. All sites >12.5% were clearly above the imaging threshold. Thus, a practical threshold required for the detection of distinct intratumoral infection foci is approximately 4x the % infected BxPC-3 cells required for whole tumor analysis (which yielded a sensitivity of 2.7% infected cells).
The centers of injection sites 2 and 3 in Figure 7C were 3.3 mm apart and appeared as a single zone of infection on pinhole micro-SPECT/CT, centered at the midpoint of the 2 injections. All other zones of infection, with centers separated by more than 3.9 mm, were spatially resolved on the pinhole micro-SPECT/CT images. These analyses emphasize the importance of considering both the mean background signal of a tissue and the variability in background signal within a tissue when attempting to resolve zones of moderate infection.
DISCUSSION
Our results demonstrate the ability of high-resolution pinhole micro-SPECT/CT to 1) accurately resolve separate intratumoral foci of viral infection and 2) reliably predict the actual percentage of infected tumor cells in MV-NIS-infected human pancreatic cancer xenografts. In vivo imaging results corresponded remarkably well with those of conventional criterion standard, tumor analysis techniques, including high-resolution autoradiography (documentation of intratumoral NIS expression and radionuclide uptake), IHC staining (for MV N protein), and qRT-PCR (analysis of NIS RNA). In this way, NIS may serve as a true imaging reporter that can guide therapeutic intervention. For example, it may facilitate “personalization” of virotherapy by pinpointing untreated tumor areas that may need re-injection to improve coverage. Likewise, areas of NIS activity can be targeted for fine-needle aspiration and biopsy to confirm viral infection with conventional virologic or histologic techniques. In addition, this quantitative information can be used in future (preclinical) experimental models to compare the effects of different injection and infusion techniques and alterations of the tumor microenvironment. Altogether, this technology will allow identification of better methods to overcome barriers to viral delivery and spread
We choose to work with NIS because it can be imaged with various approved, readily available methods (eg, 99mTc04 or 123I SPECT or 124I-PET). An additional benefit of NIS for imaging is that it has minimal background activity in clinically important sites of malignant disease such as the lungs, liver, and spleen. A recent breakthrough in NIS research is the development of a novel PET probe 18F-tetrafluoroborate 14, 15. Although not yet widely used, this may replace the less sensitive and lower resolution 124I for PET imaging of NIS. 124I PET has been used for both qualitative and quantitative imaging NIS activity in mouse studies 16-19. However, the tissue penetration prior to annihilation of the high energy positrons from 124I decay (maximum positron range of >6 mm) severely limits the spatial resolution in a small animal setting 20.
By using a value 1.5 times the control tumor activity as the lowest threshold of sensitivity, our studies showed that at least 2.7% of the tumor cells must be infected with MV-NIS to reliably detect NIS-mediated radioisotope uptake levels (above background) in the BxPC-3 xenograft model. Although this quantitation technique can be readily applied to other NIS-expressing virus–tumor models, it is important to note that values may vary among tumor types because of differing amounts of tumor stroma, differences in NIS activity in different cell types, and inherent susceptibility of cells to viral infection. For new in vivo virus-tumor models, we suggest roughly approximating the sensitivity of the reporter by first imaging NIS in stably transduced tumors from the cell line of interest, then normalizing to the relationship of in vitro radionuclide uptake between NIS-expressing tumor cells that were infected by virus and NIS-expressing tumor cells that were stably transduced with NIS.
A study limitation was the availability of only a single-pinhole collimator on the micro-SPECT/CT system used, which decreased sensitivity and resolution. We attempted to minimize this limitation by keeping the flank tumors as close to the center of rotation as possible, and we used relatively large doses of 99mTcO4 (37 MBq) for imaging. Also, because all tumor locations were known, we minimized the radius of rotation to maximize resolution of the tumor at the expense of field of view. For tumors of unknown location, for which it would be necessary to image the entire animal, a multipinhole collimation system and an imaging system capable of generating multiple adjacent or overlapping projections are preferred 21-23.
In conclusion, molecular imaging using a NIS reporter and a pinhole micro-SPECT/CT imaging system yielded precise localization and quantitation of MV-NIS infection in human pancreatic xenografts in mice. This method replaces the much more time-consuming and expensive methods such as autoradiography and IHC, which require animal sacrifice.
MATERIALS AND METHODS
Cell Culture
BxPC-3 human pancreatic cancer cells and 293T cells were purchased from American Type Culture Collection (Manassas, VA). BxPC-3 cells were maintained in RPMI1640 supplemented with 10% fetal bovine serum (FBS) and 1× penicillin/streptomycin (P/S) cocktail. 293T cells were maintained in Dulbecco’s modified Eagle’s medium (DMEM) supplemented with 10% FBS and P/S. Cell culture reagents were obtained from Mediatech (Manassas, VA), except for FBS, which was from Invitrogen (Carlsbad, CA).
MV-NIS
A recombinant MV expressing the human NIS gene was engineered in our laboratory previously 24. The MV-NIS preparation used in all experiments was produced by the Mayo Viral Vector Core 25 and contains 3.5×10⁷ TCID50/mL.
Animal Experiments
Experiments were approved by the Mayo Clinic Animal Care and Use Committee and performed in accordance with their guidelines. Five- to 7-week-old female nude mice (Harlan Sprague-Dawley, Madison, WI) were used in all experiments. All mice were implanted with radiofrequency identification microchips (AVID, Folsom, LA). Mice were assigned randomly to treatment and control groups by numeric sorting. Mice were housed in a pathogen-free barrier facility with access to food and water ad libitum. Mice were maintained on a PicoLab 5053 mouse diet (LabDiet, Richmond, IN), which contained 0.97 ppm total iodine.
Tumor Xenografts
To establish tumor xenografts, mice were inoculated subcutaneously in the flank with 3×10⁶ BxPC-3 cells in 100 μL of phosphate-buffered saline (PBS). When tumors reached approximately 5 mm in diameter, MV-NIS (3.5×10⁶ TCID50/100 μL) was administered intravenously in the tail vein or by direct intratumoral injection using a sterile 28-gauge needle. Mice were observed daily and were euthanized immediately if they met any of the following criteria: more than 15% loss of body weight, inability to access food and water, tumor ulceration, or tumor burden exceeding 2 cm3. Otherwise, mice were euthanized after imaging, following the procedure recommended by the American Veterinary Medicine Association (CO2 gas inhalation).
Small-Animal Imaging
A high-resolution micro-SPECT/CT system (X-SPECT, Gamma Medica Ideas, Inc., Northridge, CA) was used for fusion micro-SPECT/CT imaging. A detailed description of the instrument has been published previously 26. This system offers functional and anatomic imaging of small animals, with a micro-SPECT resolution of 3- to 4-mm (using a low-energy, high-resolution, parallel-hole collimator with a 12.5-cm field of view), 1-mm pinhole collimator resolution approaching 1 mm, and a micro-CT resolution of approximately 155 μm. Radionuclide (123I, 18.5 MBq [0.5 mCi]; or 99mTcO4, 37 MBq [1 mCi]) was administered by intraperitoneal injection 1 hour before imaging.
During imaging, animals were maintained under general anesthesia with gaseous isoflurane in O2 supplied from a veterinary vaporizer (Summit Medical, Bend, OR) and delivered through mouse-specific nose cones. For pinhole micro-SPECT imaging, we used a 5-cm radius of rotation and obtained 64 projections at 15 seconds per projection. Micro-CT image acquisition (155-μm slice thickness, 256 images) was performed in 1 minute at 0.25 mA and 80 kVp.
Image Analysis and Quantitation
Whole-body activity (injected dose of radionuclide) in each mouse was determined by measuring activity in the syringe in a National Institute of Standards and Technology–calibrated dose calibrator before and after injection. Values were corrected for decay between the time of injection and time of analysis. Subcutaneous tumor activity and the intratumoral distribution of activity were determined by volume-of-interest analysis using PMOD Biomedical Image Quantification and Kinetic Modeling Software (PMOD Technologies, Zurich, Switzerland).
RNA Isolation from Tumor Xenografts
Mice were euthanized after imaging, and tumors were promptly excised and stored at −80°C. Frozen tumors were disrupted with a Mixer Mill 301 (Retsch, Newtown, PA) using a 25-mL, liquid N2–cooled, Teflon grinding vessel containing a 15-mm zirconium oxide sphere. The oscillating frequency was 30 Hz, and the duration of disruption was 1.5 minutes. Disrupted tumor tissue was lysed in RPT buffer (Qiagen, Valencia, CA) (600 μL/25 mg tissue) and homogenized by passage through a QiaShredder (Qiagen). Total RNA was isolated using an RNeasy mini kit (Qiagen) and was dissolved in nuclease-free H20. RNA was quantified with a NanoDrop 1000 (Thermo Scientific, Waltham, MA). For experiments with cultured BxPC-3 cells, cells were lysed directly in RPT buffer and processed in the same manner as described for total RNA isolation from tumors.
qRT-PCR of NIS in MV-NIS Infected Cells and Xenografts
A fragment of NIS RNA was amplified using the TaqMan One-Step RT-PCR Kit (Applied Biosystems, Foster City, CA) according to manufacturer’s instructions 27. The final reaction (volume, 25 μL) contained 50 nM forward primer (5′-CTCCTCCCTGCTAACGACTCC-3′), 250 nM dual-labeled probe (5′-/56-FAM/CGCCAGCCGACCCGCCTTA /3BHQ-1/-3′), 50 nM reverse primer (5′-CCCAGGGCACCGTAATAGAG -3′), 1× TaqMan master mix, nuclease-free H2O, 1× Multiscribe/RNAse inhibitor, and 0.2 to 0.5 μg of template RNA. One cycle of reverse transcription (30 minutes at 48°C) was applied, followed by a denaturation step (10 minutes at 95°C) and 40 cycles of amplification (15 seconds at 95°C and 1 minute at 60°C), with fluorescence measured during the anneal/extension step, on a MX4000 Multiplex Quantitative PCR System (Stratagene, La Jolla, CA). Quantitative NIS RNA standards were prepared by in vitro transcription and were run as a 10-fold dilution series from 107 to 101 copies per reaction in each experiment. The number of copies of NIS RNA in BxPC-3 cells and xenografts was determined by comparison to a linear regression of the NIS RNA standards.
Autoradiography
Mice were immediately euthanized after imaging and tumors were excised, weighed, and 99mTcO4 activity was counted in a dose calibrator. Tumors were placed in a Tissue-Tek cryo-mold and embedded in OCT media in the same orientation as they appeared in coronal micro-SPECT/CT images reconstructed using PMOD Biomedical Imaging Software. Tumors were then frozen in a beaker of 2-methylbutane surrounded by dry ice and sectioned with a Leica cryostat (12 μm). Ten equally spaced sections were obtained from each tumor. The sections were adhered to pretreated microscope slides and air dried at −20°C. Dried slides were taped to a film cassette, exposed to X-Omat radiographic film for 15 to 30 hours, and developed with an automated film processor. The films were scanned on a flatbed scanner and quantified with Image-J (version 1.43) image processing and analysis software (National Institute of Mental Health, Bethesda, Maryland).
Immunohistochemistry for MV N Protein
After autoradiography, slides were fixed in ice-cold methanol for 10 minutes and air dried. All immunohistochemistry steps were performed at room temperature. Tissue sections were permeabilized with 0.01% Triton X-100 in PBS for 10 minutes. Slides were rinsed once in PBS. Endogenous tissue peroxidase activity was quenched with 0.3% (volume/volume) H2O2 in PBS for 10 minutes. Slides were blocked with 5% fetal bovine serum in PBS for 20 minutes and washed once in PBS. Slides were incubated with a 1:500 dilution of a biotinylated mouse anti–MV N protein monoclonal antibody (MAB8906B; Chemicon, Billerica, MA) in PBS for 1 hour, followed by 3 washes (5 minutes each) in PBS. The slides were then incubated with 300 μL of avidin-DH and biotin–horseradish peroxidase solutions using a Vectastain Elite ABC kit (Vector Laboratories; Burlingame, CA) for 30 minutes, followed by 3 washes (5 minutes each) in PBS. Slides were incubated with 3,3′-diaminobenzidine and peroxide for 5 minutes using a DAB kit (Vector Laboratories). The reaction was stopped by rinsing with H2O, and slides were counterstained for 1 minute with Accustain hematoxylin, Gill No.1 (Sigma, St. Louis, MO). Slides were air dried, a drop of Vectamount AQ mounting medium (Vector Laboratories) was placed on the tissue, and a cover slip was applied. For visualization and quantitation, slides were scanned with a Nanozoomer Digital Pathology System (Bacus Laboratories; Center Valley, PA) using a 20× objective. Quantitation was initially validated manually using the region-of-interest area tool from WebSlide Enterprise software (Bacus Laboratories) and subsequently performed on threshold-adjusted screen captures using Image J software.
Statistical Analysis
Linear regression and correlation analyses were performed using Prism version 4 (GraphPad, La Jolla, CA).
ACKNOWLEDGMENT
We thank our nuclear medicine technologist, Teresa D. Decklever (Mayo Clinic), for technical expertise and imaging assistance. This work was supported by the National Cancer Institute (grant K08 CA103859, grant P50 CA102701, and grant R01 CA125614-05).
Footnotes
Conflict of Interest The authors declare no conflict of interest.
REFERENCES
- 1.Barton KN, Tyson D, Stricker H, Lew YS, Heisey G, Koul S, et al. GENIS: gene expression of sodium iodide symporter for noninvasive imaging of gene therapy vectors and quantification of gene expression in vivo. Mol Ther. 2003;8(3):508–18. doi: 10.1016/s1525-0016(03)00153-9. [DOI] [PubMed] [Google Scholar]
- 2.Barton KN, Stricker H, Brown SL, Elshaikh M, Aref I, Lu M, et al. Phase I study of noninvasive imaging of adenovirus-mediated gene expression in the human prostate. Mol Ther. 2008;16(10):1761–9. doi: 10.1038/mt.2008.172. [DOI] [PMC free article] [PubMed] [Google Scholar]
- 3.Boland A, Ricard M, Opolon P, Bidart JM, Yeh P, Filetti S, et al. Adenovirus-mediated transfer of the thyroid sodium/iodide symporter gene into tumors for a targeted radiotherapy. Cancer Res. 2000;60(13):3484–92. [PubMed] [Google Scholar]
- 4.Spitzweg C, O’Connor MK, Bergert ER, Tindall DJ, Young CY, Morris JC. Treatment of prostate cancer by radioiodine therapy after tissue-specific expression of the sodium iodide symporter. Cancer Res. 2000;60(22):6526–30. [PubMed] [Google Scholar]
- 5.Goel A, Carlson SK, Classic KL, Greiner S, Naik S, Power AT, et al. Radioiodide imaging and radiovirotherapy of multiple myeloma using VSV(Delta51)-NIS, an attenuated vesicular stomatitis virus encoding the sodium iodide symporter gene. Blood. 2007;110(7):2342–50. doi: 10.1182/blood-2007-01-065573. [DOI] [PMC free article] [PubMed] [Google Scholar]
- 6.Dingli D, Peng KW, Harvey ME, Greipp PR, O’Connor MK, Cattaneo R, et al. Image-guided radiovirotherapy for multiple myeloma using a recombinant measles virus expressing the thyroidal sodium iodide symporter. Blood. 2004;103(5):1641–6. doi: 10.1182/blood-2003-07-2233. [DOI] [PubMed] [Google Scholar]
- 7.Dai G, Levy O, Carrasco N. Cloning and characterization of the thyroid iodide transporter. Nature. 1996;379(6564):458–60. doi: 10.1038/379458a0. [DOI] [PubMed] [Google Scholar]
- 8.Eskandari S, Loo DD, Dai G, Levy O, Wright EM, Carrasco N. Thyroid Na+/I− symporter. Mechanism, stoichiometry, and specificity. J Biol Chem. 1997;272(43):27230–8. doi: 10.1074/jbc.272.43.27230. [DOI] [PubMed] [Google Scholar]
- 9.Van Sande J. Anion Selectivity by the Sodium Iodide Symporter. Endocrinology. 2003;144(1):247–252. doi: 10.1210/en.2002-220744. [DOI] [PubMed] [Google Scholar]
- 10.Zuckier LS, Dohan O, Li Y, Chang CJ, Carrasco N, Dadachova E. Kinetics of perrhenate uptake and comparative biodistribution of perrhenate, pertechnetate, and iodide by NaI symporter-expressing tissues in vivo. J Nucl Med. 2004;45(3):500–7. [PubMed] [Google Scholar]
- 11.Radecke F, Spielhofer P, Schneider H, Kaelin K, Huber M, Dotsch C, et al. Rescue of measles viruses from cloned DNA. Embo J. 1995;14(23):5773–84. doi: 10.1002/j.1460-2075.1995.tb00266.x. [DOI] [PMC free article] [PubMed] [Google Scholar]
- 12.Combredet C, Labrousse V, Mollet L, Lorin C, Delebecque F, Hurtrel B, et al. A molecularly cloned Schwarz strain of measles virus vaccine induces strong immune responses in macaques and transgenic mice. J Virol. 2003;77(21):11546–54. doi: 10.1128/JVI.77.21.11546-11554.2003. [DOI] [PMC free article] [PubMed] [Google Scholar]
- 13.Penheiter AR, Wegman TR, Classic KL, Dingli D, Bender CE, Russell SJ, et al. Sodium iodide symporter (NIS)-mediated radiovirotherapy for pancreatic cancer. AJR Am J Roentgenol. 2010;195(2):341–9. doi: 10.2214/AJR.09.3672. [DOI] [PMC free article] [PubMed] [Google Scholar]
- 14.Jauregui-Osoro M, Sunassee K, Weeks AJ, Berry DJ, Paul RL, Cleij M, et al. Synthesis and biological evaluation of [(18)F]tetrafluoroborate: a PET imaging agent for thyroid disease and reporter gene imaging of the sodium/iodide symporter. Eur J Nucl Med Mol Imaging. 2010;37(11):2108–16. doi: 10.1007/s00259-010-1523-0. [DOI] [PMC free article] [PubMed] [Google Scholar]
- 15.Weeks AJ, Jauregui-Osoro M, Cleij M, Blower JE, Ballinger JR, Blower PJ. Evaluation of [18F]-tetrafluoroborate as a potential PET imaging agent for the human sodium/iodide symporter in a new colon carcinoma cell line, HCT116, expressing hNIS. Nucl Med Commun. 2011;32(2):98–105. doi: 10.1097/MNM.0b013e3283419540. [DOI] [PMC free article] [PubMed] [Google Scholar]
- 16.Groot-Wassink T, Aboagye EO, Wang Y, Lemoine NR, Reader AJ, Vassaux G. Quantitative imaging of Na/I symporter transgene expression using positron emission tomography in the living animal. Mol Ther. 2004;9(3):436–42. doi: 10.1016/j.ymthe.2003.12.001. [DOI] [PubMed] [Google Scholar]
- 17.Niu G, Krager KJ, Graham MM, Hichwa RD, Domann FE. Noninvasive radiological imaging of pulmonary gene transfer and expression using the human sodium iodide symporter. Eur J Nucl Med Mol Imaging. 2005;32(5):534–40. doi: 10.1007/s00259-004-1715-6. [DOI] [PubMed] [Google Scholar]
- 18.Dingli D, Kemp BJ, O’Connor MK, Morris JC, Russell SJ, Lowe VJ. Combined I-124 positron emission tomography/computed tomography imaging of NIS gene expression in animal models of stably transfected and intravenously transfected tumor. Mol Imaging Biol. 2006;8(1):16–23. doi: 10.1007/s11307-005-0025-0. [DOI] [PubMed] [Google Scholar]
- 19.Haddad D, Chen NG, Zhang Q, Chen CH, Yu YA, Gonzalez L, et al. Insertion of the human sodium iodide symporter to facilitate deep tissue imaging does not alter oncolytic or replication capability of a novel vaccinia virus. J Transl Med. 2011;9:36. doi: 10.1186/1479-5876-9-36. [DOI] [PMC free article] [PubMed] [Google Scholar]
- 20.Biersack HJ, Freeman LM. Clinical nuclear medicine. Springer; Berlin ; New York: 2007. [Google Scholar]
- 21.van der Have F, Vastenhouw B, Ramakers RM, Branderhorst W, Krah JO, Ji C, et al. U-SPECT-II: An Ultra-High-Resolution Device for Molecular Small-Animal Imaging. J Nucl Med. 2009;50(4):599–605. doi: 10.2967/jnumed.108.056606. [DOI] [PubMed] [Google Scholar]
- 22.Wu C, van der Have F, Vastenhouw B, Dierckx RA, Paans AM, Beekman FJ. Absolute quantitative total-body small-animal SPECT with focusing pinholes. Eur J Nucl Med Mol Imaging. 2010;37(11):2127–35. doi: 10.1007/s00259-010-1519-9. [DOI] [PMC free article] [PubMed] [Google Scholar]
- 23.Sharma S, Ebadi M. SPECT neuroimaging in translational research of CNS disorders. Neurochem Int. 2008;52(3):352–62. doi: 10.1016/j.neuint.2007.08.011. [DOI] [PubMed] [Google Scholar]
- 24.Dingli D, Bergert ER, Bajzer Z, O’Connor MK, Russell SJ, Morris JC. Dynamic iodide trapping by tumor cells expressing the thyroidal sodium iodide symporter. Biochem Biophys Res Commun. 2004;325(1):157–66. doi: 10.1016/j.bbrc.2004.09.219. [DOI] [PubMed] [Google Scholar]
- 25.Hasegawa K, Pham L, O’Connor MK, Federspiel MJ, Russell SJ, Peng KW. Dual therapy of ovarian cancer using measles viruses expressing carcinoembryonic antigen and sodium iodide symporter. Clin Cancer Res. 2006;12(6):1868–75. doi: 10.1158/1078-0432.CCR-05-1803. [DOI] [PubMed] [Google Scholar]
- 26.Carlson SK, Classic KL, Hadac EM, Bender CE, Kemp BJ, Lowe VJ, et al. In vivo quantitation of intratumoral radioisotope uptake using micro-single photon emission computed tomography/computed tomography. Mol Imaging Biol. 2006;8(6):324–32. doi: 10.1007/s11307-006-0058-z. [DOI] [PubMed] [Google Scholar]
- 27.Myers RM, Greiner SM, Harvey ME, Griesmann G, Kuffel MJ, Buhrow SA, et al. Preclinical pharmacology and toxicology of intravenous MV-NIS, an oncolytic measles virus administered with or without cyclophosphamide. Clin Pharmacol Ther. 2007;82(6):700–10. doi: 10.1038/sj.clpt.6100409. [DOI] [PMC free article] [PubMed] [Google Scholar]