Abstract
Venous oxygen saturation (Yv) in cerebral veins and the cerebral metabolic rate of oxygen (CMRO2) are important indicators for brain function and disease. Although MRI has been used for global measurements of these parameters, currently there is no established technique to quantify regional Yv and CMRO2 using noninvasive imaging. This paper proposes a technique to quantify CMRO2 from independent MRI estimates of Yv and cerebral blood flow (CBF). The approach uses standard gradient-echo (GRE) and arterial spin labeling (ASL) acquisitions to make these measurements. Using MR susceptometry on gradient-echo phase images, Yv was quantified for candidate vein segments in gray matter that approximate a long cylinder parallel to the main magnetic field. Local CBF for the identified vessel was determined from a corresponding region in the ASL perfusion map. Fick’s principle of arteriovenous difference was then used to quantify CMRO2 locally around each vessel. Application of this method in young, healthy subjects provided gray matter averages of 59.6 ± 2.3% for Yv, 51.7 ± 6.4 ml/100g/min for CBF, and 158 ± 18 μmol/100g/min for CMRO2 (mean ± SD, n=12), which is consistent with values previously reported by PET and MRI.
Keywords: Cerebral metabolic rate of oxygen, cerebral venous oxygen saturation, cerebral blood flow, MR susceptometry
INTRODUCTION
Venous oxygen saturation (Yv) and the cerebral metabolic rate of oxygen (CMRO2) are important indicators of tissue viability in the brain. The brain consumes 20% of total body energy through aerobic metabolism under normal conditions (1,2), and absolute measurements of CMRO2 and Yv are linked to underlying cerebral physiology (3,4). Regional estimates of these parameters would provide new information about normal cerebral physiology during functional activity (5,6) and aging as well as modulation in disease states of the brain, including stroke, tumor, and Alzheimer’s disease (7–9).
Currently, there is no established method to quantify regional Yv and CMRO2 with MRI in vivo. Literature values for Yv and CMRO2 have been reported by positron emission tomography (PET) studies, most commonly with 15O-labeled radiotracers(10–14). Although PET imaging can detect regional differences in these parameters during normal brain activity and in disease (7–9), it is a low spatial-resolution technique compared to MRI. In addition, PET has not been routinely used in the clinic because it involves injection of a radioactive label, which requires equipment that is not widely available. MRI-based methods have been proposed to measure relative changes in oxygen metabolism, including the combination of fMRI BOLD and cerebral blood flow (CBF) measurements for estimates of CMRO2 changes in the brain during functional activation (15). These calibrated fMRI techniques, however, do not offer absolute quantification of the parameters of interest and depend on a functional task or physiological challenge such as hypercapnia to detect changes from a physiological baseline (15).
Alternate approaches for quantitative measurements of Yv and CMRO2 have been proposed using MRI (16,17). These methods estimate oxygen saturation in large draining veins in the brain, such as the sagittal sinus, which represents aggregate vascular output from the whole brain. Among the proposed techniques, T2-relaxation-under-spin-tagging (TRUST), obtains an absolute measure of Yv from a blood T2 measurement within the vessel through an in vitro calibration curve (16). Separately, Jain et al. determined Yv from susceptibility differences between the sagittal sinus and the surrounding tissue (17) as estimated from MRI phase images. This susceptibility shift reflects the innate paramagnetic effect of deoxyhemoglobin in veins, which depends on the blood oxygenation level. Both techniques rely on phase-contrast MRI to measure blood flow velocity in the vein of interest, from which cerebral blood flow (CBF) is determined with an additional estimate of cerebral blood volume. Fick’s principle of arteriovenous difference is then used calculate an absolute whole brain estimate of CMRO2 in the draining vessel from Yv and CBF (18,19). In contrast, estimates of regional oxygen metabolism with MRI require a robust method for local measurements of oxygen saturation. A recently proposed MRI approach, QUantitative Imaging of eXtraction of Oxygen and TIssue Consumption (QUIXOTIC), is a T2-based technique to quantitatively map cerebral Yv (20). QUIXOTIC targets signal from post-capillary venous blood in the brain using velocity-selective arterial spin labeling, and can potentially generate maps of CMRO2 in the brain.
Here we develop a separate technique by extending susceptibility-based measurements of oxygenation to quantify regional CMRO2 in the brain. Using gradient-echo phase maps, local Yv was determined in segments of gray matter veins that fit our assumptions about vessel geometry and orientation. Such vessel segments had length much longer than diameter and were approximately parallel to the main magnetic field. In addition, CBF was measured using arterial spin labeling (ASL), which uses a noninvasive tagging scheme to magnetically label arterial blood flowing into an imaging slice. ASL provides spatial information about CBF in a quantitative perfusion map, from which local CBF was determined around candidate vessels. CMRO2 was then quantified on a regional basis from these local measures of CBF and Yv using the Fick principle. This technique is termed phase-based regional oxygen metabolism (PROM). Results are presented for gray matter Yv and CMRO2 using this method in human subjects at 3 Tesla.
METHODS
Theory for Yv measurements
The proposed technique uses MR susceptometry to quantify the susceptibility difference between candidate cerebral veins and the surrounding brain parenchyma from axial phase images. Haacke et al. and Fernandez-Seara et al. applied MR susceptometry to estimate Yv in cerebral pial veins and the internal jugular vein, respectively (21,22). This measurement is based on the field difference between the vein and tissue, ΔBvein-tissue, which manifests in the phase image as Δϕ = γ·ΔB·TE, where γ is the gyromagnetic ratio and TE is the echo time. We restricted our analysis to through-plane vessels parallel to the main magnetic field (B0), with a diameter much smaller than the length of the vessel segment (Fig. 1). For the purpose of estimating the local susceptibility difference between vein and tissue, such vessel segments can be approximated as an infinite cylinder, and the susceptibility shift Δχvein-tissue is determined as (21–23):
| [1] |
where θ is the angle between the vein and the main magnetic field, i.e. θ=0 when the vessel is parallel to B0. Yv can be quantified from this susceptibility difference as (21):
| [2] |
where Δχdo = 0.18 ppm (cgs) is the susceptibility difference per unit hematocrit between fully deoxygenated and fully oxygenated blood (23), and the tissue was assumed to have the same susceptibility as fully oxygenated blood. Literature values were assumed for hematocrit, Hct = 0.42 for males and Hct = 0.38 for females (24).
Figure 1.
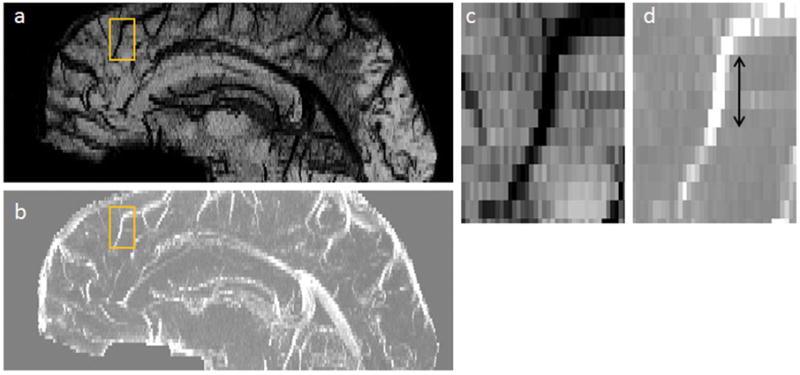
Orientation and geometry of candidate cerebral vein in gradient echo images. (a) Sagittal view of minimum intensity projection of the magnitude image. (b) Sagittal view of maximum intensity projection of the phase image. The rectangle highlights a vessel of interest for which (c) magnitude; and (d) phase are depicted. The arrow indicates the region for which the vein is approximately a narrow cylinder parallel to B0.
Theory for CMRO2 measurements
The Fick principle relates cerebral blood flow, the arteriovenous oxygenation gradient, and oxygen consumption as (18,19):
| [3] |
where Ya is arterial oxygen saturation, CBF is perfusion of blood in brain tissue in ml/100g/min, and Ca is the carrying capacity of oxygen molecules per volume of blood in μmol O2/100ml. Assuming a normal mean corpuscular hemoglobin concentration (MCHC) in red blood cells of 34g/dl (25), the concentration of hemoglobin in blood can be calculated from the assumed hematocrit as [Hb] = MCHC · Hct. For a typical carrying capacity of 55.6μmol O2 per gram of hemoglobin (24), Ca was determined to be 793 μmol O2/100ml blood for males and 718 μmol O2/100ml blood for females. We also assumed that arterial blood is fully saturated under normal conditions, i.e. Ya = 100%.
Here, we obtained local estimates of CMRO2 by combining Yv measurements from MR susceptometry in candidate gray matter veins with local CBF measurements from ASL in the region around the vessel. ASL provides information about the spatial distribution of perfusion, and we used a PICORE-Q2TIPS acquisition that has been demonstrated to mitigate errors from transit delays in tagged arterial spins and signal contamination from venous blood (26).
Experiments
Experiments were performed on a 3 Tesla Tim-Trio magnet with a 32-channel receive head coil. A total of 12 healthy volunteers (6 female, 6 male, age 26±5 years) participated with approval of the Institutional Review Board for our institution and informed consent from each subject.
For each subject, 2D, flow-compensated FLASH images were acquired at three echo times (TE) of 10, 15, and 20ms. Both magnitude and phase were collected for 10 axial slices, resolution = 0.5 × 0.5 × 2.0 mm3, field of view (FOV) = 217 × 224 mm, repetition time (TR) = 270 ms, flip angle (FA) = 25°, bandwidth = 150 Hz/Pixel. A separate scan with acquisition time of approximately 6 minutes was collected for each TE.
For ASL, an EPI-based PICORE-Q2TIPS acquisition was used to obtain quantitative CBF maps in 5 slices with coverage matched to that of the FLASH scans. The scan parameters were: resolution = 2.0 × 2.0 × 4.0 mm3, FOV = 220 × 220 mm, TR = 2300 ms, inflow times TI1/TI2 = 700/1800 ms, TE = 25 ms, bandwidth = 1570 Hz/Pixel. TI1 and TI2 were selected from a reported optimal range to avoid contamination from arteries and signal loss due to T1 decay that could create error in calculations of absolute perfusion (26). As part of the ASL acquisition, a measurement of the fully relaxed longitudinal magnetization of local tissue (M0T) was made on a voxel-by-voxel basis. To calibrate the CBF measurement, a map of M0B was calculated by scaling the map of M0T with the blood-brain partition coefficient, λ=1.04, as M0B = M0T/λ. The total scan time was approximately 7 minutes for acquisition of 90 ASL control-tag pairs.
Data analysis
Candidate through-plane veins in the gray matter were manually identified by tracing vessels through several axial slices to verify their superior-inferior orientation relative to B0 (Fig. 2a–b). For further assurance, the vessels were also typically view in the sagittal orientation, as presented in Fig. 1, to confirm the long-cylinder approximation. Previous work by Langham et al. (27) has demonstrated the validity of MR susceptometry with this long, parallel cylinder model on vessels with length approximately 6 times the diameter. Our own simulations revealed less than 5% oxygenation error in Yv estimates for veins with length-to-diameter ratio of 4.
Figure 2.
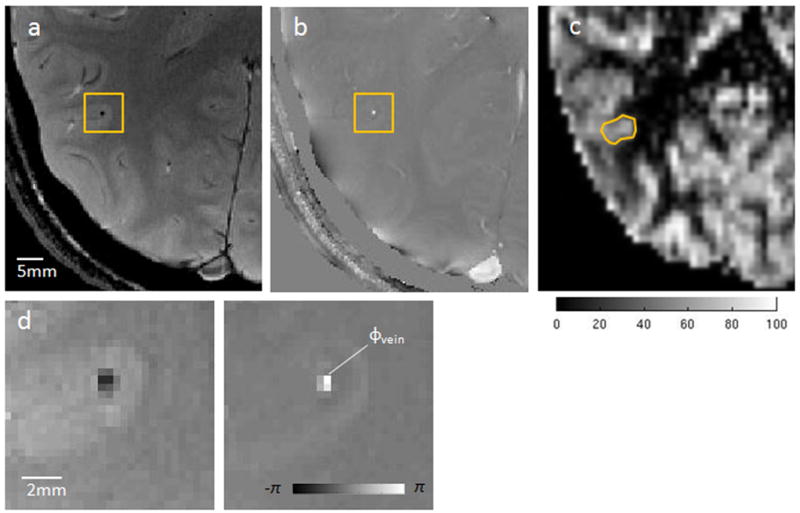
Illustration of PROM for quantification of Yv and CMRO2. (a) Axial magnitude; and (b) phase image from a 2D gradient echo acquisition. The rectangle highlights a through-plane gray matter vein of interest. (c) CBF map (ml/100g/min) from the corresponding slice in ASL acquisition with ROI used to measure regional perfusion of the identified vessel. (d) Zoomed view magnitude and phase (in radians) for the gray matter vein, where ϕvein is the representative phase value within the vessel.
The FLASH phase images were high-pass filtered to remove background field inhomogeneities that cause low-frequency spatial variations in the phase. A homodyne high pass filter was implemented by dividing the original complex signal by a low-pass filtered version of the image (32×32 Hanning filter), as described by Wang et al (28). This process effectively removed phase-wraps in the image and mitigated global variations in phase that could contribute bias to Yv quantification. Because vessels of interest were spatially narrow (~1–2 pixel diameter), the measured phase difference between the vein and surrounding tissue is expected to be robust to a kernel size on the order of 30 pixels.
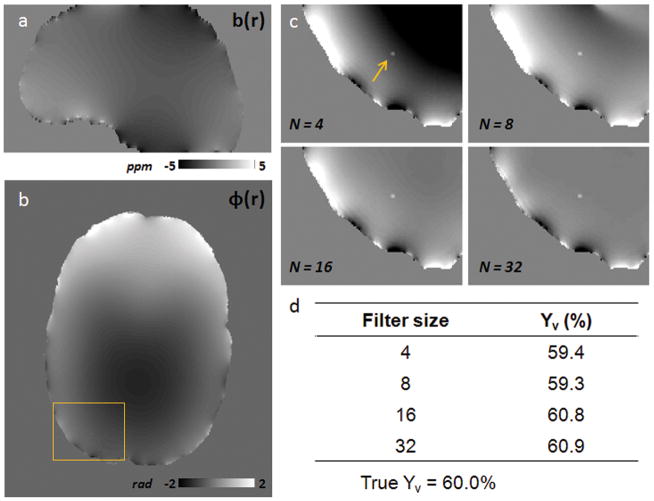
To evaluate potential bias from the adopted high pass filter size on our Yv estimates, simulations were performed on a representative narrow vessel parallel to B0. The simulated vein had a diameter of 1mm and a susceptibility value corresponding to an underlying oxygenation of Yv = 60% and Hct = 0.40. The vessel was simulated within a brain structure created using an anatomical brain mask, where χtissue = −9.05ppm was the assumed susceptibility value of brain parenchyma and χair = 0.36ppm was the assumed susceptibility of air outside of the head (29). The background field was then calculated from the created susceptibility distribution using multiplication with the dipole kernel in Fourier space (30), and a sagittal slice from the resulting field distribution is depicted in Fig 3a. Simulated phase images with contributions from both the background field and simulated parallel vessel were generated for TE = 10, 15, and 20 ms. High pass filtering was then performed on one axial slice at each TE for Hanning filter sizes of NxN = 4×4, 8×8, 16×16, and 32×32. Fig. 3 illustrates an axial phase slice simulated for TE = 10ms, and the corresponding ROI containing the vessel for each filter size. Yv estimates were made from the simulated phase difference between the vein and tissue for each filter size using the fitting procedure described below (Fig. 3d). In this simulation, Yv measurements were relatively robust to the kernel sizes considered, and the 32×32 filter choice resulted in less than one percentage point oxygen saturation of bias towards an overestimation of Yv. This suggests that our processing with a 32×32 Hanning filter has only a small effect on the relevant phase difference Δϕvein-tissue in identified narrow vessels.
Figure 3.
Comparison of Yv measurements for different Hanning high pass filter sizes. (a) Sagittal slice of the simulated background field map (ppm) from assumed values for susceptibility of brain tissue, χtissue = −9.05ppm, and susceptibility of the air outside the brain, χair = 0.36ppm. (b) Simulated axial phase image at TE = 10ms before filtering; the rectangle indicates the ROI containing the simulated parallel vein. (c) Zoomed phase ROI with vessel (arrow) for TE = 10ms after high-pass filtering with Hanning kernel sizes of NxN = 4×4, 8×8, 16×16, and 32×32. (d) Yv estimates using a linear fit of simulated Δϕvein-tissue across TE for each Hanning filter size.
For all identified vessels, Δϕvein-tissue was measured at each acquired TE. Phase inside the vein (ϕvein) was estimated using the brightest pixel observed, or in some cases the average of up to 4 bright pixels of similar value for the largest vessels, to avoid bias from partial-volume effects (Fig. 2d). ΔBvein-tissue was calculated through a linear fit of Δϕvein-tissue across TE’s, where the fit was constrained such that Δϕvein-tissue = 0 at TE = 0. The corresponding Yv was quantified only for vessels that demonstrated a robust fit for ΔBvein-tissue, as determined by an R2 value greater than 0.95. The constraint at TE = 0 was introduced as a physically realistic prior that we expect to reduce the variance of our phase estimates and not introduce biases. Table 1 compares Yv values calculated using the constrained linear fit with Yv values from an unconstrained linear fit in eight candidate veins from Subject 1. The mean Yv observed in the subject using the constraint (61.1 ± 6.4%) was not statistically significant from the mean Yv measured without the constraint (60.3 ± 10.5%, p = 0.85). In addition, the mean extrapolated phase value at TE = 0 in the unconstrained fit was not significantly different from 0, as expected (p = 0.74). However, using the constraint at TE = 0 decreased the standard deviation on Yv estimates for Subject 1 by several percent points oxygenation. As a design choice, the current method thus imposes the constraint at TE = 0 to improve the robustness of the Yv estimates.
Table 1.
Estimates of Yv in eight parallel vessels for Subject 1
| Vessel | Yv (%)(Constrained at TE = 0) | Yv (%)(Not constrained at TE = 0) | Fitted phase (rad) at TE = 0 |
|---|---|---|---|
| 1 | 56.9 | 46.8 | −0.45 |
| 2 | 51.2 | 42.5 | −0.38 |
| 3 | 66.8 | 71.2 | 0.20 |
| 4 | 67.0 | 60.3 | −0.31 |
| 5 | 67.3 | 63.4 | −0.17 |
| 6 | 54.8 | 60.8 | 0.27 |
| 7 | 65.5 | 70.8 | 0.24 |
| 8 | 59.5 | 66.5 | 0.30 |
|
| |||
| Mean | 61.1 ± 6.4 | 60.3 ± 10.5 | −0.04 ± 0.32 |
Mean Yv estimated from the constrained fit was not significantly different from mean Yv measured using the unconstrained fit (p=0.85). Mean phase at TE=0 for the unconstrained fit was not statistically different from 0 (p=0.74).
Quantitative CBF maps were generated from the average difference signal (ΔM) between control and tag images in the ASL acquisition as (26):
| [4] |
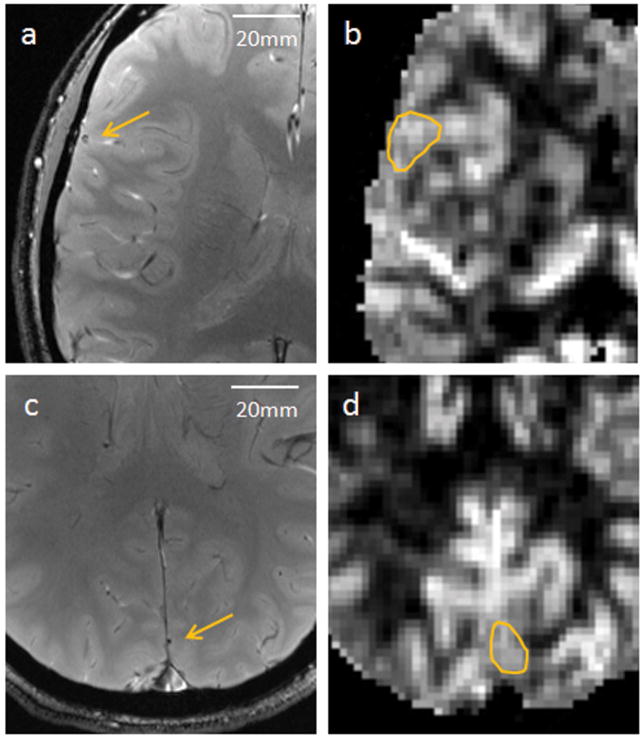
where the longitudinal relaxation of blood was assumed to be T1b = 1684 ms at 3 Tesla (31). Regional perfusion for each vein was determined by averaging CBF values from a local region of interest (ROI) in the appropriate CBF slice. The selected ROIs had an average volume of 253 ± 87 mm3 and were chosen in the spatial neighborhood around the candidate veins identified in the FLASH image (Fig. 2c). Additional examples of identified vessels and the corresponding ROI determined in the CBF map are presented in Fig. 4. Regional CMRO2 was then calculated for the tissue surrounding each candidate vessel using the measured Yv and local CBF.
Figure 4.
Additional examples of identified candidate vessels (arrows) in axial phase images from Subject 3 (a) and Subject 4 (c), acquired at TE = 20ms. (b,d) The corresponding CBF regions of interest identified for regional perfusion measurements.
Signal-to-noise ratio (SNR) analysis for Yv measurements
Simulations were performed to assess the effect of thermal noise on the Yv measurements. Assuming sufficiently high magnitude SNR (>2), the phase standard deviation is well estimated for each imaging TE as (32):
| [5] |
where σnoise is the standard deviation of Gaussian noise in the real and imaginary components of the MR signal and | I | is the magnitude image intensity. In the simulation, image intensity was calculated as | I | = 1000·exp( −TE/T2*blood ), where the T2* relaxation of blood (T2* blood) was determined empirically from the gradient echo data using an ROI within the sagittal sinus. The mean T2*blood measured across subjects was 24.7 ± 3.8 ms. The calculated σphase at each TE was propagated to reveal the expected variation in measured Yv as a function of SNR (Fig. 5). To compare with the simulation results, the SNR associated with the Yv measurements in vivo was also determined. The σnoise for each subject was estimated from an ROI outside of the brain in the complex gradient echo signal. Signal intensity was recorded from the voxels associated with the ϕvein measurements, which informed the range of SNR observed in the Yv estimates in vivo.
Figure 5.
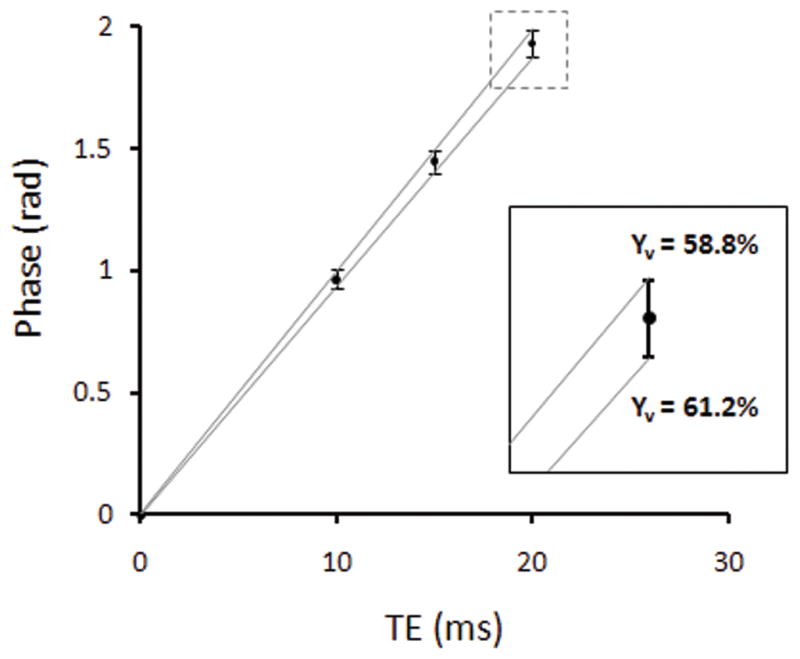
Simulated phase and standard deviation across TE for true Yv = 60% and representative magnitude SNR = 40 (at TE=10ms), which was typical for the in vivo acquisitions presented here. The zoomed inset illustrates the variation in estimated Yv between 58.8% and 61.2% due to thermal noise.
RESULTS
Table 2 describes the mean gray matter Yv, CBF, and CMRO2 measured in each subject using the proposed technique. For each subject, an average of 8.5 ± 2 vessels were identified for analysis within the imaging slab. A gray matter estimate for each parameter was made by averaging over measurements in the frontal, temporal, and occipital lobes in each volunteer. Study averages across subjects were 59.7 ± 2.4% for Yv, 49.8 ± 5.5 ml/100g/min for CBF, and 151 ± 15 μmol/100g/min for CMRO2 (mean ± SD, n=12).
Table 2.
Summary of Yv and CMRO2 measurements in gray matter (n=12)
| Subject | Yv (%) | CBF (ml/100g/min) | CMRO2 (μmol/100g/min) |
|---|---|---|---|
| 1 | 61 ± 6 | 52 ± 8 | 146 ± 33 |
| 2 | 64 ± 4 | 58 ± 7 | 165 ± 28 |
| 3 | 58 ± 4 | 52 ± 9 | 174 ± 38 |
| 4 | 58 ± 3 | 51 ± 11 | 153 ± 34 |
| 5 | 56 ± 4 | 44 ± 8 | 155 ± 34 |
| 6 | 58 ± 3 | 41 ± 5 | 134 ± 12 |
| 7 | 61 ± 2 | 53 ± 7 | 162 ± 17 |
| 8 | 61 ± 4 | 55 ± 11 | 155 ± 33 |
| 9 | 62 ± 4 | 49 ± 6 | 133 ± 18 |
| 10 | 58 ± 3 | 46 ± 6 | 151 ± 22 |
| 11 | 59 ± 3 | 42 ± 4 | 123 ± 17 |
| 12 | 60 ± 4 | 56 ± 9 | 162 ± 36 |
|
| |||
| Mean | 59.7 ± 2.4 | 49.8 ± 5.5 | 151 ± 15 |
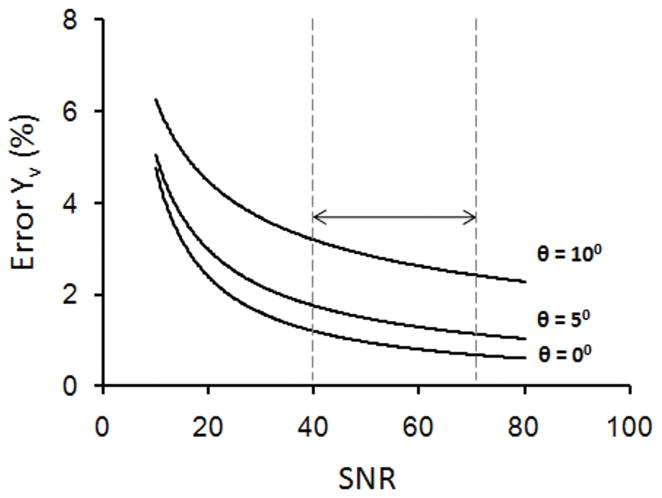
To evaluate the robustness of the method in quantifying Yv, we propagated the effect of noise on the oxygenation measurements from phase. Results from simulations showed that the standard deviation in our Yv estimates due to noise was less than 5% percentage points oxygen saturation for SNR as low as 10. The SNR simulation was repeated for vessel tilt angles of 0, 5, and 10° to jointly assess thermal noise and vessel orientation as sources of error, as in Fig. 6. The gradient echo measurements in vivo had average SNR in the range of 40–70. From these simulations, we expect the bias in Yv measurements due to vessel tilt to dominate the error from thermal noise within this SNR range (Fig. 6).
Figure 6.
Expected measurement error in % oxygenation due to noise as a function of SNR. Separate curves are plotted for vessel tilt angles of 0, 5, and 10°. The arrow indicates the typical SNR range for the gradient echo acquisition, suggesting a larger bias due to vessel geometry than uncertainty due to Gaussian noise in the Yv measurements.
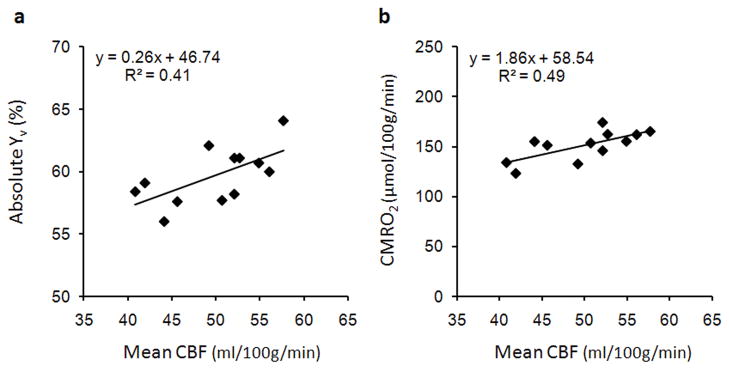
Since we quantified several different parameters describing brain physiology, it is interesting to study the relationships between the measured parameters. Estimates of Yv and CBF were acquired independently in our technique, and a positive correlation between the two parameters was observed across subjects in Fig. 7a (R2=0.41, p<0.03). This suggests that subjects with higher cerebral perfusion tend to have higher oxygenation, which is consistent with correlations reported in previous studies (16,17). A positive correlation was also observed between CBF and CMRO2 (R2=0.49, p<0.02) in Fig. 7b, suggesting that absolute estimates of CMRO2 are highly dependent on perfusion. There was no correlation between measurements of Yv and CMRO2.
Figure 7.
Correlation of subject means for physiological parameters. (a) Scatter plot of average CBF and Yv, indicating a positive correlation between the parameters across subjects (R2=0.41, p<0.03). (b) Scatter plot of average CBF and CMRO2, indicating that CMRO2 values are dependent on perfusion across subjects (R2=0.49, p<0.02).
The absolute CMRO2 values measured with PROM comport with results from previous work by both PET and MRI (Fig. 8). Our gray matter CMRO2 measurement agreed well with gray matter values determined by PET (11,12), and was greater than global estimates previously described by MRI (16,17). Across the studies considered here, the average CMRO2 in gray matter was 159 ± 3 μmol/100g/min and average whole-brain CMRO2 was 131 ± 8 μmol/100g/min. This is consistent with the idea that whole-brain CMRO2 measurements also include white matter metabolism, which is known to be lower than gray matter metabolism (10,13).
Figure 8.
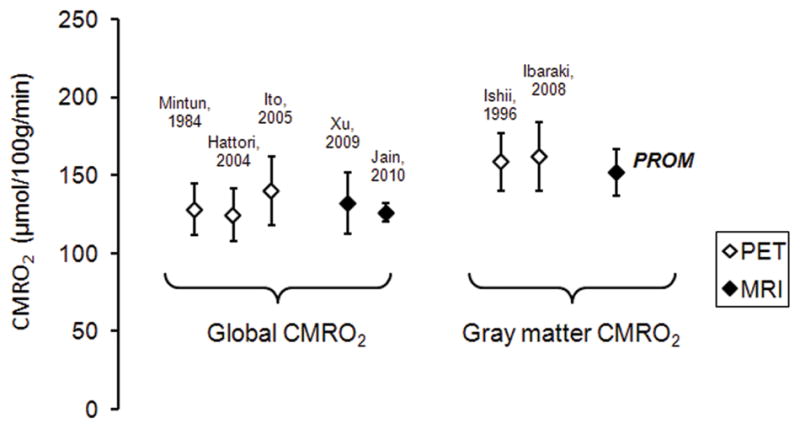
Comparison of mean CMRO2 in whole brain [Mintun 1984 (10); Hattori 2004 (12); Ito 2005 (13); Xu 2009 (16); Jain 2010 (17)] and gray matter [Ishii 1996 (11); Ibaraki 2008 (14)] reported in literature. Previous MRI estimates are for global CMRO2, whereas the PROM estimate is an average across gray matter regions.
We were also interested to see if PROM could detect any regional differences in brain physiology at rest. In 11 of the 12 subjects, two or more representative vessels were identified in the frontal, temporal, and occipital lobes. Care was taken to manually attribute suitable veins to the appropriate region, as illustrated in Fig. 9. Averages of the parameters of interest in the three regions were computed for each subject and compared using a one-way ANOVA analysis across subjects. Significantly greater CBF and CMRO2 (p<0.01) were detected in the occipital cortex compared to the frontal and temporal cortices at rest (Table 3). This may reflect increased perfusion and metabolism in visual areas associated with the occipital lobe. However, no statistical differences were observed in Yv across the three regions. The spatial variations in oxygen consumption and flow observed with PROM in the resting cortex agree well with those reported by Ishii et al. using 15O PET imaging (11), and values from both studies for the same regions are presented in Table 3.
Figure 9.
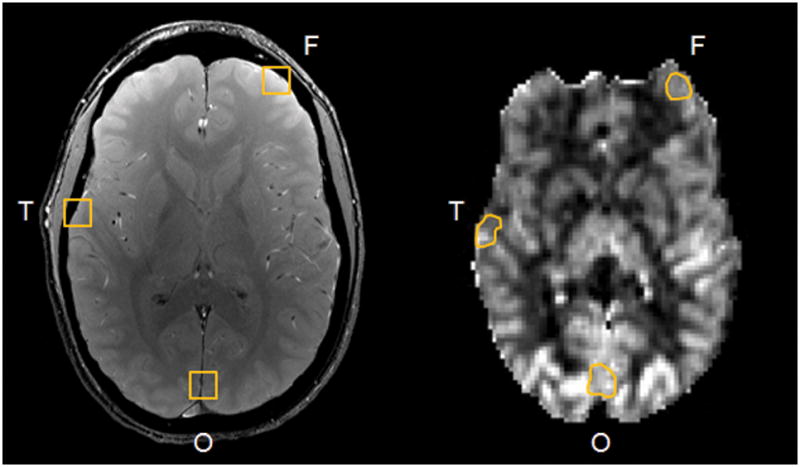
Example cerebral vessels identified in the frontal, temporal, and occipital cortices of the gradient echo image for regional analysis. Corresponding ROIs in the CBF map from ASL are shown.
Table 3.
For the PROM study, one way ANOVA analyses were used to compare each parameter across the three regions.
| Parameter | Frontal | Temporal | Occipital | |
|---|---|---|---|---|
| PROM | Yv (%) | 60.8 ± 3 | 59.5 ± 3 | 59.3 ± 3 |
| CBF (ml/100g/min) | 43.9 ± 6 | 45.7 ± 4 | 54.1 ± 7 ** | |
| CMRO2 (μmol/100g/min) | 130 ± 17 | 140 ± 17 | 166 ± 18 ** | |
|
| ||||
| Ishii et al., 1996 | Yv (%) | 59.4 ± 7 | 58.7 ± 7 | 58.7 ± 6 |
| CBF (ml/100g/min) | 54.8 ± 9 | 56.3 ± 9 | 66.1 ± 13 * | |
| CMRO2 (μmol/100g/min) | 160 ± 27 | 169 ± 32 | 194 ± 46 * | |
(p < 0.05),
(p< 0.01).
DISCUSSION
We have developed a technique using MRI to quantify local Yv and CMRO2 in the brain and demonstrated the method on human volunteers. The method builds on previous work to measure global oxygenation and metabolism in the sagittal sinus using TRUST and susceptometry in MRI (16,17). In contrast to the global values derived from sagittal sinus measurements, regional estimates of these physiological parameters are currently unavailable using noninvasive techniques, and have the potential to provide novel information about brain function and disease. The proposed technique is readily applicable on clinical scanners because it uses standard GRE and ASL sequences for data acquisition. Although the current protocol is relatively lengthy (approximately 25 minutes), improved implementation of a flow-compensated, multi-echo FLASH sequence will substantially reduce scantime for clinical applications. Estimates of gray matter Yv, CBF, and CMRO2 using PROM lie within the normal physiological range reported in the literature and show promise in detecting regional differences in physiology across the brain. Future work will cross-validate regional CMRO2 values from PROM with the proposed T2-based QUIXOTIC method (20), which uses velocity-selective arterial spin labeling to quantify the rate of oxygen metabolism.
In this study, positive correlation was observed between the mean Yv and CBF, as well as between the mean CMRO2 and CBF estimated across subjects. This agrees with work by Xu et al., which reported positive correlations between the parameters using whole-brain estimates for CMRO2 with TRUST MRI (16). We also observed significantly greater CBF and CMRO2 in the occipital cortex, where visual function is localized, compared to the frontal and temporal cortices. Oxygen saturation, however, remained relatively constant across the three regions analyzed. These findings are concordant with previous results from PET imaging (11), and are relevant to ongoing work studying the distribution of oxidative and non-oxidative metabolic pathways to meet cerebral energy demands (33,34). Regional variations in metabolic pathways may represent differential mechanisms in response to energy needs associated with specific brain systems (33) or to local, task-induced energy demands (34). Application of PROM for regional quantification of oxygen metabolism at rest and during functional activity may provide further insight into spatial variations in metabolic pathways across the brain.
In the current method, Yv estimates were made from phase measurements using assumed values for the susceptibility difference between fully oxygenated and fully deoxygenated blood (Δχdo) and hematocrit (Hct). Here we chose Δχdo = 0.18 ppm for consistency with several values commonly used the literature (23,35,36), and this particular value has been used in MR susceptometry to provide meaningful estimates of oxygenation in cerebral pial veins (21) and in the internal jugular vein (22). In recent literature, Spees et al. (37) reported an alternate value of Δχdo = 0.27ppm, which has also been used for Yv measurements in femoral vessels (27) and in large draining veins of the brain (17). We note that using Δχdo = 0.27 ppm in our analysis would lead to a mean absolute Yv of 73% for this study, which is higher than the normal blood oxygenation observed using MRI and PET. This choice of susceptibility value will be evaluated in future work in light of its impact on quantitative Yv results. In addition, in this work hematocrit values were assumed, with Hct = 0.42 for males and Hct = 0.38 for females. Hematocrit is largely variable between individuals, typically ranging from 0.35–0.50, and we propose to measure this parameter in each subject using a finger prick device to refine oxygenation estimates in future studies.
For Yv estimates in this work, we have assumed that arterial blood is fully oxygenated, and that cerebral tissue has the same susceptibility as arterial blood. This is a reasonable assumption for healthy subjects, and empirically, there is little phase contrast between arteries and tissue. However, this assumption may no longer hold in pathology or in hypoxia when arterial blood is no longer fully oxygenated. In addition, because this analysis focused on candidate gray matter veins in young subjects, the results do not take into account regional variations in tissue susceptibility or changes with age. For instance, Duyn et al. have measured a small susceptibility difference between gray matter and white matter, on the order of 0.02ppm (38), and larger susceptibility values on the order of 0.1ppm are observed in iron-rich structures in the basal ganglia. This literature suggests that tissue susceptibility distributions can be determined to refine phase measurements for Yv estimation across different regions of the brain.
To quantify CMRO2 in this study, the Fick principle of arteriovenous difference was used to relate CMRO2 to Yv and CBF. In the PROM approach, CBF measurements were made using perfusion imaging with ASL, which is sensitive to the delivery of arterial blood to the capillary bed and appropriately characterizes the rate of delivery of oxygenated blood to brain tissue. It is important to note that an alternate method to measure CBF, used by Jain et al. (17), measures blood flow velocity with MRI phase-contrast and calculates CBF with an additional estimate of the corresponding brain volume. Both approaches ultimately aim to estimate the rate of inflow of oxygen-rich blood accessible to cerebral tissue, and ideally provide concordant information about global CBF in larger vessels. However, to our knowledge, local CBF as measured using ASL in ml/100g/min is difficult to estimate from vessel flow velocity without an additional measurement of local tissue volume.
One current limitation of our technique is its restrictive dependence on vessel geometry and orientation. To simplify the quantification of susceptibility differences between the vasculature and the surrounding tissue, we made two assumptions. First, we have focused only on vessel segments that are narrow relative to their length, and can thus be modeled as an infinite cylinder. Secondly, we only consider vessel segments parallel to the main magnetic field. These conditions naturally limit the set of vessels that can be analyzed with the current method, and in some subjects as few as 6 suitable vessels were identified within the 20mm-thick imaging slab. Although an appropriate candidate vein was typically present in each major lobe within the slab, the condition of long, parallel vessel remains an important limitation to the current method. In addition, MR susceptometry with this model may introduce bias to the Yv measurements depending on how well the assumptions hold. Previous work on femoral vessels in vivo revealed that the long cylinder model is valid for length-to-diameter ratio as low as 6, and found only a few percent variation in measured oxygenation due to vessel tilt as large as 20° (27). Based on the SNR simulations presented here, we expect the variation in Yv due to noise with our current acquisition to be small (less than ~5%). Most of our error is expected to be from bias due to the vessel geometry model, such as in cases when the vessel is tilted with respect to the main field. These considerations suggest that the vessel model is valid for measurements of oxygenation and that it can be refined appropriately to reduce errors for veins in vivo with tilt angles that deviate from zero.
Extension of phase-based Yv estimates to vein segments with arbitrary tilt or geometry would require more complex models to account for the field external to the vessel and changes in SNR along the vessel length. Susceptibility measurements from phase are often noisier for such vessels because the imaging dipole kernel undersamples the susceptibility distribution in k-space (39). In particular, spatial frequency data from vein segments oriented at or close to a conical surface along the magic angle of 54.7° in k-space is mostly lost. To address these considerations, we will pursue development of quantitative susceptibility mapping (QSM) for vessels with general curvature, along similar lines to techniques currently being developed iron quantification in the brain (39,40). In particular, L1-norm regularization of the inversion of field maps to susceptibility maps have been successful in mapping regional iron deposition (39). From magnetostatics, susceptibility shifts are understood to cause perturbations in the main magnetic field as well as T2* decay. Because susceptibility shifts that are not manifested in T2* images are spatially smooth, and therefore “sparse” in an appropriate basis, L1-norm regularization can be used to fit for a spatial susceptibility distribution. We therefore suggest the use of QSM to extend our analysis of Yv to a larger set of vessels with arbitrary orientation and geometry. Another potential benefit of QSM is to reduce the error margin on Yv measurements by averaging susceptibility values reconstructed by the algorithm along curved vessels.
Adequate spatial resolution in phase images is critical for accurate oxygenation measurements in this work. To avoid bias from partial volume effects, in some cases phase inside the vein was measured from the brightest observed pixel for narrow vessels, as in Fig. 2b. However, for smaller vessels that do not meet a critical minimum diameter, partial-volume effects may distort phase measurements and result in overestimation of Yv. The relatively high SNR in our current gradient echo acquisition suggests that the resolution of phase images can be improved for measurements of Yv. PROM can take advantage of improved SNR at higher field such as 7 Tesla for enhanced spatial resolution. A critical benefit of the higher resolution is mitigation of partial-volume effects, and the improved spatial resolution will allow analysis of smaller cerebral veins expected to be more indicative of regional brain function and the ability to process a larger set of vessels. In the current technique, acquired phase images are processed with a homodyne high pass filter (32 × 32 Hanning). This filtering technique is suboptimal because suppression of low spatial frequencies inherently depends on the filter size and may not always provide adequate reduction of background inhomogeneities, which vary from subject to subject (41). Improved filtering approaches such as dipole fitting to the background field (42) and optimized phase reconstruction using multi-channel coil sensitivity information (43), will be the focus of refinements to the filtering algorithm. We note that main field and RF field inhomogeneities are likely to pose a more severe problem at high field and that more elaborate processing may be needed for the quantification of Yv.
Another limitation of our method is the relatively low resolution of CBF maps from which local perfusion values are quantified. ASL intrinsically has low SNR because the perfusion weighting in the ASL difference signal derives from small CBF-dependent changes between control and tag images. At 3 Tesla, our ASL acquisition uses in-plane resolution that is four times lower than the GRE sequence and has twice the slice thickness. Although the ROIs in the perfusion maps were selected in the spatial neighborhood of candidate gray matter veins, it is likely that the technique averages gray and white matter perfusion to some degree in quantifying local CBF due to its low resolution. ASL performance can be enhanced using 3D readouts such as 3D GRASE for improved spatial and temporal SNR, shorter scan time, and elimination of slice-dependent effects (44). Future implementation of ASL at 7 Tesla also offers improved resolution due to increased SNR and shorter longitudinal relaxation times at higher field strength (45).
Improved spatial resolution in ASL is important to identifying the drainage territory for each vein, which is not fully understood in the current method. Although ROIs in the CBF maps were in the spatial neighborhood of identified veins, this region may not be the physiological draining territory for the corresponding vessels. For instance, the vein may drain upstream areas and not the local tissue to which it is spatially matched. The true physiological region of drainage likely depends on vessel size and its position within the vasculature, and determines the optimal ROI for accurate local CBF measurements. Improved resolution would allow for more sophisticated segmentation of ASL images and coregistration between CBF maps and phase images. This would allow us to trace candidate pial veins within the slab of interest and make an educated selection of the local perfusion territory for each vessel. Knowledge of vessel drainage in future work would improve matching of perfusion values in tissue to appropriate cerebral veins, and potentially extend PROM to create maps of local CMRO2 in the brain.
CONCLUSIONS
This work demonstrates that PROM, the proposed method, can provide regional estimates of blood oxygenation, blood flow, and oxygen metabolism in the brain. The technique is noninvasive and straightforward to implement, and can provide information about local changes in cerebral physiology during functional activation and in cases of disease that disrupt cerebral metabolism.
Acknowledgments
This work was supported by NIH grants T90-DA022759, T32-GM07753, R01-EB007942, Siemens Healthcare, and Siemens-MIT Alliance.
References
- 1.Gallagher D, Belmonte D, Deurenberg P, Wang Z, Krasnow N, Pi-Sunyer FX, Heymsfield SB. Organ-tissue mass measurement allows modeling of REE and metabolically active tissue mass. Am J Physiol. 1998;275(2.1):E249–258. doi: 10.1152/ajpendo.1998.275.2.E249. [DOI] [PubMed]
- 2.Magistretti PJ, Pellerin L. Cellular mechanisms of brain energy metabolism. Relevance to functional brain imaging and to neurodegenerative disorders. Ann N Y Acad Sci. 1996;777:380–387. doi: 10.1111/j.1749-6632.1996.tb34449.x. [DOI] [PubMed] [Google Scholar]
- 3.Viswanathan A, Freeman RD. Neurometabolic coupling in cerebral cortex reflects synaptic more than spiking activity. Nat Neurosci. 2007;10(10):1308–1312. doi: 10.1038/nn1977. [DOI] [PubMed] [Google Scholar]
- 4.Thompson JK, Peterson MR, Freeman RD. Single-neuron activity and tissue oxygenation in the cerebral cortex. Science. 2003;299(5609):1070–1072. doi: 10.1126/science.1079220. [DOI] [PubMed] [Google Scholar]
- 5.Ito H, Ibaraki M, Kanno I, Fukuda H, Miura S. Changes in cerebral blood flow and cerebral oxygen metabolism during neural activation measured by positron emission tomography: comparison with blood oxygenation level-dependent contrast measured by functional magnetic resonance imaging. J Cereb Blood Flow Metab. 2005;25(3):371–377. doi: 10.1038/sj.jcbfm.9600030. [DOI] [PubMed] [Google Scholar]
- 6.Donahue MJ, Blicher JU, Ostergaard L, Feinberg DA, MacIntosh BJ, Miller KL, Gunther M, Jezzard P. Cerebral blood flow, blood volume, and oxygen metabolism dynamics in human visual and motor cortex as measured by whole-brain multi-modal magnetic resonance imaging. J Cereb Blood Flow Metab. 2009;29(11):1856–1866. doi: 10.1038/jcbfm.2009.107. [DOI] [PubMed] [Google Scholar]
- 7.Miles KA, Williams RE. Warburg revisited: imaging tumour blood flow and metabolism. Cancer Imaging. 2008;8:81–86. doi: 10.1102/1470-7330.2008.0011. [DOI] [PMC free article] [PubMed] [Google Scholar]
- 8.Sobesky J, Zaro Weber O, Lehnhardt FG, Hesselmann V, Neveling M, Jacobs A, Heiss WD. Does the mismatch match the penumbra? Magnetic resonance imaging and positron emission tomography in early ischemic stroke. Stroke. 2005;36(5):980–985. doi: 10.1161/01.STR.0000160751.79241.a3. [DOI] [PubMed] [Google Scholar]
- 9.Ishii K, Kitagaki H, Kono M, Mori E. Decreased medial temporal oxygen metabolism in Alzheimer’s disease shown by PET. J Nucl Med. 1996;37(7):1159–1165. [PubMed] [Google Scholar]
- 10.Mintun MA, Raichle ME, Martin WR, Herscovitch P. Brain oxygen utilization measured with O-15 radiotracers and positron emission tomography. J Nucl Med. 1984;25(2):177–187. [PubMed] [Google Scholar]
- 11.Ishii K, Sasaki M, Kitagaki H, Sakamoto S, Yamaji S, Maeda K. Regional difference in cerebral blood flow and oxidative metabolism in human cortex. J Nucl Med. 1996;37(7):1086–1088. [PubMed] [Google Scholar]
- 12.Hattori N, Bergsneider M, Wu HM, Glenn TC, Vespa PM, Hovda DA, Phelps ME, Huang SC. Accuracy of a method using short inhalation of (15)O-O(2) for measuring cerebral oxygen extraction fraction with PET in healthy humans. J Nucl Med. 2004;45(5):765–770. [PubMed] [Google Scholar]
- 13.Ito H, Kanno I, Fukuda H. Human cerebral circulation: positron emission tomography studies. Ann Nucl Med. 2005;19(2):65–74. doi: 10.1007/BF03027383. [DOI] [PubMed] [Google Scholar]
- 14.Ibaraki M, Miura S, Shimosegawa E, Sugawara S, Mizuta T, Ishikawa A, Amano M. Quantification of cerebral blood flow and oxygen metabolism with 3-dimensional PET and 15O: validation by comparison with 2-dimensional PET. J Nucl Med. 2008;49(1):50–59. doi: 10.2967/jnumed.107.044008. [DOI] [PubMed] [Google Scholar]
- 15.Davis TL, Kwong KK, Weisskoff RM, Rosen BR. Calibrated functional MRI: mapping the dynamics of oxidative metabolism. Proc Natl Acad Sci USA. 1998;95(4):1834–1839. doi: 10.1073/pnas.95.4.1834. [DOI] [PMC free article] [PubMed] [Google Scholar]
- 16.Xu F, Ge Y, Lu H. Noninvasive quantification of whole-brain cerebral metabolic rate of oxygen (CMRO2) by MRI. Magn Reson Med. 2009;62(1):141–148. doi: 10.1002/mrm.21994. [DOI] [PMC free article] [PubMed] [Google Scholar]
- 17.Jain V, Langham MC, Wehrli FW. MRI estimation of global brain oxygen consumption rate. J Cereb Blood Flow Metab. 2010;30(9):1598–1607. doi: 10.1038/jcbfm.2010.49. [DOI] [PMC free article] [PubMed] [Google Scholar]
- 18.Kety SS, Schmidt CF. The Effects of Altered Arterial Tensions of Carbon Dioxide and Oxygen on Cerebral Blood Flow and Cerebral Oxygen Consumption of Normal Young Men. J Clin Invest. 1948;27(4):484–492. doi: 10.1172/JCI101995. [DOI] [PMC free article] [PubMed] [Google Scholar]
- 19.van Zijl PC, Eleff SM, Ulatowski JA, Oja JM, Ulug AM, Traystman RJ, Kauppinen RA. Quantitative assessment of blood flow, blood volume and blood oxygenation effects in functional magnetic resonance imaging. Nat Med. 1998;4(2):159–167. doi: 10.1038/nm0298-159. [DOI] [PubMed] [Google Scholar]
- 20.Bolar DS, Rosen BR, Sorensen AG, Adalsteinsson E. Quantitative imaging of extraction of oxygen and tissue consumption (QUIXOTIC) using velocity selective spin labeling. Proceedings of the 17th Annual Meeting of ISMRM, Honolulu, Hawaii. 2009:6050. doi: 10.1002/mrm.22946. [DOI] [PMC free article] [PubMed] [Google Scholar]
- 21.Haacke EM, Lai S, Reichenbach JR, Kuppusamy K, Hoogenraad FG, Takeichi H, Lin W. In vivo measurement of blood oxygen saturation using magnetic resonance imaging: a direct validation of the blood oxygen level-dependent concept in functional brain imaging. Hum Brain Mapp. 1997;5(5):341–346. doi: 10.1002/(SICI)1097-0193(1997)5:5<341::AID-HBM2>3.0.CO;2-3. [DOI] [PubMed] [Google Scholar]
- 22.Fernandez-Seara MA, Techawiboonwong A, Detre JA, Wehrli FW. MR susceptometry for measuring global brain oxygen extraction. Magn Reson Med. 2006;55(5):967–973. doi: 10.1002/mrm.20892. [DOI] [PubMed] [Google Scholar]
- 23.Weisskoff RM, Kiihne S. MRI susceptometry: image-based measurement of absolute susceptibility of MR contrast agents and human blood. Magn Reson Med. 1992;24(2):375–383. doi: 10.1002/mrm.1910240219. [DOI] [PubMed] [Google Scholar]
- 24.Guyton AC, Hall JE. Textbook of medical physiology. Philadelphia: Saunders; 2000. Red blood cells, anemia, and polycythemia; pp. 382–388. [Google Scholar]
- 25.Clark MR. Mean corpuscular hemoglobin concentration and cell deformability. Ann N Y Acad Sci. 1989;565:284–294. doi: 10.1111/j.1749-6632.1989.tb24176.x. [DOI] [PubMed] [Google Scholar]
- 26.Luh WM, Wong EC, Bandettini PA, Hyde JS. QUIPSS II with thin-slice TI1 periodic saturation: a method for improving accuracy of quantitative perfusion imaging using pulsed arterial spin labeling. Magn Reson Med. 1999;41(6):1246–1254. doi: 10.1002/(sici)1522-2594(199906)41:6<1246::aid-mrm22>3.0.co;2-n. [DOI] [PubMed] [Google Scholar]
- 27.Langham MC, Magland JF, Epstein CL, Floyd TF, Wehrli FW. Accuracy and precision of MR blood oximetry based on the long paramagnetic cylinder approximation of large vessels. Magn Reson Med. 2009;62(2):333–340. doi: 10.1002/mrm.21981. [DOI] [PMC free article] [PubMed] [Google Scholar]
- 28.Wang Y, Yu Y, Li D, Bae KT, Brown JJ, Lin W, Haacke EM. Artery and vein separation using susceptibility-dependent phase in contrast-enhanced MRA. J Magn Reson Imaging. 2000;12(5):661–670. doi: 10.1002/1522-2586(200011)12:5<661::aid-jmri2>3.0.co;2-l. [DOI] [PubMed] [Google Scholar]
- 29.Schenck JF. The role of magnetic susceptibility in magnetic resonance imaging: MRI magnetic compatibility of the first and second kinds. Med Phys. 1996;23(6):815–850. doi: 10.1118/1.597854. [DOI] [PubMed] [Google Scholar]
- 30.Marques JP, Bowtell R. Application of a Fourier-Based Method for Rapid Calculation of Field Inhomogeneity Due to Spatial Variation of Magnetic Susceptibility. Concepts in Magnetic Resonance Part B. 2005;25B(1):65–78. [Google Scholar]
- 31.Lu H, Clingman C, Golay X, van Zijl PC. Determining the longitudinal relaxation time (T1) of blood at 3.0 Tesla. Magn Reson Med. 2004;52(3):679–682. doi: 10.1002/mrm.20178. [DOI] [PubMed] [Google Scholar]
- 32.Lathi BP. Modern digital and analog communication systems. New York: Holt, Rinehart, and Winston; 1983. Behavior of analog systems in the presence of noise; pp. 532–576. [Google Scholar]
- 33.Vaishnavi SN, Vlassenko AG, Rundle MM, Snyder AZ, Mintun MA, Raichle ME. Regional aerobic glycolysis in the human brain. Proc Natl Acad Sci U S A. 2010;107(41):17757–17762. doi: 10.1073/pnas.1010459107. [DOI] [PMC free article] [PubMed] [Google Scholar]
- 34.Lin AL, Fox PT, Hardies J, Duong TQ, Gao JH. Nonlinear coupling between cerebral blood flow, oxygen consumption, and ATP production in human visual cortex. Proc Natl Acad Sci U S A. 2010;107(18):8446–8451. doi: 10.1073/pnas.0909711107. [DOI] [PMC free article] [PubMed] [Google Scholar]
- 35.Thulborn KR, Waterton JC, Matthews PM, Radda GK. Oxygenation dependence of the transverse relaxation time of water protons in whole blood at high field. Biochim Biophys Acta. 1982;714(2):265–270. doi: 10.1016/0304-4165(82)90333-6. [DOI] [PubMed] [Google Scholar]
- 36.Plyavin YA, Blum EY. Magnetic parameters of blood cells and high-gradient paramagnetic and diamagnetic phoresis. Magnetohydrodynamics. 1983;19:349–359. [Google Scholar]
- 37.Spees WM, Yablonskiy DA, Oswood MC, Ackerman JJ. Water proton MR properties of human blood at 1.5 Tesla: magnetic susceptibility, T(1), T(2), T*(2), and non-Lorentzian signal behavior. Magn Reson Med. 2001;45(4):533–542. doi: 10.1002/mrm.1072. [DOI] [PubMed] [Google Scholar]
- 38.Duyn JH, van Gelderen P, Li TQ, de Zwart JA, Koretsky AP, Fukunaga M. High-field MRI of brain cortical substructure based on signal phase. Proc Natl Acad Sci U S A. 2007;104(28):11796–11801. doi: 10.1073/pnas.0610821104. [DOI] [PMC free article] [PubMed] [Google Scholar]
- 39.Liu J, Liu T, de Rochefort L, Khalidov I, Prince MR, Wang Y. Quantitative susceptibility mapping by regulating the field to source inverse problem with a sparse prior derived from the Maxwell equation: validation and application to brain. Proceedings of the 18th Annual Meeting of ISMRM, Stockholm, Sweden. 2010:4996. [Google Scholar]
- 40.de Rochefort L, Liu T, Kressler B, Liu J, Spincemaille P, Lebon V, Wu J, Wang Y. Quantitative susceptibility map reconstruction from MR phase data using bayesian regularization: validation and application to brain imaging. Magn Reson Med. 2010;63(1):194–206. doi: 10.1002/mrm.22187. [DOI] [PubMed] [Google Scholar]
- 41.Langham MC, Magland JF, Floyd TF, Wehrli FW. Retrospective correction for induced magnetic field inhomogeneity in measurements of large-vessel hemoglobin oxygen saturation by MR susceptometry. Magn Reson Med. 2009;61(3):626–633. doi: 10.1002/mrm.21499. [DOI] [PMC free article] [PubMed] [Google Scholar]
- 42.Liu T, Khalidov I, de Rochefort L, Spincemaille P, Liu J, Tsiouris AJ, Wang Y. A novel background field removal method for MRI using projection onto dipole fields (PDF) NMR Biomed. 2011 doi: 10.1002/nbm.1670. doi: 10.1002/nbm.167. [DOI] [PMC free article] [PubMed] [Google Scholar]
- 43.Chen Z, Johnston LA, Kwon DH, Oh SH, Cho ZH, Egan GF. An optimised framework for reconstructing and processing MR phase images. Neuroimage. 2010;49(2):1289–1300. doi: 10.1016/j.neuroimage.2009.09.071. [DOI] [PubMed] [Google Scholar]
- 44.Fernandez-Seara MA, Wang Z, Wang J, Rao HY, Guenther M, Feinberg DA, Detre JA. Continuous arterial spin labeling perfusion measurements using single shot 3D GRASE at 3 T. Magn Reson Med. 2005;54(5):1241–1247. doi: 10.1002/mrm.20674. [DOI] [PubMed] [Google Scholar]
- 45.Gardener AG, Gowland PA, Francis ST. Implementation of quantitative perfusion imaging using pulsed arterial spin labeling at ultra-high field. Magn Reson Med. 2009;61(4):874–882. doi: 10.1002/mrm.21796. [DOI] [PubMed] [Google Scholar]


