

Abstract
During development inhibitor of DNA-bind-2 (Id2) regulates proliferation and differentiation. Id2 expression has been detected in cancer cells, yet its cellular function and validity as a therapeutic target remains largely unknown. Immunohistochemical analysis of colorectal cancer (CRC) specimens revealed that Id2 was undetectable in normal colonic mucosa, but occurs in 40% of primary tumors and in most CRC liver metastases (P < 0.0001). Additionally, Id2 was expressed in all CRC cell lines assayed. CRC cells with reduced Id2 expression demonstrated reduced proliferation. Analysis of CRC cell cycle regulatory proteins showed that reducing Id2 levels reduces cyclin D1 levels and increased p21 levels. Reduction of Id2 expression also enhanced tumor cell apoptosis, increasing levels of the pro-apoptotic protein Bim/Bod, and cleavage of caspase-7 and poly (ADP-ribose) polymerase. In vivo studies show tumors derived from cells with decreased Id2 levels formed smaller tumors with fewer metastases compared with tumors with normal levels (P < 0.05). Furthermore, intraperitoneal administration of Id2 small interfering RNA (siRNA) conjugated with the neutral liposome 1,2-dioleoyl-sn-glycero-3-phosphatidylcholine decreased tumor burden in mice compared with control treatment (P = 0.006). We conclude that Id2 is upregulated in CRC, and is important in promoting cell survival. In vivo targeting of Id2 by siRNA establishes that it is a valid therapeutic target where its expression occurs. Oncogene (2008) 27, 7192–7200; doi:10.1038/onc.2008.356; published online 22 September 2008
Keywords: Id2, colorectal carcinoma, Inhibitor of DNA-binding, metastasis, siRNA
Introduction
Most targeted therapies currently approved by the United States Food and Drug Administration target cell surface receptors or intracellular kinase regulatory proteins, whose expression and/or activation are believed to be critical in tumor growth. Although the clinical results achieved with targeted therapies have been encouraging, overall the benefits are less than anticipated. One potential reason for this limitation observed with targeted therapies is the heterogeneity of cancers themselves; disparate mechanisms may activate similar downstream effectors and lessen the effects of focused targeting strategies. If true, then the ability to identify and effectively target central intercellular regulatory proteins that are essential to these activation pathways, such as transcriptional regulators factors, may prove to be effective therapeutics.
The inhibitor of DNA-bind-2 (Id2) protein belongs to a family of four homologous proteins (Id1-Id4) (Lasorella et al., 2001, 2005). The Id proteins are helix–loop–helix-like transcription factors that lack a DNA-binding basic amino acid domain. The Ids are essential for embryogenesis, and they have been functionally implicated in proliferation, differentiation and cell survival (Jen et al., 1996; Lasorella et al., 2001). The Id proteins are not typically found in most adult tissues. However their reactivated expression, including that of Id2, occurs in some human cancers (pancreatic, neuroblastoma and colon) and may be of prognostic value (Kleeff et al., 1998; Rockman et al., 2001; Wilson et al., 2001; Lasorella et al., 2002; Lofstedt et al., 2004). The Ids are believed to function primarily as dominant-negative regulators, forming non-DNA-binding heterodimers with other basic helix-loop-helix transcription factors (Benezra et al., 1990). Dimerization partners of the Id family encompass members of the Eprotein group (E12, E47 and E2-2), whose downstream targets include the cell cycle inhibitors p21CIP/WAF1, p15INK4B and p16INK4B (Pagliuca et al., 2000; Rothschild et al., 2006). In addition to functioning as a transcriptional repressor, Id2 also binds to retinoblastoma (Rb) tumor suppressor proteins (Iavarone et al., 1994; Lasorella et al., 2000).
In normal cells, Rb mediates cell cycle arrest through the sequestration of the E2F is preferred nomenclature-transcription factors (Weinberg, 1995). This association is controlled through Rb phosphorylation, which is mediated by the G1 cyclin–cyclin-dependent kinase complexes, the functions of which are in turn inhibited by the cell cycle inhibitors p21CIP/WAF1, p27KIP1, and p57KIP2 (Weinberg, 1995). Developmental studies in Rb-null mice have shown that Rb can suppress Id2-mediated activities, including cell proliferation and survival (Iavarone et al., 1994). Although these studies suggest that Rb acts strictly to modulate Id2 activity, additional studies reveal that Id2 can antagonize Rb-mediated repression of E2F target gene transcription. E2F targets constitute the majority of effectors required for cell cycle progression, and loss of E2F sequestration by Rb is generally believed to be a critical step in oncogenesis (Weinberg, 1995; Lasorella et al., 1996).
On the basis of the critical aspects of cellular functions mediated by Id2 and its documented reactivated expression in some human cancers, Id2 has been hypothesized to be a potential therapeutic target (Benezra et al., 2001; Lasorella et al., 2002). The development of new therapeutics, including those that can easily traverse the plasma membrane and target critical intercellular regulators, such as the Id proteins, may lead to greater benefits in terms of patient outcomes.
To better understand the function of Id2 in colorectal cancer (CRC), we used small hairpin RNA (shRNA) to establish stable cell lines with reduced Id2 levels, and found that these cell lines had increased doubling times (that is, reduced proliferation). Examination of cycle regulatory proteins demonstrated knockdown of Id2 levels were accompanied by decreased levels of cyclin D1 and increased levels of the cell cycle inhibitory protein p21. Repression of Id2 protein levels also decreased cell survival. Western analysis showed that increased levels of the pro-apoptotic Bcl-2 family member Bim/Bod accompanied the knockdown of Id2, in addition to enhanced cleavage of the anti-apoptotic proteins caspase- 7 and poly (ADP-ribose) polymerase. In vivo studies in mice further substantiated the critical function of Id2 in CRC progression, as tumors derived from cells with suppressed Id2 levels formed smaller tumors and fewer metastases than those expressing normal levels of Id2. Finally, we established the validity of Id2 as a therapeutic target by showing that intraperitoneal administration of anti-Id2 small interfering RNA (siRNA) incorporated into the neutral liposome 1,2-dioleoyl-sn-glycero-3-phosphatidylcholine (DOPC) in mice significantly decreased CRC tumor burden in the murine liver compared with treatment with a control siRNA–DOPC complex.
Results
Id2 expression in human colon mucosa, primary colon tumors, liver metastases specimens and human CRC cell lines
Given the paucity of published data regarding Id2 expression in human CRC and CRC metastasis, we first evaluated levels of Id2 in paraffin-embedded samples of human primary colon tumors, adjacent normal colonic mucosa and CRC liver metastases by immunoperoxidase staining (Figure 1a). No Id2 was detected in nonmalignant mucosa (0 of 40), but Id2 was expressed in 81 of 194 (42%, P < 0.0001) primary adenocarcinomas and in 47 of 56 liver metastases (84%, P < 0.0001 vs normal mucosa, P < 0.0001 vs primary adenocarcinomas). Id2 protein expression was also detected in all six CRC cell lines assayed (Figure 1b).
Figure 1.

Assessment of Id2 expression in human colon tissues and cell lines. (a) Representative tissue sections of nonmalignant human colonic mucosa, primary colon adenocarcinoma, colon adenocarcinoma and liver metastasis were subjected to immunoperoxidase staining to detect expression of Id2 protein. (b) Western blot analysis of Id2 expression in six colon adenocarcinoma cell lines. Vinculin was used as an internal loading control. Id2, inhibitor of DNA-bind-2.
Id2 expression and proliferation of CRC cells
Id2 has been reported to regulate the proliferation of human tumor cells (Lasorella et al., 2002). To examine the effects of Id2 on proliferation in vitro, we reduced Id2 expression in HCT-116 cells by shRNA targeting. Western analysis of lysates from the siRNA-transfected clones sh-Id2C14 and sh-Id2C15 showed reductions in Id2 of more than 85% compared with controls (parental cells and cells transfected with scrambled sequence (shRNA-control (sh-Con), Figure 1b). This targeting was specific for Id2, as levels of Id1 and Id3 did not change (Id4 protein was not detected) (Figure 2a). Proliferation rates, as determined by 3-(4,5-dimethylthiazol-2-yl)-2,5-diphenyltetrazolium bromide (MTT) were similar in the two controls (doubling time for parental cells, 26.0 ± 1.2 h vs 25.4 ± 1.0 h for sh-Con) but longer for clones with reduced Id2 expression (sh-Id2C14, 36.0 ± 2.7 h; sh-Id2C15, 33 ± 1.3 h) (Figure 2b). Similar results showing an increase in cell doubling time occurring with a reduction of Id2 levels were also obtained with Celltiter-Glo assays (Promega, WI, USA) (data not shown). Next, to see if knockdown of Id2 affected cell cycle regulatory proteins in CRC cells, we used western blotting of cyclin molecules. Only cyclin D1 level (~75% reduction compared to control), and not levels of cyclin D2, D3, A (data not shown) or E (data not shown), was affected by reduction of Id2 expression (Figure 2c). To see if the repression of Id2 levels affected the expression of cell cycle inhibitors in CRC cells, we assessed p15, p16, p21, p27 and p53 by western analysis. Levels of p21 increased twofold (as determined by densitometry) in the Id2-suppressed clones, whereas levels of the other cell cycle regulators were not altered (Figure 2c).
Figure 2.

Effect of Id2 expression on proliferation and cell cycle protein expression in HCT-116 cells. (a) Western blot analysis of Id2 levels in parental (Par) and shRNA-control (sh-Con) cells and two shRNA clones (sh-Id2C14 and sh-Id2C15). (b) MTT analysis of growth rates of control cells (Par and sh-Con) or clones with reduced Id2 expression (sh-Id2C14 and sh-Id2C15). Bars indicate standard error of the mean. (c) Western blot analysis of cell cycle regulatory proteins from control cells (Par and sh-Con) and stable cell lines with reduced Id2 expression (sh-Id2C14 and sh-Id2C15). Vinculin was used as an internal loading control. Id2, inhibitor of DNA-bind-2; MTT, 3-(4,5-dimethylthiazol-2-yl)-2,5-diphenyltetrazolium bromide.
Id2 expression and apoptosis of CRC cells
To determine if the impeded growth of clones with reduced Id2 expression resulted from changes in spontaneous apoptosis, we used fluorescence-activated cell sorting to examine control and shRNA-targeted cells to assess the percentage of sub-G0 cells. Knockdown of Id2 expression in CRC cells resulted in four- to sixfold increases in the apoptotic (sub-G0) populations (mean 12% in sh-Id2C14 cells and 8% in sh-Id2C15 cells) compared with those of the controls (1.5% in parental cells and 2% in sh-Con cells, Figure 3a). Western analysis was utilized to determine if the observed increase in apoptosis resulted from changes in expression of apoptotic regulatory proteins. Examination of the Bcl-2 family members (Bcl-2, Bcl-xl, Bad, Bax and Bim/Bod) showed that only levels of the proapoptotic Bcl-2 family member Bim/Bod increased by twofold in response to reduction of Id2 expression in HCT-116 cells (Figure 3b). Further examination of the apoptotic regulatory proteins caspase-7 and caspase-9 reveled that although the caspase-9 protein remained uncleaved, caspase-7 underwent a threefold increase in cleavage owing to knockdown of Id2 as did the downstream caspase-7 target poly (ADP-ribose) polymerase (Figure 3c).
Figure 3.

Effect of Id2 expression on apoptosis in HCT-116 cells. (a) Graphical representation of proportions of apoptotic control cells (Parental (Par) and scrambled-siRNA control (sh-Con)) and stable cell lines with reduced Id2 expression (sh-Id2C14 and sh-Id2C15) as determined by fluorescence-activated cell sorting analysis. (b) Western analysis of Bcl-2 family members Bim/Bod, Bcl-2, Bcl-xl, Bad and Bax from control cells (Par and sh-Con) and stable cell lines with reduced Id2 expression (sh-Id2C14 and sh-Id2C15). Vinculin levels were probed to ensure equal loading of all samples. (c) Western analysis of caspase-7/caspase-9 and PARP from control cells (Par and sh-Con) and stable cell lines with reduced Id2 expression (sh-Id2C14 and sh-Id2C15). Vinculin levels were probed to ensure equal loading of all samples. Id2, inhibitor of DNA-bind-2; PARP, poly (ADP-ribose) polymerase.
Knockdown of Id2 expression and tumor growth in vivo
To understand the effect of Id2 on the growth of CRC cells in vivo, we injected nude mice subcutaneously with sh-Con or shRNA-targeted clones with reduced Id2 levels and assessed the resulting tumors. Tumors from cells deficient in Id2 expression were significantly smaller than those from cells with normal Id2 levels (451 ± 97mm3 for sh-Con vs 161 ± 59mm3 for sh-Id2C14 (P = 0.03) and 192 ± 62mm3 for sh-Id2C15 (P = 0.017)) (Figure 4a). To ascertain the effect of Id2 expression on hepatic metastasis of CRC cells, cells of each clone were injected into the spleen of nude mice and the resulting liver metastases were assayed. Cells with reduced Id2 expression produced fewer detectable metastases than did cells with normal Id2 levels (mean 7 ± 2 hepatic metastases for sh-Con vs 2 ± 1 for sh-Id2C14 (P = 0.022) or 3 ± 2 for sh-Id2C15 (P = 0.045)) (Figure 4b). The mean volumes of the metastases were smaller for the reduced-Id2 clones than for the siRNA control cells (mean 286 ± 43mm3 for sh-Con vs 55 ± 15mm3 for sh-Id2C14 (P = 0.015) or 57 ± 24mm3 for sh-Id2C15 (P = 0.02) (Figure 4c).
Figure 4.
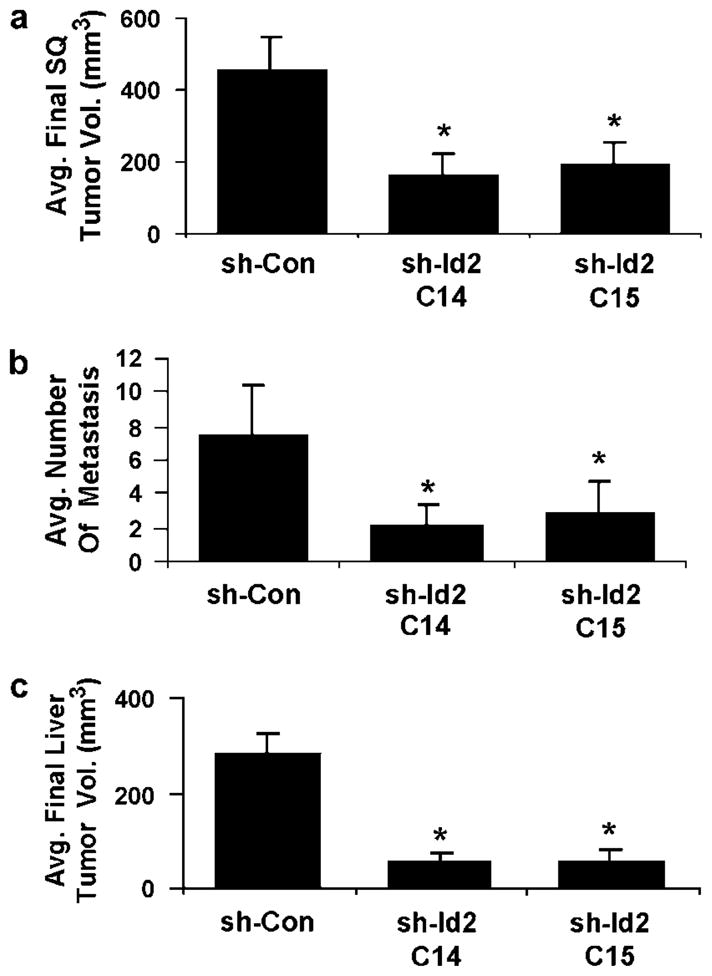
Effect of Id2 expression on the growth and metastasis of HCT-116 colon cancer cells in vivo. (a) Mean tumor volumes after subcutaneous injection of control (shRNA-control (sh-Con)) cells or clones with reduced Id2 expression. Bars indicate standard error of the mean for 10 mice. Volumes of both siRNA clones were different from the sh-Con control (P = 0.03 for sh-IdC14 and P = 0.017 for sh-Id2C15). (b) Average numbers of liver metastases after splenic injection of control (sh-Con) cells or clones with reduced Id2 expression. Bars indicate standard error of the mean for 10 mice. Both clones produced fewer metastases than did control cells (P = 0.022 for sh-Id2C14 and P = 0.045 for sh- Id2C15). (c) Mean volumes of metastases from control cells (sh-Con) and clones with reduced Id2 expression. Total volume is the sum of individual metastases in each liver. Data are means ± s.e.m. from 10 mice. Both clones produced lower volume metastases than did control cells (P ≤0.02). Id2, inhibitor of DNA-bind-2; siRNA, small interfering RNA.
Targeting Id2 in vivo and colon cancer progression
On the basis of reduced tumor growth with Id2 silencing, we next asked whether a relevant therapeutic treatment approach could be utilized. We used Id2 siRNA sequences incorporated into the neutral lipo-some DOPC, shown earlier to efficiently reduce in vivo gene expression (Landen et al., 2005). Bioluminescence imaging of tumor cell growth in nude mice showed that siRNA to Id2 impaired the growth kinetics of HCT-116 CRC cells compared with those of control cells at 30 days after hepatic inoculation (mean activity 1.8 × 10⁶ photons for control vs 2.8 × 10⁵ photons for Id2 siRNA–DOPC) (Figure 4a). At the termination of the experiment, the hepatic tumor burden in the control group (control Sh-DOPC) was much greater than in the siRNA-Id2 mice (mean 932 ± 112mm3 for control siRNA–DOPC vs 377 ± 100mm3 for Id2 siRNA–DOPC (P = 0.006, Wilcoxon rank-sum test)) (Figures 5b and c). Cellular proliferation in the excised tumor samples (assessed by immunohistochemical staining for proliferating cell nuclear antigen) was reduced in the Id2-targeted group compared with those in the control group (P = 0.02) (Figure 6a). TdT-mediated UTP nickend labeling staining showed that CRC cells growing in the liver of mice treated with siRNA to Id2 had four times more apoptotic cells (P = 0.002) than did tumors treated with control siRNA (control Sh-DOPC) (Figure 6b). Finally, Id2 expression in hepatic tumors was shown by immunohistochemistry (data not shown) and western analysis to be substantially reduced in the Id2-siRNA-treated group compared with controls (Figure 6c).
Figure 5.

Effect of in vivo administration of liposomal-conjugated siRNA to Id2 on CRC tumor growth in the liver. (a) Graphical plot of proton activity from bioluminescence imaging of mice inoculated with 1.0 × 10⁶ HCT-116 cells and imaged at 3, 14 and 28 days after hepatic injection while being treated at 3-day intervals with either control (control siRNA–DOPC) or Id2-specific siRNA (Id2 siRNA– DOPC). (b) Mean tumor volumes at 32 days after inoculation, with continuous intraperitoneal injections every 3 days of control (control siRNA–DOPC) or Id2–specific siRNA (Id2 siRNA–DOPC) (10 mice per group). *P = 0.0045 vs control siRNA. (c) Photographs of excised livers from mice treated with either nonspecific or Id2-targeted siRNA. Id2, inhibitor of DNA-bind-2; siRNA, small interfering RNA; CRC, colorectal cancer; DOPC, 1,2-dioleoyl-sn-glycero-3-phosphatidylcholine.
Figure 6.

Effect of in vivo administration of liposomal-conjugated siRNA to Id2 on CRC tumor growth in the liver. (a) Graphical plot of immunohistochemistry (IHC) staining for proliferating cell nuclear antigen (PCNA) in tumor sections from samples in Figure 5c. Treatment groups; control liposome (control siRNA–DOPC) and Id2-targeted liposome (Id2 siRNA–DOPC). *P = 0.02 between treatment groups. (b) Graphical representation of ‘fold’ change in TUNEL-positive cells (apoptotic cells) in tumor sections from control-siRNA- and Id2-siRNA-treated mice observed in five fields at ×20. Average *P = 0.002 between treatment groups. (c) Western analysis of tumor homogenates for Id2 expression in liposomal treatment groups from Figure 5c; control liposome (control siRNA–DOPC) and Id2-targeted liposome (Id2 siRNA–DOPC). Id2, inhibitor of DNA-bind-2; siRNA, small interfering RNA; DOPC, 1,2-dioleoyl-sn-glycero-3-phosphatidylcholine; TUNEL, TdT-mediated UTP nick-end labeling.
Discussion
Earlier studies have documented that members of the Id family of proteins are expressed in solid tumors, yet their function and therapeutic value, especially in human CRC, remains largely unknown (Kleeff et al., 1998; Rockman et al., 2001; Wilson et al., 2001; Lasorella et al., 2002; Lofstedt et al., 2004). The experiments described in this study demonstrate that Id2 represents a potential target in cancers where its expression occurs, and is critical for the growth of CRC cells. Id2 was not expressed in normal human colonic tissue. However, Id2 expression was present in greater than 40% of primary colon tumors and in almost all liver metastases studied, suggesting that Id2 may be a contributing factor for CRC metastasis. This observation is of particular clinical interest as the most common site of metastasis is the liver, and hepatic tumor burden is the most common cause of death in patients with metastatic CRC. These results, contrary to Id2 germline analysis where Id2 suppressed tumor formation (Russell et al., 2004), suggesting that Id2 may have opposing functions in developmental and oncogenic tissues. Similar functions have also been described for other Rb regulatory proteins including E2F (Weinberg, 1996). This dichotomy may be dependent upon the availability of additional co-regulators that direct Id2 function. Id2 was also expressed in all six of the human CRC cell lines assayed, and reduction of Id2 levels in CRC cells by siRNA decreased proliferation rates and increased spontaneous apoptosis. Further, our in vivo models showed that knockdown of Id2 expression, through either the creation of stable Id2-deficient clones or the systemic administration of siRNA to Id2, severely impaired the ability of CRC cells to grow in the liver, the major site of CRC metastasis.
Consistent with findings in other oncogenic tissues, reduction of Id2 levels in CRC cells with siRNA decreased proliferation rates (Lasorella et al., 1996, 2002). Earlier reports indicated that Id2 interferes with E2 transcription (Pagliuca et al., 2000; Rothschild et al., 2006) and Rb sequestration of E2F (Iavarone et al., 1994; Lasorella et al., 2000), both critical cell cycle regulators. Our examination of cell regulatory proteins revealed that reduction of Id2 levels in CRC cells downregulated cyclin D1 levels. These findings are contrary to those of an earlier study in which ectopic overexpression of Id2 in an Rb mutant osteosarcoma cell line decreased cyclin D1 levels (Lasorella et al., 1996). In cells with functional Rb, such as HCT-116 cells (Broude et al., 2007), cyclin D1 is required for cell cycle progression (Lukas et al., 1995). The ability of Id2 expression to modulate cyclin D1 may depend on the presence of functional Rb and its coordination of cell cycle progression. We also showed that knockdown of Id2 increased levels of the cell cycle inhibitor p21 in the absence of changes in p53 levels (Lasorella et al., 1996). Expression of p21 can be upregulated by members of the E2 family (Lasorella et al., 1996; Prabhu et al., 1997), which are antagonized by Id heterodimerization. Thus, decreasing Id2 levels could enhance E2 homodimerization, leading to upregulation of p21 in CRC cells. To further examine the relationship between Id2 and E2 gene regulation, we assessed levels of the E2 target gene Axin2 (Hughes and Brady, 2005). Levels of Axin2 remained unchanged in HCT-116 cells regardless of Id2 levels (data not shown). This may suggest that other members of the Id family, whose levels remain unchanged in our Id2-siRNA-targeted cells, can regulate other aspects of E2 gene control.
In addition to its effect on cellular proliferation, we also showed that reduction of endogenous Id2 levels increased spontaneous apoptosis in CRC cells. This increase seems to be independent of p53, which remained unchanged in our Id2-deficient CRC cells (data not shown). Similar findings attributing anti-apoptotic functions to Id2 have been reported for T cells (Cannarile et al., 2006) and prostate cancer, in which this effect was also independent of p53 (Asirvatham et al., 2007). Examination of apoptotic regulatory proteins showed that reduction of Id2 resulted in increased levels of Bim/Bod, which antagonizes the survival functions promoted by Bcl-2 and its homolog Bcl-xl (Hsu et al., 1998; O’Connor et al., 1998). Our data suggests that Id2 represses Bim/Bod expression. The ability of Id2 to downregulate Bim/Bod levels may have a function in promoting colon cancer cell survival (Hsu et al., 1998). Additionally, in our study the knockdown of Id2 expression increased cleavage of caspase-7. Although activation of this apoptotic pathway has not previously been linked to Id2 expression, loss of Id1 expression has been shown to increase poly (ADP-ribose) polymerase cleavage (Zhang et al., 2007), itself a marker of apoptosis (Oliver et al., 1998), suggesting that the Id proteins may function in promoting cell survival.
We also showed the importance of Id2 in CRC growth through the use of stable transfectants with reduced Id2 expression and by targeting Id2 in vivo using liposomal-conjugated siRNA. Tumors arising from the stable cell lines lacking Id2 demonstrated reduced growth and tumorgenicity in both subcutaneous and in orthotopic (liver metastases) models. Tumors that did grow at either site were smaller than tumors derived from cells with normal Id2 levels. Similar results were achieved by targeting human CRC cells implanted in the livers of mice in vivo with liposome-conjugated siRNA to Id2. Although the siRNA–DOPC complex is not specific for the human cancer cells implanted in the murine liver, we sought to determine if siRNA to Id2 had any effect on the mouse homolog of Id2. A Basic Local Alignment Search Tool (BLAST) homology search was performed and found that the regions targeted by the human siRNA utilized in our studies demonstrated no homology with the concomitant murine sequence; in addition, transient transfection with the human specific siRNAs did not reduce endogenous Id2 expression in a murine hepatic endothelial cell line (Langley et al., 2003; data not shown). These findings suggest that Id2 liposomal siRNA designed to inhibit human Id2 in vivo had no effect on murine Id2; thus we believe that the observed changes in tumor growth were mediated exclusively by blocking the Id2 expressed by the tumor cells.
In summary, our study here demonstrates that Id2 is an important mediator in CRC growth and metastasis, and a promising therapeutic target in tumors where its expression occurs. Our results indicate that Id2 enhanced cell proliferation, survival and in vivo tumor growth, all critical aspects of CRC progression. The use of anti-Id2 therapeutic targeting may improve existing targeted treatments and provides a unique opportunity to circumvent the ability of Id2-expressing tumors, such as CRC, to grow and metastasize.
Materials and methods
Human tissue specimens
Formalin-fixed, paraffin-embedded specimens of colon adenocarcinoma, adjacent non-malignant colonic mucosa and colon cancer liver metastases were obtained from an established tissue bank through a protocol approved by the institutional review board of The University of Texas MD Anderson Cancer Center, Houston, TX, USA. Histopathologic confirmation was provided by the MD Anderson Cancer Center’s Department of Pathology.
Histopathologic preparation and immunohistochemical staining of tissue specimens
Patient tissue specimens were analyzed with an anti-Id2 antibody (C-20, Santa Cruz Biotechnology, Santa Cruz, CA, USA) as described earlier (Parikh et al., 2004). Tumor xenografts from mice (generated as described below) were fixed in 10% neutral formalin (for paraffin embedding) or optimum cutting temperature solution (Miles, Elkhart, IN, USA). Immunostaining was done using standard procedures as described elsewhere (Camp et al., 2006; Yang et al., 2006). Staining for the endothelial cell-specific marker CD31 was performed with anti-mouse CD31 (PECAM-1) antibody (BD Biosciences, Franklin Lakes, NJ, USA) and goat anti-mouse Alexa-594 conjugated antibody (Molecular Probes, Eugene, OR, USA). Apoptotic cells were detected with a TdT-mediated UTP nick-end labeling Dead-End labeling kit (Promega, Madison, WI, USA) according to the manufacturer’s protocol. Image analysis of the immunohistochemical stains was done with NIH Image J 1.34 software. All analyses represent an average of a minimum of five randomly selected fields per specimen.
Cell lines and culture conditions
The human CRC cell lines Geo, HCT-116, HT-29, RKO and SW-480 were obtained from the American Type Culture Collection (Manassas, VA, USA); KM12 cells were obtained from IJ Fidler (MD Anderson Cancer Center). All cells were maintained in complete minimum essential medium supplemented with 10% fetal bovine serum, 2mm l-glutamine, penicillin and streptomycin (Life Technologies, Grand Island, NY, USA).
Preparation of shRNA expression plasmids and siRNA cell lines
Small interfering RNA plasmids were created with pSilencer 4.0. (Ambion, Austin, TX, USA). The target sequences for Id2, 5′-gcggtgttcatgatttctt-3′ and 5′-caaagcactgtgtgtgggctga-3′ (Invitrogen/Life Technologies), were ligated into the expression plasmid. HCT-116 cells were transfected with 0.5 ng of each siRNA plasmid and grown in selective medium containing 700 μg/ml hygromycin B (Roche Diagnostics, Mannheim, Germany). Negative controls were scrambled Id2 target sequences with no significant homology to other vertebrate genes.
Immunoprecipitation and western analysis
Cells were solubilized in 20mm Tris-Cl (pH 8.0), 137mm NaCl, 1% Triton X-100, 1mm Na3VO4 and 2mm ethylene-diaminetetraacetic acid with protease inhibitor (Roche Diagnostics). Cell lysates were separated on 8% sodium dodecyl sulfate polyacrylamide gels and transferred to polyvinylidene difluoride membranes (Amersham, Arlington Heights, IL, USA). Membranes were probed with antibodies against Id2, Id1, Id3 (Santa Cruz Biotechnology), vinculin (Serotec, Raleigh, NC, USA), cyclin D1, cyclin D2, cyclin D3, cyclin A, cyclin E, p21, p27, p16, p53, Bcl-2, Bcl-xl, Bad, Bax, Bim/Bod, poly (ADP-ribose) polymerase, caspase-9 and caspase-7 (all from Cell Signaling Technology, Danvers, MA, USA). After incubation with the appropriate antibodies, immunostained proteins were detected by chemiluminescence (New England Nuclear, Boston, MA, USA). For western analysis of in vivo tumor sections, tumors were emulsified in protein lysis buffer as described above.
MTT analysis of cell proliferation
In vitro proliferation was assessed with tetrazolium salt MTT as described earlier (Gray et al., 2005). Briefly, 2000 cells of each clone were plated per well onto 96-well microtiter plates in minimum essential medium with 10% fetal bovine serum. One plate was developed immediately after cells had adhered (at approximately 4 h), and other plates were developed every 24 h for 4 days. Assays were done by incubating each plate with 20 μl of MTT substrate for 2 h followed by removal of medium and addition of 200 μl of dimethylsulfoxide. Plates were read at a wavelength of 570 nm.
Flow cytometry and cell cycle analysis
Each clone was grown to 85–90% confluence in Eagle’s minimum essential medium supplemented with 2mm l-glutamine, 12.5% fetal bovine serum, 100 U/ml penicillin and 100 ng/ml streptomycin). Cells were trypsinized, washed in phosphate-buffered saline and fixed in 70% ethanol at 4 °C for 2 h. DNA was stained with propidium iodide (10 mg/ml of phosphate-buffered saline) and DNase-free RNase (Roche Diagnostics) (2.5 μg/ml of phosphate-buffered saline) for at least 30 min before cells were subjected to flow cytometry in a Coulter EPICS XL (Beckman Coulter, Fullerton, CA, USA). Cell cycle profiles were generated by MultiCycle software (Phoenix Flow Systems, San Diego, CA, USA).
In vivo tumor growth and siRNA targeting
Six- to eight-week-old male athymic nude mice were purchased from the National Cancer Institute-Frederick Cancer Research Facility (Frederick, MD, USA) and maintained under specific pathogen-free conditions. All animal experiments met the requirements of MD Anderson’s Animal Care Facility and the National Institutes of Health guidelines on animal care and use. Each HCT-116 clone was prepared and inoculated into 10 mice as described elsewhere (Gray et al., 2005). For studies involving stable cell lines, 5.0 × 10⁵ viable sh-Con, sh-Id2C14 or sh-Id2C15 cells were injected in 0.1 ml of Hanks balanced salt solution either subcutaneously into the right rear flank, liver or spleen (for metastasis studies) of each nude mouse. For the in vivo siRNA delivery experiments, 1.0 × 10⁶ HCT-116 cells expressing the lenti-Luc reporter gene (Arumugam et al., 2006) were suspended in 0.1 ml of Hanks balanced salt solution and inoculated into the liver of each mouse. After 4 days, controlor Id2-liposomal–siRNA (3 μg) complexes were given as a 200 μl intraperitoneal bolus with identical treatment given every 3 days thereafter. After 32 days, mice were sacrificed (CO2 inhalation) and total body weight, liver weight and tumor volume were calculated. Tumor volume was calculated as ((length/2) × (width2)) ± s.e.m. For metastasis studies, tumor volume was determined as the sum of the individual metastatic foci in each liver. Tissue specimens from each treatment group were snap-frozen, fixed in formalin or frozen in optimum cutting temperature solution.
Bioluminescence imaging
Bioluminescence imaging was done as described earlier (Arumugam et al., 2006) by using a cryogenically cooled IVIS 100 imaging system coupled to a data-acquisition personal computer equipped with Living Image software (Xenogen, Hopkinton, MA, USA). For in vivo studies, before each imaging session, mice were anesthetized with isoflurane and injected intraperitoneally with 15 mg/ml of luciferase potassium salt (Sigma-Aldrich, St Louis, MO, USA) in phosphate-buffered saline at a dose of 150 mg/kg body weight. Initial images were obtained to establish baseline tumor volume/proton activity at 3 days after the hepatic inoculation of tumor cells (to allow tumor establishment), and additional images were obtained at 14 and 28 days after inoculation.
Preparation of liposomal siRNA
All Id2 and Id2 control sequences used for the in vivo experiments were purchased from Ambion (Landen et al., 2005). Briefly, DOPC and siRNA (a control Id2-scrambled sequence or an Id2-specific sequence as described above) were mixed and lyophilized. The siRNA–liposome complexes were purified by separating the free siRNA from the liposomes by using 30 000 nominal molecular weight limit filter units (Millipore, Billerica, MA, USA). The lyophilized preparations were hydrated in 0.9% saline at a concentration of 5 μg/200 μl before being administered in vivo.
Quantitation of autoradiograms
Autoradiographs were quantified in the linear range of the film by scanning the image using a Hewlett Packard Scanjet scanner and quantitated with Scion Image software program. Each sample measured was calculated as the ratio of the average area over the average area of actin or vinculin for immunoblots or as the ratio above the average area of basal/control levels of the protein of interest in immunoprecipitations.
Statistical analyses
Statistical analyses were performed with InStat 2.01. software (GraphPad Software, San Diego, CA, USA), with Student’s t-tests or Fisher’s exact tests as appropriate. Significance (P < 0.05) was determined with 95% confidence intervals.
Acknowledgments
We thank Rita Hernandez (Department of Surgical Oncology) and Christine Wogan (Department of Scientific Publications) for manuscript editing and preparation. Supported by NIH-5 T32 CA09599 (GVB, NAD, ADY and PG), Program Project Development Grant from the Ovarian Cancer Research Fund, Inc. (AKS), the Zarrow Foundation (AKS) and William C Liedtke, Jr Chair in Cancer Research (LME).
Abbreviations
- CRC
colorectal carcinoma
- Id2
inhibitor of DNA-bind-2
- Rb
Retinoblastoma protein
- shRNA
short hairpin RNA
- siRNA
small interfering RNA
References
- Arumugam T, Ramachandran V, Logsdon CD. Effect of cromolyn on S100P interactions with RAGE and pancreatic cancer growth and invasion in mouse models. J Natl Cancer Inst. 2006;98:1806–1818. doi: 10.1093/jnci/djj498. [DOI] [PMC free article] [PubMed] [Google Scholar]
- Asirvatham AJ, Carey JP, Chaudhary J. ID1-, ID2-, and ID3-regulated gene expression in E2A positive or negative prostate cancer cells. Prostate. 2007;67:1411–1420. doi: 10.1002/pros.20633. [DOI] [PubMed] [Google Scholar]
- Benezra R, Davis RL, Lockshon D, Turner DL, Weintraub H. The protein Id: a negative regulator of helix-loop-helix DNA binding proteins. Cell. 1990;61:49–59. doi: 10.1016/0092-8674(90)90214-y. [DOI] [PubMed] [Google Scholar]
- Benezra R, Rafii S, Lyden D. The Id proteins and angiogenesis. Oncogene. 2001;20:8334–8341. doi: 10.1038/sj.onc.1205160. [DOI] [PubMed] [Google Scholar]
- Broude EV, Swift ME, Vivo C, Chang BD, Davis BM, Kalurupalle S, et al. p21(Waf1/Cip1/Sdi1) mediates retinoblastoma protein degradation. Oncogene. 2007;26:6954–6958. doi: 10.1038/sj.onc.1210516. [DOI] [PubMed] [Google Scholar]
- Camp ER, Yang A, Liu W, Fan F, Somcio R, Hicklin DJ, et al. Roles of nitric oxide synthase inhibition and vascular endothelial growth factor receptor-2 inhibition on vascular morphology and function in an in vivo model of pancreatic cancer. Clin Cancer Res. 2006;12:2628–2633. doi: 10.1158/1078-0432.CCR-05-2257. [DOI] [PubMed] [Google Scholar]
- Cannarile MA, Lind NA, Rivera R, Sheridan AD, Camfield KA, Wu BB, et al. Transcriptional regulator Id2 mediates CD8+ T cell immunity. Nat Immunol. 2006;7:1317–1325. doi: 10.1038/ni1403. [DOI] [PubMed] [Google Scholar]
- Gray MJ, Wey JS, Belcheva A, McCarty MF, Trevino JG, Evans DB, et al. Neuropilin-1 suppresses tumorigenic properties in a human pancreatic adenocarcinoma cell line lacking neuropilin-1 coreceptors. Cancer Res. 2005;65:3664–3670. doi: 10.1158/0008-5472.CAN-04-2229. [DOI] [PubMed] [Google Scholar]
- Hsu SY, Lin P, Hsueh AJ. BOD (Bcl-2-related ovarian death gene) is an ovarian BH3 domain-containing proapoptotic Bcl-2 protein capable of dimerization with diverse antiapoptotic Bcl-2 members. Mol Endocrinol. 1998;12:1432–1440. doi: 10.1210/mend.12.9.0166. [DOI] [PubMed] [Google Scholar]
- Hughes TA, Brady HJ. E2F1 up-regulates the expression of the tumour suppressor axin2 both by activation of transcription and by mRNA stabilisation. Biochem Biophys Res Commun. 2005;329:1267–1274. doi: 10.1016/j.bbrc.2005.02.102. [DOI] [PubMed] [Google Scholar]
- Iavarone A, Garg P, Lasorella A, Hsu J, Israel MA. The helix-loop-helix protein Id-2 enhances cell proliferation and binds to the retinoblastoma protein. Genes Dev. 1994;8:1270–1284. doi: 10.1101/gad.8.11.1270. [DOI] [PubMed] [Google Scholar]
- Jen Y, Manova K, Benezra R. Expression patterns of Id1, Id2, and Id3 are highly related but distinct from that of Id4 during mouse embryogenesis. Dev Dyn. 1996;207:235–252. doi: 10.1002/(SICI)1097-0177(199611)207:3<235::AID-AJA1>3.0.CO;2-I. [DOI] [PubMed] [Google Scholar]
- Kleeff J, Ishiwata T, Friess H, Buchler MW, Israel MA, Korc M. The helix-loop-helix protein Id2 is overexpressed in human pancreatic cancer. Cancer Res. 1998;58:3769–3772. [PubMed] [Google Scholar]
- Landen CN, Jr, Chavez-Reyes A, Bucana C, Schmandt R, Deavers MT, Lopez-Berestein G, et al. Therapeutic EphA2 gene targeting in vivo using neutral liposomal small interfering RNA delivery. Cancer Res. 2005;65:6910–6918. doi: 10.1158/0008-5472.CAN-05-0530. [DOI] [PubMed] [Google Scholar]
- Langley RR, Ramirez KM, Tsan RZ, Van Arsdall M, Nilsson MB, Fidler IJ. Tissue-specific microvascular endothelial cell lines from H-2K(b)-tsA58 mice for studies of angiogenesis and metastasis. Cancer Res. 2003;63:2971–2976. [PubMed] [Google Scholar]
- Lasorella A, Boldrini R, Dominici C, Donfrancesco A, Yokota Y, Inserra A, et al. Id2 is critical for cellular proliferation and is the oncogenic effector of N-myc in human neuroblastoma. Cancer Res. 2002;62:301–306. [PubMed] [Google Scholar]
- Lasorella A, Iavarone A, Israel MA. Id2 specifically alters regulation of the cell cycle by tumor suppressor proteins. Mol Cell Biol. 1996;16:2570–2578. doi: 10.1128/mcb.16.6.2570. [DOI] [PMC free article] [PubMed] [Google Scholar]
- Lasorella A, Noseda M, Beyna M, Yokota Y, Iavarone A. Id2 is a retinoblastoma protein target and mediates signalling by Myc oncoproteins. Nature. 2000;407:592–598. doi: 10.1038/35036504. [DOI] [PubMed] [Google Scholar]
- Lasorella A, Rothschild G, Yokota Y, Russell RG, Iavarone A. Id2 mediates tumor initiation, proliferation, and angiogenesis in rb mutant mice. Mol Cell Biol. 2005;25:3563–3574. doi: 10.1128/MCB.25.9.3563-3574.2005. [DOI] [PMC free article] [PubMed] [Google Scholar]
- Lasorella A, Uo T, Iavarone A. Id proteins at the cross-road of development and cancer. Oncogene. 2001;20:8326–8333. doi: 10.1038/sj.onc.1205093. [DOI] [PubMed] [Google Scholar]
- Lofstedt T, Jogi A, Sigvardsson M, Gradin K, Poellinger L, Pahlman S, et al. Induction of ID2 expression by hypoxia-inducible factor-1: a role in dedifferentiation of hypoxic neuroblastoma cells. J Biol Chem. 2004;279:39223–39231. doi: 10.1074/jbc.M402904200. [DOI] [PubMed] [Google Scholar]
- Lukas J, Bartkova J, Rohde M, Strauss M, Bartek J. Cyclin D1 is dispensable for G1 control in retinoblastoma gene-deficient cells independently of cdk4 activity. Mol Cell Biol. 1995;15:2600–2611. doi: 10.1128/mcb.15.5.2600. [DOI] [PMC free article] [PubMed] [Google Scholar]
- O’Connor L, Strasser A, O’Reilly LA, Hausmann G, Adams JM, Cory S, et al. Bim: a novel member of the Bcl-2 family that promotes apoptosis. Embo J. 1998;17:384–395. doi: 10.1093/emboj/17.2.384. [DOI] [PMC free article] [PubMed] [Google Scholar]
- Oliver FJ, de la Rubia G, Rolli V, Ruiz-Ruiz MC, de Murcia G, Murcia JM. Importance of poly(ADP-ribose) polymerase and its cleavage in apoptosis. Lesson from an uncleavable mutant. J Biol Chem. 1998;273:33533–33539. doi: 10.1074/jbc.273.50.33533. [DOI] [PubMed] [Google Scholar]
- Pagliuca A, Gallo P, De Luca P, Lania L. Class A helix-loop-helix proteins are positive regulators of several cyclin-dependent kinase inhibitors’ promoter activity and negatively affect cell growth. Cancer Res. 2000;60:1376–1382. [PubMed] [Google Scholar]
- Parikh AA, Fan F, Liu WB, Ahmad SA, Stoeltzing O, Reinmuth N, et al. Neuropilin-1 in human colon cancer: expression, regulation, and role in induction of angiogenesis. Am J Pathol. 2004;164:2139–2151. doi: 10.1016/S0002-9440(10)63772-8. [DOI] [PMC free article] [PubMed] [Google Scholar]
- Prabhu S, Ignatova A, Park ST, Sun XH. Regulation of the expression of cyclin-dependent kinase inhibitor p21 by E2A and Id proteins. Mol Cell Biol. 1997;17:5888–5896. doi: 10.1128/mcb.17.10.5888. [DOI] [PMC free article] [PubMed] [Google Scholar]
- Rockman SP, Currie SA, Ciavarella M, Vincan E, Dow C, Thomas RJ, et al. Id2 is a target of the beta-catenin/T cell factor pathway in colon carcinoma. J Biol Chem. 2001;276:45113–45119. doi: 10.1074/jbc.M107742200. [DOI] [PubMed] [Google Scholar]
- Rothschild G, Zhao X, Iavarone A, Lasorella A. EProteins and Id2 converge on p57Kip2 to regulate cell cycle in neural cells. Mol Cell Biol. 2006;26:4351–4361. doi: 10.1128/MCB.01743-05. [DOI] [PMC free article] [PubMed] [Google Scholar]
- Russell RG, Lasorella A, Dettin LE, Iavarone A. Id2 drives differentiation and suppresses tumor formation in the intestinal epithelium. Cancer Res. 2004;64:7220–7225. doi: 10.1158/0008-5472.CAN-04-2095. [DOI] [PubMed] [Google Scholar]
- Weinberg RA. The retinoblastoma protein and cell cycle control. Cell. 1995;81:323–330. doi: 10.1016/0092-8674(95)90385-2. [DOI] [PubMed] [Google Scholar]
- Weinberg RA. E2F and cell proliferation: a world turned upside down. Cell. 1996;85:457–459. doi: 10.1016/s0092-8674(00)81244-1. [DOI] [PubMed] [Google Scholar]
- Wilson JW, Deed RW, Inoue T, Balzi M, Becciolini A, Faraoni P, et al. Expression of Id helix-loop-helix proteins in colorectal adenocarcinoma correlates with p53 expression and mitotic index. Cancer Res. 2001;61:8803–8810. [PubMed] [Google Scholar]
- Yang AD, Fan F, Camp ER, van Buren G, Liu W, Somcio R, et al. Chronic oxaliplatin resistance induces epithelial-to-mesenchymal transition in colorectal cancer cell lines. Clin Cancer Res. 2006;12:4147–4153. doi: 10.1158/1078-0432.CCR-06-0038. [DOI] [PubMed] [Google Scholar]
- Zhang X, Ling MT, Wong YC, Wang X. Evidence of a novel antiapoptotic factor: role of inhibitor of differentiation or DNA binding (Id-1) in anticancer drug-induced apoptosis. Cancer Sci. 2007;98:308–314. doi: 10.1111/j.1349-7006.2007.00400.x. [DOI] [PMC free article] [PubMed] [Google Scholar]