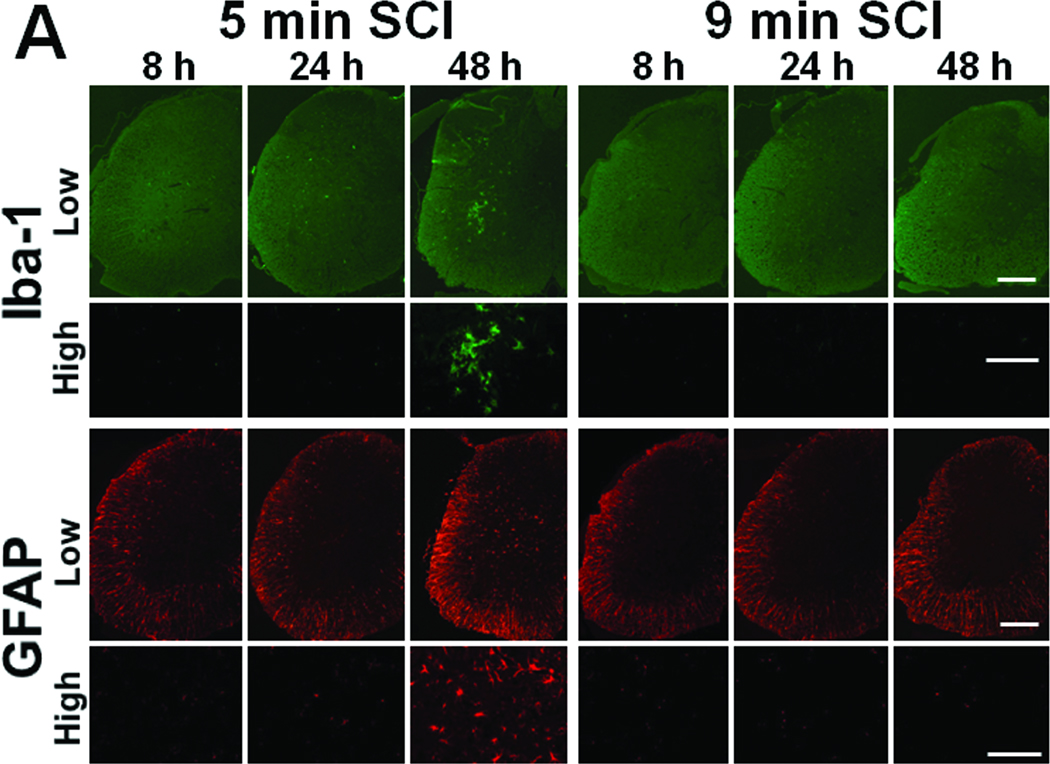
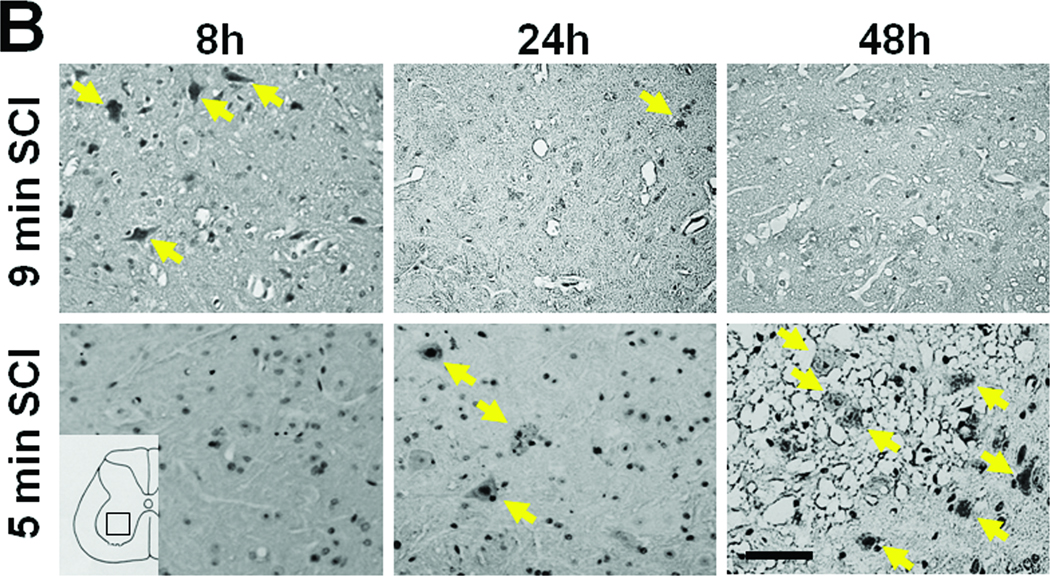
Figure 4.
(A) Representative photomicrographs of the lumber spinal cord sections of mice subjected to 9 or 5 min SCI showing Iba-1 or GFAP-immunoreactive cells at 8, 24, or 48h after reperfusion. Size bar = 100 µm for low and 200 µm for high magnification pictures. (B) Representative photomicrographs of the ventral horn of the lumber spinal cord sections of mice subjected to 9 or 5 min SCI showing cleaved caspase-3-immunoreactive neurons. Yellow arrows indicate cleaved caspase3-immunoreactive neurons. Size bar = 100 µm.


