Abstract
Promising recent investigations have shown that breast malignancies exhibit restricted diffusion on diffusion-weighted imaging (DWI) and may be distinguished from normal tissue and benign lesions in the breast based on differences in apparent diffusion coefficient (ADC) values. In this study, we assessed the influence of intravoxel fat signal on breast diffusion measures by comparing ADC values obtained using a diffusion-weighted single shot fast spin echo sequence with and without fat suppression. The influence of breast density on ADC measures was also evaluated. ADC values were calculated for both tumor and normal fibroglandular tissue in a group of twenty-one women with diagnosed breast cancer. There were systematic underestimations of ADC for both tumor and normal breast tissue due to intravoxel contribution from fat signal on non-fat-suppressed DWI. This ADC underestimation was more pronounced for normal tissue values (mean difference = 40%) than for tumors (mean difference = 27%, p<0.001) and was worse in women with low breast tissue density versus those with extremely dense breasts (p<0.05 for both tumor and normal tissue). Tumor conspicuity measured by contrast-to-noise ratio was significantly higher on ADC maps created with fat suppression and was not significantly associated with breast density. In summary, robust fat suppression is important for accurate breast ADC measures and optimal lesion conspicuity on DWI.
Keywords: breast cancer, diffusion-weighted MRI (DWI), apparent diffusion coefficient (ADC), fat suppression, breast density
INTRODUCTION
Magnetic resonance imaging (MRI) is proving to be valuable for the detection and treatment monitoring of breast cancer. Breast MR examinations typically involve contrast-enhanced techniques, which demonstrate tissue vascularity. Diffusion-weighted imaging (DWI) is an MRI technique that can provide unique information about the biophysical properties of tissue. DWI measures the apparent diffusion coefficient (ADC) of water in tissue, which is sensitive to such parameters as cell organization, cell density, microstructure, and microcirculation [1]. In combination with current contrast-enhanced methods, diffusion-weighted MRI may improve the diagnosis and characterization of breast disease.
Diffusion-weighted MRI of the breast has recently shown promise for improving breast cancer diagnostics [2–5] and for monitoring treatment response to neoadjuvant chemotherapy [6–8]. In general, malignant tumors demonstrate reduced ADC with respect to normal fibroglandular breast tissue and benign masses due to the higher cell density of most breast tumors. However, in the breast intravoxel partial-volume averaging of fat and tissue may cause errors in breast ADC measurements due to the low ADC values of unsuppressed fat [9]. Variability in fat suppression quality along with differences in breast tissue density and composition may strongly influence the extent of fat signal contributions to breast ADC measures and resulting performance of DWI for breast imaging. Prior breast DWI studies incorporated a variety of fat suppression techniques, including spectral selective attenuated inversion recovery (SPAIR), fat saturation or spectral inversion recovery (SPIR), and water-only excitation methods, though many did not report the specific method used.
Fat suppression quality is highly dependent on such factors as magnetic field homogeneity, coil sensitivity, and air-tissue susceptibility differences and can provide variable results for breast imaging. Particularly for serial monitoring of treatment using DWI, uniform and reproducible fat suppression is important for accurate assessment of treatment-induced changes in breast tumor ADC measures. A better understanding of the potential effects from fat signal on breast ADC measures would facilitate clinical interpretation of breast DWI scans. The purpose of this study was to determine the effect of intravoxel fat signal on breast ADC measures and the additional influence of breast density.
METHODS
Subjects
The study included 21 women (mean age 51 years) with biopsy-proven invasive breast cancer imaged with MRI prior to undergoing surgery. Five of the 21 patients had received chemotherapy prior to the study MRI. Patient characteristics are listed in Table 1. This study was approved by our Institutional Review Board and waived patient informed consent due to the retrospective design. DWI images were assessed for adequate fat suppression quality with uniform bilateral suppression prior to inclusion in the study.
Table 1.
Patient Characteristics
| n | (%) | |
|---|---|---|
| Age (years) | ||
| <40 | 4 | 19% |
| 40–50 | 7 | 33% |
| >50 | 10 | 48% |
|
| ||
| Histological Type | ||
| Invasive Ductal | 13 | 62% |
| Invasive Lobular | 4 | 19% |
| Mucinous | 1 | 5% |
| Inflammatory | 2 | 9% |
| Adenocarcinoma | 1 | 5% |
|
| ||
| Tumor Grade | ||
| 2 | 13 | 62% |
| 3 | 7 | 33% |
| n/a | 1 | 5% |
|
| ||
| Tumor Size* (cm) | ||
| <2 | 4 | 19% |
| 2–5 | 12 | 57% |
| >5 | 5 | 24% |
|
| ||
| MRI enhancement type | ||
| mass | 17 | 81% |
| non-mass | 4 | 19% |
|
| ||
| Mammographic Breast Density | ||
| Mostly Fat | 1 | 5% |
| Scattered Fibroglandular Densities | 1 | 5% |
| Heterogeneously Dense | 14 | 66% |
| Extremely Dense | 5 | 24% |
Size defined as longest diameter on DCE-MRI
Abbreviations: n/a = data not available
MR Acquisition
Imaging was performed on a 1.5T GE Signa scanner (GE Medical Systems, Milwaukee, WI) using a bilateral phased array breast coil (MRI Devices Corp., Waukesha, WI). Each MRI scan included a sagittal dynamic contrast-enhanced MRI (DCE-MRI) sequence, axial post-contrast T1-weighted sequence, and an axial DWI acquisition. A water phantom was included in each study for reference, consisting of a small vial of water positioned under the coil, between the breasts and within the field-of-view.
Dynamic contrast-enhanced MRI
DCE-MRI was obtained using a sagittal fat-suppressed three-dimensional fast gradient recalled echo (3DFGRE) sequence optimized for accurate detection and staging [10], with TR = 8 ms, TE = 4.2 ms, 20° flip angle, and two repetitions for oversampling to remove phase wrap. The field of view was 18–20 cm, with 2 mm slice thickness, and a 256 × 192 acquisition matrix. The resulting in-plane resolution was approximately 0.7 × 0.94 mm, and sixty slices were acquired in the sagittal orientation to cover the entire symptomatic breast. The contrast agent used was gadopentetate dimeglumine (Magnevist, Schering AG, Berlin, Germany) at a dose of 0.1 mmol/kg body weight, followed by a 10 ml saline flush. Three time points were acquired during each MR examination: a pre-contrast scan before contrast injection, followed by two sequential post-contrast scans centered at 2.5 minutes and 7.5 minutes after contrast injection.
Contrast-enhanced MRI
Following DCE-MRI, an axial fat-suppressed T1-weighted two-dimensional fast gradient echo sequence (2D FGRE) was acquired for tumor localization relative to the axial DWI series. Imaging parameters were: TR = 100 ms, TE = 4.2 ms, 40° flip angle, NEX = 2. We acquired a field of view = 35 cm, slice thickness = 5 mm, and acquisition matrix = 256 × 192 to match the slice prescription used for DWI. The resulting in-plane resolution was 1.37 × 1.82 mm.
Diffusion-weighted MRI
DWI was acquired using a diffusion-weighted single-shot fast spin echo (SSFSE) pulse sequence based on a previously described technique [11]. For breast imaging, SSFSE holds advantages over standard echo planar imaging (EPI) based techniques because it suffers far less image distortion due to magnetic susceptibilities and chemical shift artifacts [11–13], enabling direct spatial comparison with the undistorted contrast-enhanced T1-weighted anatomic images. The SSFSE sequence also enables the acquisition of DWI both with and without fat suppression. Obtaining breast DWI images without using fat suppression is not feasible using EPI acquisition techniques, which require fat suppression to avoid severe ghosting artifacts. Axial images were acquired with TR = 6.2 sec, TE = 61 ms, field of view = 35 cm, slice thickness = 5 mm, acquisition matrix = 128 × 128, NEX = 0.5 and four averages. The resulting in-plane resolution was 2.73 × 2.73 mm. The diffusion weighting was achieved using b= 0 and 600 s/mm2 applied in 3 directions independently, with a gradient duration δ = 26.8 msec, interval Δ = 34.8 msec, and gradient strength of GD = 21 mT/m. The DWI scan duration was 128 seconds. Each patient underwent two consecutive DWI scans, with and without fat suppression. Fat suppression was performed using a water-selective spectral spatial excitation pulse [14].
Image Analysis
DWI data was analyzed offline using in-house software developed in IDL (ITT Visual Information Solutions, Boulder, CO). For each slice location, ADC maps were created on a pixel-by-pixel basis by
| (1) |
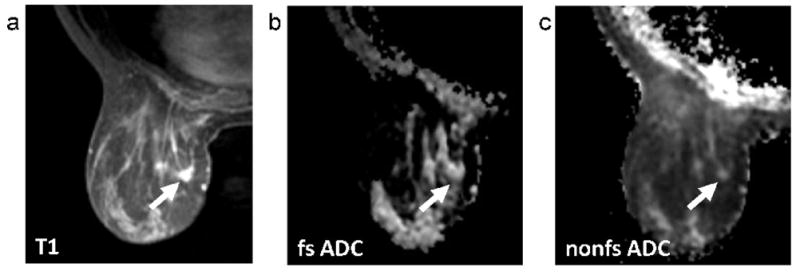
where S0 and SD are the b = 0 s/mm2 and b = 600 s/mm2 signal intensities. ADC maps were generated for both DWI acquisitions in each exam. Region of interest (ROI) measurements were calculated in tumor and normal fibroglandular tissue from the fat-suppressed and non-fat-suppressed ADC maps for each patient. Tumor was identified by contrast enhancement on the DCE-MRI and post-contrast 2D FGRE images, and normal tissue was measured in areas of non-enhancing fibroglandular tissue in the opposite breast. ROIs were drawn free-hand on the post-contrast 2D FGRE images and propagated to the corresponding position on fat-suppressed and non-fat-suppressed ADC maps. Tumor ROIs were drawn at the central slice of the tumor to encompass as much of the enhancing abnormality as possible while staying within the borders to avoid partial volume averaging with adjacent tissue, Figure 1. Care was taken to avoid non-enhancing regions of high T2 within a lesion, such as cyst, hematoma, or necrosis, by verifying the ROI against the T2-weighted (b = 0 s/mm2) image and ADC map. ADC was also calculated in the water phantom for each exam. Difference in ADC (ΔADC) between fat suppressed and non-fat-suppressed measures were calculated as
FIG. 1.
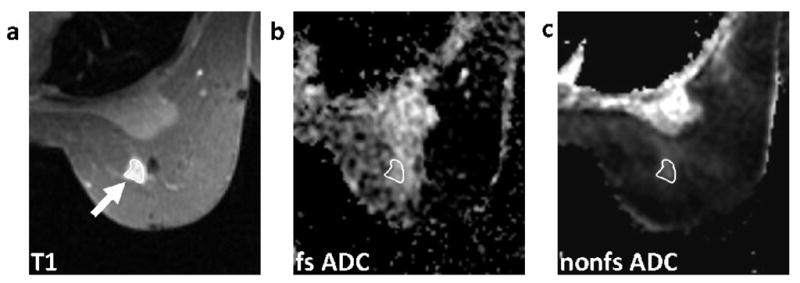
Methodology for ROI measurement. As illustrated, the tumor ROI was defined free-hand on the axial post-contrast T1-weighted image (a) and propagated to the corresponding position on fat-suppressed (b) and non-fat-suppressed (c) ADC maps. ROIs were drawn at the central slice of the tumor with care taken to exclude regions of fat as identified on the T1-weighted image (a). Mean ADC was calculated for the ROI on each of the ADC maps (b,c).
| (2) |
where μfs and μnfs are the fat-suppressed and non-fat-suppressed ADC values, respectively. To quantify lesion conspicuity on ADC maps, the contrast-to-noise ratio (CNR) was calculated for each subject as
| (3) |
where μn and μt are the mean ADC values for the normal fibroglandular tissue and tumor ROIs, respectively, and σn and σt are the corresponding standard deviations.
Clinical Data
Clinical information including tumor type, grade, and size, mammographic breast density, and lesion morphology on DCE-MRI (mass versus non-mass) was obtained retrospectively from the medical records. DCE-MRI was clinically interpreted following the American College of Radiology Breast Imaging and Reporting Data System (BI-RADS) lexicon [15]. Tumor size was defined as the largest diameter of the largest reported lesion on MRI, including both mass and non-mass lesions. Breast density on x-ray mammography was described using the BIRADS density reporting conventions: BIRADS 1 = almost entirely fat, 2 = scattered fibroglandular densities, 3 = heterogeneously dense and 4 = extremely dense.
Statistical Analysis
ADC measures were compared between fat-suppressed and non-fat-suppressed DWI scans using Bland-Altman analysis and paired Wilcoxon Sign-Rank Test. Tumor and normal tissue ADC values in each subject were also compared by Wilcoxon Sign-Rank Test. To determine the effect of breast density on the degree of ADC measurement error and tumor conspicuity, BIRADS 1, 2, and 3 were grouped as low/intermediate density for comparison with BIRADS 4 extremely dense for analysis purposes. Measurements were compared between the two breast density groups by Mann-Whitney U test. All tests were two-sided and a p-value < 0.05 was considered statistically significant.
RESULTS
For the 21 patients included in the study, primary breast lesions ranged in size from 1.2 to 7.8cm (median, 3.6cm) and the majority (17/21) presented as a mass-type lesion on DCE-MRI. Breast density on x-ray mammography was categorized as extremely dense in 24% (5/21) of cases, heterogeneously dense in 66% (14/21), scattered fibroglandular tissue in 5% (1/21) and mostly fat in 5% (1/21), Table 1. In two cases, normal breast tissue measures could not be determined due to a paucity of normal-appearing fibroglandular tissue distant from the tumor. These two cases were excluded from the calculations and analyses involving normal tissue ADC and CNR. Fat suppression quality was deemed acceptable in all cases, with uniform suppression between right and left breasts.
ADC Measures on Fat-Suppressed versus Non-Fat-Suppressed DWI
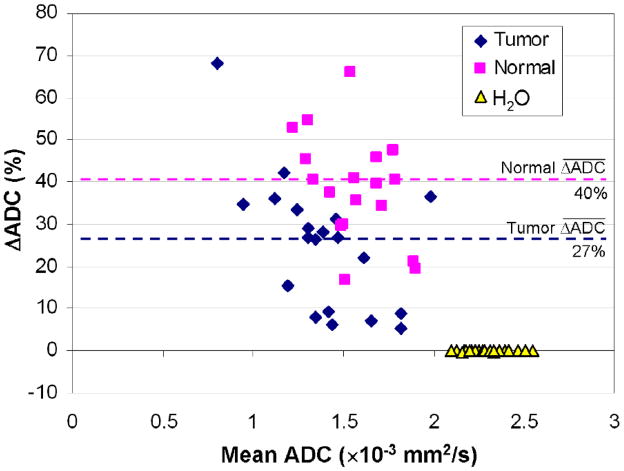
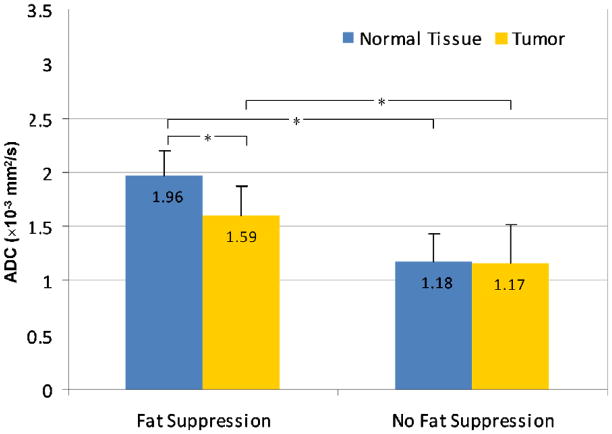
For both tumor and normal tissue, ADC values measured without fat suppression were systematically lower than those measured with fat suppression. Underestimations in ADC measurement due to contributions from fat signal were significantly greater in normal tissue than tumor (p<0.0001, Wilcoxon Sign-Rank Test); mean ΔADC = 40±13% for normal tissue and 27±18% for tumor, Figure 2. The mean ADC for tumors was 1.59 ± 0.28 × 10⁻³ mm2/s with fat suppression versus 1.17 ± 0.35 × 10⁻³ mm2/s without (p<0.0001); the mean ADC for normal fibroglandular tissue was 1.96 ± 0.24 × 10⁻³ mm2/s with fat suppression versus 1.18 ± 0.26 × 10⁻³ mm2/s without (p<0.0001), Figure 3. In contrast, the water phantom measurements showed no differences in ADC, Figure 2, with a mean ADC of 2.29 ± 0.13 × 10⁻³ mm2/s using fat suppression and 2.30 ± 0.13 × 10⁻³ mm2/s without fat suppression (mean ΔADC = 0±1%, p=0.17).
FIG. 2.
Comparison of breast ADC values measured with and without fat suppression. Bland-Altman plot shows the ADC difference (ΔADC), expressed as a percent of the fat-suppressed value, versus the mean of the fat suppressed and non-fat suppressed ADC values for tumors, normal fibroglandular tissue and the water phantom that was included in each scan. Dotted lines indicate mean differences. ADC values for tumor and normal tissue were significantly lower when fat suppression was not used (p<0.0001 for both), while no differences were observed for the water phantom (p=0.17).
FIG 3.
Mean ADC measures for tumor and normal tissue, with and without fat suppression. Error bars represent standard deviations. Asterisks (*) indicate significant differences (p<0.0001) between paired measures by Wilcoxon Sign-Rank Test. ADC values measured without fat suppression were significantly lower than those measured with fat suppression for both tumor and normal tissue; tumors exhibited significantly lower ADC than normal tissue with fat suppression (p<0.0001) but not without (p=0.37).
Tumor Conspicuity on Fat-Suppressed versus Non-Fat-Suppressed DWI
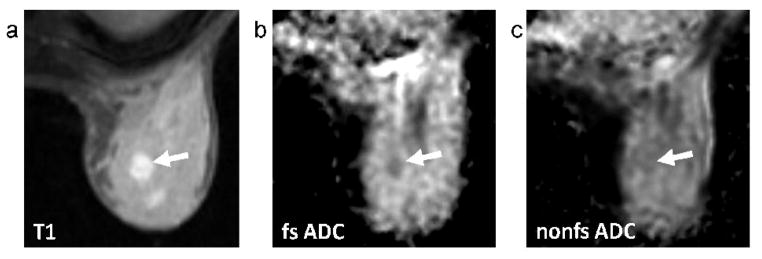
Tumor conspicuity was defined as the contrast-to-noise ratio (CNR) on ADC between tumor and normal fibroglandular tissue within a subject. Breast tumors demonstrated a significantly lower ADC value compared with normal tissue using fat-suppressed measures (p<0.0001, Wilcoxon Sign-Rank Test), with a mean CNR of 1.97 ± 1.33. However, the difference in ADC between tumor and normal tissue was not significant in the non-fat-suppressed measures (p=0.37), with a mean CNR of 0.30 ± 1.34, Figure 3. CNR was significantly higher for fat-suppressed versus non-fat suppressed images (p<0.0001). Higher tumor conspicuity on DWI using fat suppression is illustrated in Figure 4.
FIG. 4.
Patient categorized on mammography as having extremely dense breasts (BI-RADS 4), with a 1.2cm invasive carcinoma. Sagittal contrast-enhanced DCE-MRI image (a), axial T1-weighted post-contrast image (b), axial fat-suppressed (fs) ADC map (c), and axial non-fat-suppressed (nfs) ADC map (d). The tumor (arrows) is more conspicuous on the fat-suppressed ADC map (CNR = 4.05) than the non-fat-suppressed ADC map (CNR = 1.82).
Effect of Mammographic Breast Density on ADC measures
ADC measures in patients with extremely high mammographic breast density, such as the example in Figure 4, were compared to those with lower breast density (heterogeneously dense, scattered, and fatty), such as the example in Figure 5. While no differences were observed in either tumor or normal ADC measures between breast density categories, ADC underestimation (ΔADC) was worse in patients with lower breast density than those with extremely dense breasts (p=0.032 for tumor and p=0.046 for normal tissue), Table 2. Tumor conspicuity did not show a significant association with breast density: with fat suppression, mean CNR was 2.19 ± 1.77 in patients with extremely dense breasts compared to 1.91 ± 1.27 in patients with lower breast density (p=0.55); without fat suppression mean CNR was 0.43 ± 1.46 and 0.26 ± 1.36 in extremely dense and lower density breasts, respectively (p=0.84).
FIG. 5.
Patient categorized as having scattered fibroglandular density (BI-RADS 2), with 7.8cm extent of segmental multifocal enhancing carcinoma through breast. Sagittal contrast-enhanced DCE-MRI image (a), axial T1-weighted post-contrast image (b), axial fat-suppressed (fs) ADC map (c), and axial non-fat-suppressed (nfs) ADC map (d). Tumor is indicated by arrows.
Table 2.
ADC measures compared by breast density (extremely dense vs. others).
| Extremely Dense (BI-RADS category 4) | Other (BI-RADS categories 1–3) | Mann-Whitney U Test p value |
|
|---|---|---|---|
| Tumor ADC* | 1.59±0.19×10⁻³ mm2/s | 1.60±0.31×10⁻³ mm2/s | 0.89 |
| Normal ADC* | 1.95±0.22×10⁻³ mm2/s | 1.97±0.25×10⁻³ mm2/s | 0.73 |
| Tumor ΔADC | 13±16% | 31±16% | 0.032 |
| Normal ΔADC | 28±11% | 43±12% | 0.046 |
| CNR* | 2.19±1.77 | 1.91±1.27 | 0.55 |
calculated with fat-suppression
Abbreviations: ADC=apparent diffusion coefficient, ΔADC = difference between fat-suppressed and non-fat-suppressed ADC, CNR=contrast-to-noise ratio
DISCUSSION
There is growing interest in using diffusion-weighted MRI to characterize breast disease and changes in tumors in response to treatment. Our study demonstrates significant contribution to breast ADC measures from unsuppressed intravoxel fat signal, and underlines the importance of achieving robust fat suppression for clinical breast DWI applications.
In this study, 21 women with breast cancer were imaged with DWI both with and without fat suppression. Fat-suppressed mean ADC values in our study (1.59 ± 0.28 × 10⁻³ mm2/s for tumor, 1.96 ± 0.24 × 10⁻³ mm2/s for normal fibroglandular tissue) compared well to those reported in other studies after accounting for differences in study design and b-values [4, 16, 17]. The ADC values for tumor and normal fibroglandular tissue were significantly lower when measured without fat suppression. On the other hand, no difference was observed for ADC measures in a water phantom, validating that the two acquisitions differed only by fat suppression and that the measured ADC differences were not due to other factors. It has been reported previously that fat produces a much lower ADC value than breast fibroglandular tissue due to restricted water mobility [18]. In our study, breast ADC values were reduced due to subvoxel partial volume averaging of fat and tissue, even when ROIs were carefully placed to avoid adipose tissue regions. This should be taken into consideration if DWI is performed without adequate fat suppression. Furthermore, ADC underestimation was significantly greater in normal tissue than in tumor and in patients with lower mammographic breast density (i.e. fattier breasts), which suggests that there is more partial volume averaging with fat in normal fibroglandular tissue than in tumors and in women with fattier breasts compared to those with dense breasts.
To assess tumor conspicuity, we calculated the tumor ADC contrast-to-noise ratio by comparing ADC values for tumor and normal tissue in each subject. Tumor contrast was higher on the ADC maps created with fat suppression than for those without fat suppression, indicating that tumors could be more easily detected by using fat suppression. This was primarily due to significantly reduced ADC values in the normal tissue without fat suppression. We found no associations between tumor conspicuity and breast density, with similar contrast values observed for each density category. However, there were a limited number of patients with high breast density in our study and our findings need to be validated in a larger cohort. Our results are in contrast to those of Yoshikawa et al. who previously reported better cancer detection rates on DWI in patients with lower breast density [16]. The difference in our findings may be attributed to study design: in their study, breast tumors were identified by visual inspection of diffusion-weighted images rather than by ADC values and heterogeneously dense and extremely dense were combined into a single breast density category for analysis.
While this study illustrates the importance of fat-suppression, uniform fat suppression is difficult to achieve in the breast. Fat suppression can be implemented through a variety of techniques such as a chemical shift selective (CHESS) pulse, short TI inversion recovery (STIR), and water excitation (the approach used in this study). CHESS selectively nulls signals from fat protons using the chemical shift difference between fat and water protons; however, the shifts of fat and water can be misassigned in breasts with very little fibroglandular tissue in which the fat peak is significantly larger than the water peak. In addition, the shifts may vary due to field inhomogeneities caused by air-fat interfaces, skin folds, and biopsy clips or other hardware [19]. STIR-based methods may hold more promise in the breast; Kazama et al. found that fat suppression in breast DWI was insufficient in 44% of patients using CHESS and in 0% of patients using STIR [19]. However Wenkel et al. showed better lesion visibility on breast DWI using CHESS due to reduced signal-to-noise with the STIR technique [20]. Furthermore, Baron et al. reported that water excitation may provide optimal SNR over other fat suppression methods for breast DWI [9]. Based on the relationship between fat suppression and ADC, nonuniform fat suppression could impact the ADC differently in different areas of the breast, making it difficult to apply ADC thresholds for cancer detection. In treatment monitoring, nonuniform intra- or inter-scan fat suppression in the tumor region could impact measured ADC changes, potentially resulting in erroneous conclusions about change in tumor ADC and response to treatment. Uniform, reproducible fat-suppression is therefore essential to applications of DW-MRI in the breast.
Our study had limitations. There were a small number of patients in each of the mostly fat (n=1), scattered fibroglandular densities (n=1), and extremely dense (n=5) breast density categories, compared to heterogeneously dense (n=14). We were therefore not able to independently assess the lower density categories, and the finding that ADC error decreases with increasing breast density needs to be validated with larger study groups. In addition, normal tissue ADC values were obtained from the contralateral breast and CNR calculations may not reflect true tumor conspicuity, which would be judged relative to surrounding tissue. The study investigated a single fat suppression method; differences in ADC may vary depending on the approach. However, this should not affect the observation of greater ADC differences (fat-suppressed versus non-fat-suppressed) in normal tissue compared to tumor. Furthermore, ADC was calculated from only two b-values, with minimum b = 0 s/mm2. Calculation of ADC using a greater number of b-values with a nonzero minimum b would provide more accurate diffusion measures without perfusion effects [21]. In our study, DWI was performed after injection of a gadolinium-based contrast agent. While several prior studies have not shown a significant effect on ADC following administration of a contrast agent [22–25], it may be preferable to acquire DWI sequences prior to contrast injection to avoid any possible confounding effects.
In summary, the results of this study showed that robust fat suppression in DWI is essential for accurate detection and characterization of malignant breast lesions. Intravoxel partial-voluming of unsuppressed fat signal can cause a reduction in the ADC measurement, even in solid appearing breast tumors, and can significantly limit lesion conspicuity. Influences of fat signal on tumor ADC values were most pronounced in breasts with low fibroglandular density. Techniques measuring ADC in the breast without adequately suppressing signal from fat may underestimate the values and be less sensitive to changes with treatment.
Acknowledgments
Funding sources: the U.S. Department of the Army (grant # DAMD17-98-1-8191), NIH (grant # R01-CA69587), and Susan G. Komen for the Cure (grant BCTR0600618)
Footnotes
Publisher's Disclaimer: This is a PDF file of an unedited manuscript that has been accepted for publication. As a service to our customers we are providing this early version of the manuscript. The manuscript will undergo copyediting, typesetting, and review of the resulting proof before it is published in its final citable form. Please note that during the production process errors may be discovered which could affect the content, and all legal disclaimers that apply to the journal pertain.
References
- 1.Le Bihan D, Breton E, Lallemand D, Grenier P, Cabanis E, Laval-Jeantet M. MR imaging of intravoxel incoherent motions: application to diffusion and perfusion in neurologic disorders. Radiology. 1986;161(2):401–7. doi: 10.1148/radiology.161.2.3763909. [DOI] [PubMed] [Google Scholar]
- 2.El Khouli RH, Jacobs MA, Mezban SD, Huang P, Kamel IR, Macura KJ, Bluemke DA. Diffusion-weighted imaging improves the diagnostic accuracy of conventional 3.0-T breast MR imaging. Radiology. 2010;256(1):64–73. doi: 10.1148/radiol.10091367. [DOI] [PMC free article] [PubMed] [Google Scholar]
- 3.Partridge SC, DeMartini WB, Kurland BF, Eby PR, White SW, Lehman CD. Quantitative diffusion-weighted imaging as an adjunct to conventional breast MRI for improved positive predictive value. AJR Am J Roentgenol. 2009;193(6):1716–22. doi: 10.2214/AJR.08.2139. [DOI] [PubMed] [Google Scholar]
- 4.Woodhams R, Matsunaga K, Kan S, Hata H, Ozaki M, Iwabuchi K, Kuranami M, Watanabe M, Hayakawa K. ADC mapping of benign and malignant breast tumors. Magn Reson Med Sci. 2005;4(1):35–42. doi: 10.2463/mrms.4.35. [DOI] [PubMed] [Google Scholar]
- 5.Yabuuchi H, Matsuo Y, Okafuji T, Kamitani T, Soeda H, Setoguchi T, Sakai S, Hatakenaka M, Kubo M, Sadanaga N, Yamamoto H, Honda H. Enhanced mass on contrast-enhanced breast MR imaging: Lesion characterization using combination of dynamic contrast-enhanced and diffusion-weighted MR images. J Magn Reson Imaging. 2008;28(5):1157–65. doi: 10.1002/jmri.21570. [DOI] [PubMed] [Google Scholar]
- 6.Iacconi C, Giannelli M, Marini C, Cilotti A, Moretti M, Viacava P, Picano E, Michelotti A, Caramella D. The role of mean diffusivity (MD) as a predictive index of the response to chemotherapy in locally advanced breast cancer: a preliminary study. Eur Radiol. 2009;20(2):303–8. doi: 10.1007/s00330-009-1550-z. [DOI] [PubMed] [Google Scholar]
- 7.Pickles MD, Gibbs P, Lowry M, Turnbull LW. Diffusion changes precede size reduction in neoadjuvant treatment of breast cancer. Magn Reson Imaging. 2006;24(7):843–7. doi: 10.1016/j.mri.2005.11.005. [DOI] [PubMed] [Google Scholar]
- 8.Sharma U, Danishad KK, Seenu V, Jagannathan NR. Longitudinal study of the assessment by MRI and diffusion-weighted imaging of tumor response in patients with locally advanced breast cancer undergoing neoadjuvant chemotherapy. NMR Biomed. 2009;22(1):104–13. doi: 10.1002/nbm.1245. [DOI] [PubMed] [Google Scholar]
- 9.Baron P, Dorrius MD, Kappert P, Oudkerk M, Sijens PE. Diffusion-weighted imaging of normal fibroglandular breast tissue: influence of microperfusion and fat suppression technique on the apparent diffusion coefficient. NMR Biomed. 2010 doi: 10.1002/nbm.1475. Epub ahead of print. [DOI] [PubMed] [Google Scholar]
- 10.Esserman L, Hylton N, Yassa L, Barclay J, Frankel S, Sickles E. Utility of magnetic resonance imaging in the management of breast cancer: evidence for improved preoperative staging. J Clin Oncol. 1999;17(1):110–9. doi: 10.1200/JCO.1999.17.1.110. [DOI] [PubMed] [Google Scholar]
- 11.Partridge SC, McKinnon GC, Henry RG, Hylton NM. Menstrual cycle variation of apparent diffusion coefficients measured in the normal breast using MRI. J Magn Reson Imaging. 2001;14(4):433–8. doi: 10.1002/jmri.1204. [DOI] [PubMed] [Google Scholar]
- 12.Lin C, Geppert C, Stemmer A, Schultze-Haakh H, Majidi SS, Kipfer HD. Diffusion weighted imaging of the breast at 3.0T with BLADE-TSE: Initial Experience. Proceedings of ISMRM; 2009; Honolulu, HI. [Google Scholar]
- 13.Kinoshita T, Yashiro N, Ihara N, Funatu H, Fukuma E, Narita M. Diffusion-weighted half-Fourier single-shot turbo spin echo imaging in breast tumors: differentiation of invasive ductal carcinoma from fibroadenoma. J Comput Assist Tomogr. 2002;26(6):1042–6. doi: 10.1097/00004728-200211000-00033. [DOI] [PubMed] [Google Scholar]
- 14.Meyer CH, Pauly JM, Macovski A, Nishimura DG. Simultaneous spatial and spectral selective excitation. Magn Reson Med. 1990;15(2):287–304. doi: 10.1002/mrm.1910150211. [DOI] [PubMed] [Google Scholar]
- 15.American College of Radiology (ACR) Breast imaging reporting and data system atlas (BI-RADS Atlas) 4. Reston, VA: 2003. [Google Scholar]
- 16.Yoshikawa MI, Ohsumi S, Sugata S, Kataoka M, Takashima S, Kikuchi K, Mochizuki T. Comparison of breast cancer detection by diffusion-weighted magnetic resonance imaging and mammography. Radiat Med. 2007;25(5):218–23. doi: 10.1007/s11604-007-0128-4. [DOI] [PubMed] [Google Scholar]
- 17.Sinha S, Lucas-Quesada FA, Sinha U, DeBruhl N, Bassett LW. In vivo diffusion-weighted MRI of the breast: potential for lesion characterization. J Magn Reson Imaging. 2002;15(6):693–704. doi: 10.1002/jmri.10116. [DOI] [PubMed] [Google Scholar]
- 18.Englander SA, Ulug AM, Brem R, Glickson JD, van Zijl PC. Diffusion imaging of human breast. NMR Biomed. 1997;10(7):348–52. doi: 10.1002/(sici)1099-1492(199710)10:7<348::aid-nbm487>3.0.co;2-r. [DOI] [PubMed] [Google Scholar]
- 19.Kazama T, Nasu K, Kuroki Y, Nawano S, Ito H. Comparison of diffusion-weighted images using short inversion time inversion recovery or chemical shift selective pulse as fat suppression in patients with breast cancer. Jpn J Radiol. 2009;27(4):163–7. doi: 10.1007/s11604-009-0314-7. [DOI] [PubMed] [Google Scholar]
- 20.Wenkel E, Geppert C, Schulz-Wendtland R, Uder M, Kiefer B, Bautz W, Janka R. Diffusion weighted imaging in breast MRI: comparison of two different pulse sequences. Acad Radiol. 2007;14(9):1077–83. doi: 10.1016/j.acra.2007.06.006. [DOI] [PubMed] [Google Scholar]
- 21.Bogner W, Gruber S, Pinker K, Grabner G, Stadlbauer A, Weber M, Moser E, Helbich TH, Trattnig S. Diffusion-weighted MR for differentiation of breast lesions at 3.0 T: how does selection of diffusion protocols affect diagnosis? Radiology. 2009;253(2):341–51. doi: 10.1148/radiol.2532081718. [DOI] [PubMed] [Google Scholar]
- 22.Chen G, Jespersen SN, Pedersen M, Pang Q, Horsman MR, Stodkilde-Jorgensen H. Intravenous administration of Gd-DTPA prior to DWI does not affect the apparent diffusion constant. Magn Reson Imaging. 2005;23(5):685–9. doi: 10.1016/j.mri.2005.02.015. [DOI] [PubMed] [Google Scholar]
- 23.Fitzek C, Mentzel HJ, Fitzek S, Sauner D, Kaiser WA, Reichenbach JR. Echoplanar diffusion-weighted MRI with intravenous gadolinium-DTPA. Neuroradiology. 2003;45(9):592–7. doi: 10.1007/s00234-003-0965-5. [DOI] [PubMed] [Google Scholar]
- 24.Ogura A, Hayakawa K, Miyati T, Maeda F. The effect of susceptibility of gadolinium contrast media on diffusion-weighted imaging and the apparent diffusion coefficient. Acad Radiol. 2008;15(7):867–72. doi: 10.1016/j.acra.2007.12.020. [DOI] [PubMed] [Google Scholar]
- 25.Rubesova E, Grell AS, De Maertelaer V, Metens T, Chao SL, Lemort M. Quantitative diffusion imaging in breast cancer: a clinical prospective study. J Magn Reson Imaging. 2006;24(2):319–24. doi: 10.1002/jmri.20643. [DOI] [PubMed] [Google Scholar]


