

Abstract
Background
M[ND1]enopause is associated with urine phosphorus retention, which is mitigated by estrogen therapy. Fibroblast growth factor 23 (FGF-23) is a hormone originating from bone that regulates urine phosphorus excretion. Whether sex or estrogen therapy is associated with different FGF-23 levels is unknown.
Study Design & Setting
Cross-sectional study among ambulatory individuals with prevalent cardiovascular disease.
Predictors
Sex, and among women, use or non-use of estrogen.
Outcomes
Serum phosphorus, tubular maximum reabsorption of phosphorus indexed to GFR (TMP/GFR), and plasma FGF-23 concentrations.
Results
Among 987 participants, the mean age was 67 ± 11 years, 182 (18%) were female; 46 (25%) were taking estrogen. The mean eGFR was 71 ± 23 (SD) ml/min/1.73m2. Compared to women who were not taking estrogen, both women on estrogen therapy and men had significantly lower serum phosphorus concentrations, lower TMP/GFR (indicating higher urine phosphorus excretion), and lower FGF-23 concentrations with adjustment for age, demographics, and kidney function (P < 0.001 for each). Mean FGF-23 in RU/ml were 68.7 (95% CI, 59.7–79.0) in non estrogen using women, 43.8 (95% CI, 41.2–46.5) in men, and 45.1 (95% CI, 35.2–57.4) in women using estrogen in adjusted analysis (P< 0.001).
Limitations
The majority of participants were men. Estrogen therapy was not randomly assigned.
Conclusions
Older women who are not taking estrogen have higher FGF-23 levels than either men or women taking estrogen. In the context of prior literature, these data suggest that post-menopausal phosphorus retention may stimulate higher FGF-23 concentrations after menopause.
Keywords: Menopause, fibroblast growth factor-23, phosphorus, estradiol, sex hormones
Elevated extracellular phosphorus concentrations trigger vascular smooth muscle cells to transform into osteoblast-like cells and to deposit calcium in the extracellular matrix.(1) In end-stage renal disease (ESRD) populations, higher serum phosphorus concentrations are associated with increased coronary artery calcification and all-cause mortality.(2, 3) Recently, similar associations have been extended to the general population, even among persons with ostensibly normal kidney function and with phosphorus levels within the normal laboratory range. In this setting, higher phosphorus concentrations have been associated with arterial calcification,(4–6) arterial stiffness,(7–9) and cardiovascular disease (CVD) events,(10–12) independent of kidney function and traditional CVD risk factors. These findings suggest that observations made in vitro and in ESRD patients may extend to the general population, and suggests new potential targets to treat or prevent CVD. The findings have also led to new interest in identifying factors that regulate serum phosphorus concentrations in the general population.(13)
Among the strongest and most consistent correlates of higher serum phosphorus in older community-living populations is female sex, likely reflecting the consequences of low estradiol levels after menopause.(7, 13–15) Exogenous estradiol induces phosphaturia and lowers serum phosphorus in both rodent models and in humans.(16–20) Conversely, large cross-sectional studies have demonstrated a marked increase in serum phosphorus and commensurate decline in urine phosphorus excretion after menopause.(14, 16)
Fibroblast growth factor 23 (FGF-23) has emerged as a critical regulator of serum phosphorus. Derived from bone, FGF-23 has two main biological functions. First, in the kidney, it decreases reabsorption of filtered phosphorus, leading to greater urine phosphorus loss and lower serum phosphorus levels. Second, it inhibits 1α hydroxylase, thereby preventing conversion of 25 hydroxyvitamin D to the active hormone 1,25 dihydroxyvitamin D (calcitriol).(21) Little is known about whether or not FGF-23 levels differ by sex. In a prior analysis in the Heart and Soul Study cohort, we reported that women had higher FGF-23 levels than men in unadjusted analyses.(22) Similar findings were recently reported by Isakova and colleagues in a large cohort of individuals with moderate to severe CKD. (23) Whether or not sex differences correspond with serum and urine phosphorus levels in post-menopausal women, or are different in women using estrogen is unknown. We compared plasma FGF-23 concentrations, serum and urine phosphorus, between men and women within a large sample of ambulatory individuals with known stable CVD and a spectrum of kidney function ranging from normal to moderate chronic kidney disease (CKD). Among women, we also evaluated the association of estrogen therapy with FGF-23 and serum and urine phosphorus.
METHODS
Participants
The Heart and Soul Study is an observational study designed to evaluate the association of psychological factors with CVD. Methods have been described previously.(24) Briefly, the study recruited participants with prevalent CAD from outpatient clinics in the San Francisco bay area. CAD was defined by: history of myocardial infarction, angiographic evidence of >50% stenosis in ≥ 1 coronary vessels, evidence of exercise-induced ischemia by treadmill or nuclear testing, or history of coronary revascularization. Exclusion criteria included an inability to walk one block, myocardial infarction within the previous six months, or plans to leave the local area within three years. The study protocol was approved by the Institutional Review Boards at participating centers and all participants provided written informed consent.
Between September 2000 and December 2002, 1024 participants were enrolled. For the present analysis, we excluded 32 (4%) subjects with missing FGF-23 measurements, and an additional 5 subjects (0.5%) with missing serum phosphorus measurements, resulting in a final sample size of 987 participants.
Measurements
FGF- 23
EDTA-plasma specimens that had never been previously thawed were used to measure FGF-23 using a carboxy-terminal human enzyme-linked immunosorbent assay (Immutopics, www.immutopicsintl.com).(25) This assay recognizes two epitopes on the carboxy terminal side of the site of proteolytic cleavage, and thus recognizes both full-length FGF-23 and carboxy terminal cleavage fragments of FGF-23. Measurements by this assay are highly correlated with the assays specific for carboxy terminal FGF-23 and are strongly correlated with FGF-23 bioactivity in patients with kidney failure, where accumulation of inactive fragments is more likely to manifest.(26–28) Measurements were made in duplicate and results were averaged. The intra-assay coefficient of variation was 5.0%; the inter-assay coefficient of variation was 9.9% at a concentration of 36.4 RU/mL and 12.6% at a level 379 RU/mL.
Serum phosphorus
Fasting morning blood specimens were collected at the study visit. Serum phosphorus levels were measured using a Vitros 950IRC with measurement ranges of 0.3 mg/dL to 13 mg/dL and coefficient of variation of 3.5% as previously described. (29)
Urine Phosphorus
Twenty-four hour urine specimens were collected for all participants as described previously.(30) Urine was mixed thoroughly, and 5ml aliquots were stored at −80 degrees Celsius. At the time of analysis, specimens were thawed, treated with 1mol/L hydrochloric acid and urine phosphorus was measured using a Cobas 6000 analyzer (Roche Diagnostics, www.roche.com). The lower limit of detection was 3.4mg/dL, and the coefficient of variation was 1.4–1.7%. Serum and urine creatinine were measured by the rate Jaffe method. These measurements were combined with serum phosphorus to calculate the renal tubular maximum reabsorption of phosphorus indexed to GFR (TMP/GFR).(31) The TMP/GFR reflects the amount of phosphorus reabsorbed from the urinary space indexed to the level of GFR. Higher levels are indicative of greater reabsorption, and thus lower urinary phosphorus excretion, independent of the isotonicity of the urine or the eGFR.
Other Measurements
Diabetes was defined as a self reported history of diabetes, or use of diabetic medications including insulin. Blood pressure was determined by trained study personnel using a calibrated sphingomenometer. Hypertension was defined as self reported history of hypertension, systolic blood pressure > 140 mmHg or diastolic blood pressure > 90 mmHg. Participants were weighed and height was measured without shoes, and body mass index (BMI) was calculated (kg/m2). Cystatin C was measured using a BNII nephelometer (Siemens; www.medical.siemens.com) that used a particle-enhanced immunonephelometric assay (N Latex Cystatin-C) as previously described,(32) and glomerular filtration rate was estimated (eGFR) using the equation eGFR = 76.7 * (serum cystatin-C)−1.19.(33) Urine albumin was measured using nephelometry and indexed to urine creatinine.(29) Participants brought all medications to their study appointment. Trained study personnel recorded all medications, including use of estrogen.
Statistical Analysis
Univariate associations of clinical and demographic variables were compared across sex-specific tertiles of serum FGF-23 using ANOVA, Kruskal-Wallis, Chi Square, or Fisher’s Exact tests, as appropriate. Subsequently, participants were categorized into 3 groups on the basis of sex and estrogen therapy use (men, women not taking estrogen, and women taking estrogen). Linear regression was used to evaluate the associations of these sex/estrogen therapy categories (independent variables) with serum FGF-23, serum phosphorus, and TMP/GFR (dependent variables). Graphical methods demonstrated that FGF-23 was strongly right skewed, so levels were natural log transformed. The distribution of resulting transformed variable approximated a Gaussian distribution and was used as the dependent variable in linear regression models. The distributions of serum phosphorus and TMP/GFR were approximately Gaussian without transformation and were therefore evaluated on the natural scale. We initially evaluated unadjusted associations of the sex/estrogen therapy categories with Ln[ND2](FGF-23), serum phosphorus, and TMP/GFR. Subsequently, models were adjusted for confounders that were known correlates of FGF-23 a priori (age, race, eGFR, urine albumin-creatinine ratio, diabetes, hypertension, and BMI). To minimize the number of comparisons, we first compared nested adjusted models that did vs. did not include the 3-level sex/estrogen therapy variable using a likelihood ratio test. When statistically significant differences were detected, we evaluated pairwise differences between men, women not taking estrogen, and women taking estrogen, allowing women not taking estrogen to serve as the reference category. Subsequently, adjusted mean Ln(FGF-23), serum phosphorus, and TMP/GFR levels were calculated by setting all covariates at their geometric mean. Last, the adjusted mean Ln(FGF-23) level was exponentiated to back-calculate the adjusted mean FGF-23 level and associated 95% confidence intervals on the natural (not log-transformed) scale. We lacked data on menopausal status. Prior studies have demonstrated that > 99% of women are post-menopausal by age 57.(34) Thus, we performed subgroup analyses within the subset of 796 (80%) participants ≥ 57 years old. Last, we evaluated associations within strata by eGFR (> 90, 60–90, < 60ml/min/1.73m2) and evaluated a multiplicative interaction term of sex/ET categories * eGFR category. Last, to evaluate whether results might be biased by inaccurate 24-hour urine collections, we conducted a sensitivity analysis among the 645 subjects who had measurement of eGFR by cystatin C and 24-hour urine measured creatinine clearance that were concordant (within 30%), using methods described elsewhere.(30) P-values < 0.05 were considered statistically significant for all analyses including interaction terms, and analyses were performed using STATA version 11.0 SE (StataCorp LP, www.stata.com).
RESULTS
The mean age of the 987 person study sample was 67 ± 11 years. One hundred eighty-two (18%) were female, reflecting heavy sampling at a Veterans Affairs medical center. Among these women, 46 (25%) were taking estrogen. Compared to women taking estrogen, those not taking estrogen were similar in age, race/ethnicity, prevalence of diabetes, hypertension, and median urine albumin-creatinine ratio, but had lower BMI and higher eGFR (Table S1, available as online supplementary material). The mean eGFR was 71 ± 23 ml/min/1.73m2 (31% had eGFR < 60 ml/min/1.73m2), the median urine albumin-creatinine ratio was 8.8 mg/g (25th–75th percentile, 5.1–17.8) and 16% had albumin-creatinine ratios > 30mg/g. The mean serum phosphorus concentration was 3.7 ± 0.6 mg/dl (76 [8%] had levels > 4.5mg/dL), and median FGF-23 level was 43.1 (25th–75th percentile, 28.6–72.9) RU/ml. The TMP/GFR reflects the amount of phosphorus reabsorbed from the urinary space indexed to the level of GFR. Higher levels are indicative of greater reabsorption, and thus lower urinary phosphorus excretion, independent of the isotonicity of the urine or the eGFR. The mean TMP/GFR was 3.1 ± 0.8; similar to prior reports in community-living populations.(14)
Preliminary analyses demonstrated that FGF-23 levels differed significantly by sex (Median of 50.5 RU/ml in women and 41.2 RU/ml in men; P< 0.001). We therefore categorized participants into sex-specific tertiles of FGF-23 to facilitate separate bivariate comparisons. Compared to participants within the lowest FGF-23 tertile in both men and women, those with higher FGF-23 levels were more frequently Caucasian, hypertensive, had lower eGFR, and higher urine albumin-creatinine ratio and serum phosphorus levels (Table 1). TMP/GFR levels were similar across FGF-23 tertiles in both genders. Women with higher FGF-23 levels also had greater BMI. The unadjusted spearman rank correlation of serum phosphorus and FGF-23 was 0.14 in men and 0.29 in women (P< 0.001 for both).
Table 1.
Baseline Characteristics According to FGF-23 Tertile
| Variable | FGF-23 Level (RU/ml) | P-value Across Tertiles | ||
|---|---|---|---|---|
| < 37.9 (♀) | 37.9 – 82.4 (♀) | > 82.4 (♀) | ||
| <32.4 (♂) | 32.4 – 53.8 (♂) | > 53.8 (♂) | ||
| No. of Participants | ||||
| Men | 271 | 267 | 269 | |
| Women | 61 | 61 | 60 | |
| Age (years) | ||||
| Men | 67 ± 10 | 67 ± 10 | 68 ± 12 | 0.6 |
| Women | 65 ± 12 | 65 ± 10 | 63 ± 11 | 0.5 |
| Race | ||||
| Men | 0.02 | |||
| Caucasian | 169 (62) | 161 (60) | 178 (67) | |
| African-American | 36 (13) | 32 (12) | 46 (17) | |
| Other | 66 (24) | 74 (28) | 43 (16) | |
| Women | 0.01 | |||
| Caucasian | 22 (36) | 38 (62) | 29 (48) | |
| African-American | 18 (30) | 8 (13) | 20 (33) | |
| Other | 21 (34) | 15 (25) | 11 (18) | |
| Diabetes | ||||
| Men | 56 (21) | 76 (29) | 77 (29) | 0.06 |
| Women | 20 (12) | 16 (26) | 23 (38) | 0.07 |
| Hypertension | ||||
| Men | 175 (65) | 200 (75) | 184 (69) | 0.04 |
| Women | 38 (62) | 45 (74) | 52 (87) | 0.009 |
| BMI (kg/m2) | ||||
| Men | 27.3 (24.7, 30.4) | 27.7 (25.0, 31.4) | 27.1 (14.4, 30.4) | 0.5 |
| Women | 27.8 (25.4, 30.3) | 29.8 (24.9, 34.3) | 29.9 (26.3, 35.5) | 0.04 |
| eGFR (ml/min/1.73m2) | ||||
| Men | 78 ± 19 | 73 ± 22 | 59 ± 22 | < 0.001 |
| Women | 89 ± 19 | 77 ± 21 | 60 ± 23 | < 0.001 |
| UACR (mg/g)* | ||||
| Men | 7 (4, 14) | 8 (5, 15) | 12 (6, 30) | < 0.001 |
| Women | 10 (5, 17) | 8 (5, 14) | 19 (11, 78) | < 0.001 |
| Serum Phosphorus (mg/dL)* | ||||
| Men | 3.5 (3.2, 3.8) | 3.6 (3.3, 4.0) | 3.6 (3.2, 4.1) | < 0.001 |
| Women | 3.8 (3.6, 4.1) | 3.9 (3.6, 4.3) | 4.2 (3.9, 4.7) | < 0.01 |
| TMP/GFR* | ||||
| Men | 2.97 (2.59, 3.37) | 2.99 (2.64, 3.43) | 2.93 (2.49, 3.32) | 0.2 |
| Women | 3.58 (3.13, 3.93) | 3.56 (3.06, 3.98) | 3.64 (2.88, 4.25) | 0.6 |
Continuous data are shown as mean ± SD or median (25th, 75th percentile); categorical data as number (%). Conversion factor for serum phosphorus in mg/dL to mmol/L, x0.3229.
Abbreviations and definitions: BMI= body mass index; eGFR = estimated glomerular filtration rate; TMP/GFR=renal tubular maximum reabsorption rate of phosphate relative to the glomerular filtration rate; UACR, urine albumin-creatinine rate; FGF-23, fibroblast growth factor 23
Evaluated by Kruskal Wallis test.
Figure 1 shows the distribution of serum phosphorus, TMP/GFR, and FGF-23 in men, women not taking estrogen, and women taking estrogen. Compared to women not taking estrogen, the median serum phosphorus level was 0.4mg/dL lower in men, and 0.2mg/dL lower in and women taking estrogen (P<0.01 for both comparisons). A similar pattern was observed for TMP/GFR. Compared to women not taking estrogen, the median TMP/GFR was 19% lower in men and 5% lower in women taking estrogen (P< 0.05 for both comparisons). Last, we observed that FGF-23 levels consistently tracked with serum phosphorus levels. Compared to women not taking estrogen, median FGF-23 levels were 14.6 RU/ml (26%) lower in men, and 16.7 RU/ml (39%) lower in women taking estrogen (P < 0.001 for both comparisons).
Figure 1.
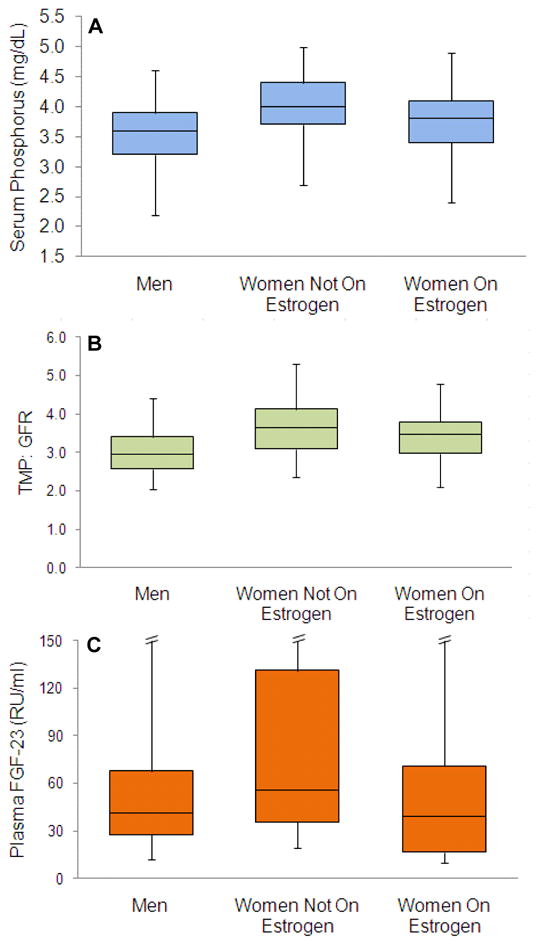
Median and Distribution of Serum Phosphorus (A), renal tubular maximum reabsorption of phosphorus indexed to GFR (TMP/GFR) (B), and FGF-23 (C) by Sex and Estrogen Therapy Use in 987 Hearth and Soul Study participants (807 men, 136 women not on HRT, and 46 women receiving hormone replacement therapy). Box plots show the boundaries of the 1st and 3rd quartile. The central line delineates the median. Error bars denote the boundaries of the 5th and 95th percentiles. P-values for respective comparisons to the women not on estrogen are provided in the unadjusted analyses in Table 2. Error bars are omitted for the 95th percentile for FGF-23 to improve presentation. These limits were 251 RU/ml in men, 784 RU/ml in women not taking hormone therapy, and 180RU/ml in women taking hormone therapy
After adjusting for age, race, diabetes, hypertension, body mass index, eGFR, and urine albumin-creatinine ratio, differences in serum phosphorus, FGF-23, and TMP/GFR levels persisted among men, women not taking estrogen, and women taking estrogen. In all cases, adjusted values were virtually identical to unadjusted values (Table 2).
Table 2.
Serum Phosphorus, TPM/GFR, and FGF-23 Levels by Sex and Estrogen Therapy Use
| Men | Women Not Taking Estrogen | Women Taking Estrogen | |
|---|---|---|---|
| No. of Participants | 807 | 136 | 46 |
| Serum Phosphorus (mg/dl) | |||
| Unadjusted | 3.60 (3.56–3.64)*** | 4.10 (4.00–4.19) | 3.75 (3.58–3.91)*** |
| Adjusted† | 3.60 (3.57–3.64)*** | 4.06 (3.96–4.16) | 3.73 (3.56–3.89)** |
| TMP/GFR | |||
| Unadjusted | 3.04 (2.99–3.10)*** | 3.68 (3.55–3.81) | 3.40 (3.18–3.61)* |
| Adjusted† | 3.06 (3.01–3.11)*** | 3.61 (3.49–3.74) | 3.29 (3.07–3.50)** |
| Plasma FGF-23 (RU/ml) | |||
| Unadjusted | 45.1 (42.1–47.9)*** | 70.8 (60.3–83.1) | 39.3 (30.0–51.9)*** |
| Adjusted† | 43.8 (41.2–46.5)*** | 68.7 (59.7–79.0) | 45.1 (35.2–57.4)** |
Note: Levels given as mean (95% CI). Across group P-values were < 0.001 in all cases. Conversion factor for serum phosphorus in mg/dL to mmol/L, x0.3229.
Adjusted for age, race (black, white, other), diabetes, hypertension, BMI, eGFR, Ln(UACR) Compared to women not taking ET,
P< 0.05;
P < 0.01;
P < 0.001.
Abbreviations and definitions: TMP/GFR=renal tubular maximum reabsorption rate of phosphate relative to the glomerular filtration rate; UACR, urine albumin-creatinine rate; FGF-23, fibroblast growth factor 23
We lacked data on menopausal status, but prior studies have demonstrated that by age 57 years or older, 99% of women are post-menopausal.(34) Thus, we conducted a subgroup analysis among the 796 (80%) participants ≥ 57 years of age. Results were similar in older and younger women (Interaction P = 0[ND3].1; Table 3). Results were also similar irrespective of eGFR strata (Interaction P =0.5) as demonstrated in Table 4. Last, in a sensitivity analysis designed to evaluate whether results might be influenced by accuracy of timed urine collections, we re-evaluated the adjusted mean serum phosphorus, TMP/GFR, and FGF-23 levels by sex and estrogen use among 645 participants who’s 24-hour urine measured creatinine clearance were within 30% of eGFR derived from serum cystatin C concentrations. Results were essentially unchanged (data not shown).
Table 3.
Serum Phosphorus, TPM/GFR, and FGF-23 Levels by Sex and Estrogen Therapy Use Among Participants > 57 Years Old†‡
| Men | Women Not Taking Estrogen | Women Taking Estrogen | |
|---|---|---|---|
| No. of Participants | 660 | 106 | 30 |
| Serum Phosphorus (mg/dl); | 3.56 (3.52–3.60)*** | 4.02 (3.92–4.12) | 3.83 (3.64–4.03) |
| TMP/GFR | 3.06 (3.00–3.12)*** | 3.64 (3.49–3.78) | 3.49 (3.23–3.75) |
| Plasma FGF-23 (RU/ml); | 43.0 (54.5–75.6)*** | 64.2 (54.5–75.6) | 53.2 (39.0–72.4) |
Note: Levels given as mean (95% CI). Conversion factor for serum phosphorus in mg/dL to mmol/L, x0.3229.
Adjusted for age, race (black, white, other), diabetes, hypertension, BMI, eGFR, Ln(UACR)
Across group P-values were < 0.001 in all cases.
Compared to women not taking ET,
P< 0.05;
P < 0.01;
P < 0.001.
Abbreviations and definitions: TMP/GFR=renal tubular maximum reabsorption rate of phosphate relative to the glomerular filtration rate; UACR, urine albumin-creatinine rate; FGF-23, fibroblast growth factor 23
Table 4.
Serum Phosphorus, TPM/GFR, and FGF-23 Levels by Sex and Estrogen Therapy Use Stratified by eGFR Category†‡
| eGFR Category | Men | Women Not Taking Estrogen | Women Taking Estrogen |
|---|---|---|---|
| ≥ 90 ml/min/1.73m2 | |||
| No. of Participants | 142 | 31 | 15 |
| Serum Phosphorus (mg/dl); | 3.64 (3.44–37.2)*** | 4.05 (3.87–4.22) | 3.77 (3.50–4.03) |
| TMP/GFR†; | 3.31 (3.18–3.44)** | 3.85 (3.58–4.12) | 3.51 (3.11–3.91) |
| Plasma FGF-23 (RU/ml); | 32.9 (29.4–36.7)* | 44.7 (35.3–56.7) | 21.5 (15.2–30.5)** |
| 60–89 ml/min/1.73m2 | |||
| No. of Participants | 407 | 65 | 23 |
| Serum Phosphorus (mg/dl); | 3.55 (3.49–3.60)*** | 3.93 (3.80–4.07) | 3.62 (3.38–3.85)* |
| TMP/GFR† | 3.06 (2.99–3.13)*** | 3.52 (3.35–3.69) | 3.35 (3.06–3.65) |
| Plasma FGF-23 (RU/ml); | 3.59 (3.51–3.67)*** | 4.09 (3.89–4.29) | 3.70 (3.35–4.04) |
| < 60 ml/min/1.73m2 | |||
| No. of Participants | 258 | 40 | 8 |
| Serum Phosphorus (mg/dl); | 3.69 (3.61–3.76)*** | 4.27 (4.07–4.48) | 3.71 (3.31–4.12)* |
| TMP/GFR† | 2.91 (2.82–3.00)*** | 3.64 (3.38–3.89) | 3.01 (2.52–3.50)* |
| Plasma FGF-23 (RU/ml); | 71.7 (64.4–79.9)** | 114.9 (84.8–156.9) | 89.1 (49.1–161.5) |
Note: Levels given as mean (95% CI). Conversion factor for units: serum phosphorus in mg/dL to mmol/L, x0.3229; eGFR in ml/min/1.73 m2 to ml/s/1.73 m2, x0.01667.
Adjusted for age, race (black, white, other), diabetes, hypertension, BMI, eGFR, Ln(UACR)
Across group P-values were < 0.05 in all cases.
Compared to women taking ET,
P< 0.05;
P < 0.01;
P < 0.001
Abbreviations and definitions: eGFR, estimated glomerular filtration rate; TMP/GFR=renal tubular maximum reabsorption rate of phosphate relative to the glomerular filtration rate; UACR, urine albumin-creatinine rate; FGF-23, fibroblast growth factor 23
DISCUSSION
The main findings of this study are that serum FGF-23 levels are higher in older women than in similarly aged men. This sex difference was not apparent in women using estrogen. Higher FGF-23 consistently tracked with higher serum phosphorus levels and higher TMP/GFR (lower urine phosphorus excretion). These findings may provide new insights to mechanisms of phosphorus homeostasis in older community-living individuals, predominantly with normal kidney function.
A body of literature spanning from laboratory animals to epidemiologic studies are all consistent in demonstrating that estradiol induces phosphaturia. Renal regulation of phosphorus occurs mainly by actionof the sodium phosphate cotransporter type IIa (NaPi-IIa) in the proximal convoluted tubule.(35–37) Faroqui and colleagues showed that treating rats with estradiol results in less NaPi-IIa mRNA and protein, and consequent increases in urinary phosphorus excretion and lower serum phosphorus levels.(17) In a large sample of community-living older men, we observed that endogenous estradiol levels were inversely associated with serum phosphorus levels independent of kidney function, PTH, 25 hydroxyvitamin D, or FGF-23 levels.(38) Small randomized clinical trials and cross-over studies that evaluated estrogen therapy in post-menopausal women consistently show that estrogen induced lower serum phosphorus levels and greater urine phosphorus excretion compared to the placebo arm or pre-treatment levels, respectively.(16, 18–20) Results are similar in observational studies evaluating changes in phosphorus homeostasis that occur with a natural menopause. For example, in a study that enrolled over 4,500 community-dwelling Italians of broadly diverse ages, women had similar phosphorus levels to men until age 45–54, when serum phosphorus levels rapidly declined, along with urinary phosphorus excretion.(14)
In the present study we also observed that older women who were not taking estrogen had higher phosphorus level and lower urine phosphorus excretion than men, and conversely that estrogen using women had lower serum phosphorus levels and greater urine phosphorus excretion. Because men derive estradiol from testosterone, it is established that men have serum estradiol levels that are several fold higher than post-menopausal women, and when post-menopausal women take estrogen, their serum estradiol levels return to levels similar to men.(39, 40) Therefore, our findings in regards to serum and urine phosphorus are consistent with the existing literature, and are likely caused by changes in renal regulation of phosphorus due to differences in estradiol between men and women, and women on or off estrogen therapy, respectively. While there is general consensus that estradiol induces renal phosphorus excretion, whether or not this is a direct or indirect effect remains an area of controversy.(17, 41)
It is possible that the phosphaturic response to estradiol may reflect a direct effect of estradiol on renal proximal tubule cells. Estrogen receptors are present in the renal proximal tubule, where urine phosphorus excretion is regulated. However, most direct estrogen effects in other tissues are mediated through ERα or ERβ (nuclear estrogen receptors α or β). In the rodent study by Faroqui discussed previously, co-administering estradiol with a compound that blocks ERα did not abate the phosphaturic properties of estradiol. Blockade of ERβ was not evaluated.(17) Thus, direct effects of estradiol on renal phosphorus regulation remain possible, however, it is also possible that the effect may be mediated indirectly, potentially through estradiol effects on other phosphaturic hormones.
The mechanism of estradiol induced phosphaturia is likely independent of intact parathyroid hormone. Despite consistent demonstration of increases in serum phosphorus after menopause, multiple studies have reported little or no change in intact parathyroid hormone after menopause.(42, 43) Moreover, the rat study by Faroqui and colleagues discussed previously demonstrated that estradiol induced phosphaturia in rats that had been parathyroidectomized.(17)
The primary source of FGF-23 is from bone. Carrillo-Lopez recently reported that estradiol administration led to greater bone FGF-23 production in a rodent CKD model.(44) Thus, as estradiol levels decline after menopause, FGF-23 production may fall, resulting in less of a stimulus for urine phosphorus excretion, thereby leading to phosphorus retention and higher post-menopausal serum phosphorus levels. Under this hypothesis, one would anticipate lower FGF-23 levels in older women not taking estrogen compared to men or women taking estrogen. On the contrary, we found that women who were not taking estrogen had higher FGF-23 levels than women who were using estrogen, or men. Thus, our findings, compared to those in a rodent CKD model by Carrillo-Lopez remain, at present, irreconcilable.
In our study, FGF-23 levels consistently tracked with serum phosphorus levels. Rather than low FGF-23 levels being the cause of higher serum phosphorus levels, our finding suggests that serum FGF-23 levels may be increased as a compensatory response to higher serum phosphorus levels and lower urine phosphorus excretion. Indeed, prior studies in healthy volunteers have demonstrated that serum FGF-23 levels increase in response to several days of oral phosphorus loading.(45) Thus, while this study cannot differentiate whether estradiol is directly inducing phosphaturia or whether the association is mediated through indirect pathways, our findings suggest that a declining level of FGF-23 after menopause is unlikely to be the dominant pathway leading to higher serum phosphorus levels in older women.
If future studies confirm that menopause is associated with higher FGF-23 levels, this finding may have important implications for studies of CVD and bone disease. We have shown that higher FGF-23 levels are strongly and independently associated with CVD events and all-cause mortality in individuals with normal kidney function.(22) If FGF-23 levels are confirmed to increase after menopause, they may contribute to the acceleration in CVD risk that occurs after menopause in women.(46) FGF-23 also inhibits conversion of 25 hydroxyvitamin D to calcitriol.(21) Calcitriol deficiency is common in osteoporotic women and exacerbates post-menopausal bone loss.(47–50) A recent study demonstrated that higher FGF-23 concentrations were associated with incident fractures in older men.(51) Whether increases in FGF-23 may contribute to bone loss and osteoporosis, and whether such effects may be the consequences of calcitriol deficiency induced by high FGF-23 after menopause in women is an important question for future research.
Strengths of this study include its relatively large sample size, availability of blood and 24-hour timed urine specimens, and simultaneous measurements of serum phosphorus, FGF-23, and TMP/GFR. The study also has important limitations. It had a cross-section design and estrogen therapy was not randomized or concealed. Future studies are required to evaluate repeated measurements of FGF-23 within individual women before, during, and after menopause to determine the trajectory of FGF-23. Moreover, FGF-23 should be measured in stored specimens from studies that randomly assigned women to estrogen vs. placebo. Such studies might establish a causal role of estradiol in influencing FGF-23 concentrations. In our study, the percentage of women, and among them, the number taking ET was relatively small. Moreover, the vast majority were of post-menopausal age. Nonetheless, we observed marked and statistically significant differences in serum FGF-23 levels by sex and estrogen therapy. Intact parathyroid hormone and 25 hydroxyvitamin D were not available in this study, yet prior studies in animals demonstrate that estrogen-induced changes in phosphorus homeostasis were independent of intact parathyroid hormone,(17) and prior epidemiologic studies have not demonstrated differences in parathyroid hormone or 25 hydroxyvitamin D as women transition through menopause.(42, 48, 52) Prevalent CVD was an enrollment criterion. Whether or not the results generalize to other settings is as yet unknown.
In conclusion, in community-living individuals with prevalent CVD and a range of kidney function from normal to moderate CKD, older women who are not taking estrogen have higher FGF-23 levels than either women who were taking estrogen, or men. Similar patterns were observed for serum phosphorus and TMP/GFR. In the context of prior studies, these data suggest that FGF-23 levels may be elevated in response to post-menopausal phosphorus retention, and that FGF-23 is unlikely to be the dominant factor leading to high phosphorus after menopause. Future studies should evaluate whether higher post-menopausal FGF-23 levels contribute to CVD risk and bone loss in post-menopausal women.
Supplementary Material
Table S1: Baseline characteristics comparing women taking versus not taking estrogen.
Acknowledgments
Support: This study was supported by grants from the National Heart Lung and Blood Institute (NHLBI: R01 HL096851), American Heart Association (AHA 0575021N) and the Sandra Daugherty Foundation to Dr. Ix. The Heart and Soul Study was supported by the Department of Veterans Epidemiology Merit Review Program, the Department of Veterans Affairs Health Services Research and Development service, the NHLBI (R01 HL079235), the American Federation for Aging Research (Paul Beeson Scholars Program), the Robert Wood Johnson Foundation (Generalist Physician Faculty Scholars Program), and the Ischemia Research and Education Foundation.
Footnotes
Financial Disclosure: The authors declare that they have no relevant financial interests.
Publisher's Disclaimer: This is a PDF file of an unedited manuscript that has been accepted for publication. As a service to our customers we are providing this early version of the manuscript. The manuscript will undergo copyediting, typesetting, and review of the resulting proof before it is published in its final citable form. Please note that during the production process errors may be discovered which could affect the content, and all legal disclaimers that apply to the journal pertain.
References
- 1.Jono S, McKee MD, Murry CE, Shioi A, Nishizawa Y, Mori K, Morii H, Giachelli CM. Phosphate regulation of vascular smooth muscle cell calcification. Circ Res. 2000;87:E10–17. doi: 10.1161/01.res.87.7.e10. [DOI] [PubMed] [Google Scholar]
- 2.Block GA, Klassen PS, Lazarus JM, Ofsthun N, Lowrie EG, Chertow GM. Mineral metabolism, mortality, and morbidity in maintenance hemodialysis. J Am Soc Nephrol. 2004;15:2208–2218. doi: 10.1097/01.ASN.0000133041.27682.A2. [DOI] [PubMed] [Google Scholar]
- 3.Chertow GM, Raggi P, Chasan-Taber S, Bommer J, Holzer H, Burke SK. Determinants of progressive vascular calcification in haemodialysis patients. Nephrol Dial Transplant. 2004;19:1489–1496. doi: 10.1093/ndt/gfh125. [DOI] [PubMed] [Google Scholar]
- 4.Criqui MH, Kamineni A, Allison MA, Ix JH, Carr JJ, Cushman M, Detrano R, Post W, Wong ND. Risk factor differences for aortic versus coronary calcified atherosclerosis: the multiethnic study of atherosclerosis. Arterioscler Thromb Vasc Biol. 30:2289–2296. doi: 10.1161/ATVBAHA.110.208181. [DOI] [PMC free article] [PubMed] [Google Scholar]
- 5.Foley RN, Collins AJ, Herzog CA, Ishani A, Kalra PA. Serum phosphorus levels associate with coronary atherosclerosis in young adults. J Am Soc Nephrol. 2009;20:397–404. doi: 10.1681/ASN.2008020141. [DOI] [PMC free article] [PubMed] [Google Scholar]
- 6.Tuttle KR, Short RA. Longitudinal relationships among coronary artery calcification, serum phosphorus, and kidney function. Clin J Am Soc Nephrol. 2009;4:1968–1973. doi: 10.2215/CJN.01250209. [DOI] [PMC free article] [PubMed] [Google Scholar]
- 7.Ix JH, De Boer IH, Peralta CA, Adeney KL, Duprez DA, Jenny NS, Siscovick DS, Kestenbaum BR. Serum phosphorus concentrations and arterial stiffness among individuals with normal kidney function to moderate kidney disease in MESA. Clin J Am Soc Nephrol. 2009;4:609–615. doi: 10.2215/CJN.04100808. [DOI] [PMC free article] [PubMed] [Google Scholar]
- 8.Kendrick J, Ix JH, Targher G, Smits G, Chonchol M. Relation of serum phosphorus levels to ankle brachial pressure index (from the Third National Health and Nutrition Examination Survey) Am J Cardiol. 106:564–568. doi: 10.1016/j.amjcard.2010.03.070. [DOI] [PMC free article] [PubMed] [Google Scholar]
- 9.Meng J, Wassel CL, Kestenbaum BR, Collins TC, Criqui MH, Lewis CE, Cummings SR, Ix JH. Serum phosphorus levels and the spectrum of ankle-brachial index in older men: the Osteoporotic Fractures in Men (MrOS) study. Am J Epidemiol. 171:909–916. doi: 10.1093/aje/kwq020. [DOI] [PMC free article] [PubMed] [Google Scholar]
- 10.Dhingra R, Sullivan LM, Fox CS, Wang TJ, D’Agostino RB, Sr, Gaziano JM, Vasan RS. Relations of serum phosphorus and calcium levels to the incidence of cardiovascular disease in the community. Arch Intern Med. 2007;167:879–885. doi: 10.1001/archinte.167.9.879. [DOI] [PubMed] [Google Scholar]
- 11.Foley RN, Collins AJ, Ishani A, Kalra PA. Calcium-phosphate levels and cardiovascular disease in community-dwelling adults: the Atherosclerosis Risk in Communities (ARIC) Study. Am Heart J. 2008;156:556–563. doi: 10.1016/j.ahj.2008.05.016. [DOI] [PubMed] [Google Scholar]
- 12.Tonelli M, Sacks F, Pfeffer M, Gao Z, Curhan G. Relation between serum phosphate level and cardiovascular event rate in people with coronary disease. Circulation. 2005;112:2627–2633. doi: 10.1161/CIRCULATIONAHA.105.553198. [DOI] [PubMed] [Google Scholar]
- 13.de Boer IH, Rue TC, Kestenbaum B. Serum phosphorus concentrations in the third National Health and Nutrition Examination Survey (NHANES III) Am J Kidney Dis. 2009;53:399–407. doi: 10.1053/j.ajkd.2008.07.036. [DOI] [PMC free article] [PubMed] [Google Scholar]
- 14.Cirillo M, Ciacci C, De Santo NG. Age, renal tubular phosphate reabsorption, and serum phosphate levels in adults. N Engl J Med. 2008;359:864–866. doi: 10.1056/NEJMc0800696. [DOI] [PubMed] [Google Scholar]
- 15.Onufrak SJ, Bellasi A, Cardarelli F, Vaccarino V, Muntner P, Shaw LJ, Raggi P. Investigation of gender heterogeneity in the associations of serum phosphorus with incident coronary artery disease and all-cause mortality. Am J Epidemiol. 2009;169:67–77. doi: 10.1093/aje/kwn285. [DOI] [PMC free article] [PubMed] [Google Scholar]
- 16.Adami S, Gatti D, Bertoldo F, Rossini M, Fratta-Pasini A, Zamberlan N, Facci E, Lo Cascio V. The effects of menopause and estrogen replacement therapy on the renal handling of calcium. Osteoporos Int. 1992;2:180–185. doi: 10.1007/BF01623924. [DOI] [PubMed] [Google Scholar]
- 17.Faroqui S, Levi M, Soleimani M, Amlal H. Estrogen downregulates the proximal tubule type IIa sodium phosphate cotransporter causing phosphate wasting and hypophosphatemia. Kidney Int. 2008;73:1141–1150. doi: 10.1038/ki.2008.33. [DOI] [PMC free article] [PubMed] [Google Scholar]
- 18.Stock JL, Coderre JA, Mallette LE. Effects of a short course of estrogen on mineral metabolism in postmenopausal women. J Clin Endocrinol Metab. 1985;61:595–600. doi: 10.1210/jcem-61-4-595. [DOI] [PubMed] [Google Scholar]
- 19.Stock JL, Coderre JA, Posillico JT. Effects of estrogen on mineral metabolism in postmenopausal women as evaluated by multiple assays measuring parathyrin bioactivity. Clin Chem. 1989;35:18–22. [PubMed] [Google Scholar]
- 20.Uemura H, Irahara M, Yoneda N, Yasui T, Genjida K, Miyamoto KI, Aono T, Takeda E. Close correlation between estrogen treatment and renal phosphate reabsorption capacity. J Clin Endocrinol Metab. 2000;85:1215–1219. doi: 10.1210/jcem.85.3.6456. [DOI] [PubMed] [Google Scholar]
- 21.Liu S, Quarles LD. How fibroblast growth factor 23 works. J Am Soc Nephrol. 2007;18:1637–1647. doi: 10.1681/ASN.2007010068. [DOI] [PubMed] [Google Scholar]
- 22.Parker BD, Schurgers LJ, Brandenburg VM, Christenson RH, Vermeer C, Ketteler M, Shlipak MG, Whooley MA, Ix JH. The associations of fibroblast growth factor 23 and uncarboxylated matrix Gla protein with mortality in coronary artery disease: the Heart and Soul Study. Ann Intern Med. 152:640–648. doi: 10.1059/0003-4819-152-10-201005180-00004. [DOI] [PMC free article] [PubMed] [Google Scholar]
- 23.Isakova T, Wahl P, Vargas GS, Gutierrez OM, Scialla J, Xie H, Appleby D, Nessel L, Bellovich K, Chen J, Hamm L, Gadegbeku C, Horwitz E, Townsend RR, Anderson CA, Lash JP, Hsu CY, Leonard MB, Wolf M. Fibroblast growth factor 23 is elevated before parathyroid hormone and phosphate in chronic kidney disease. Kidney Int. doi: 10.1038/ki.2011.47. [DOI] [PMC free article] [PubMed] [Google Scholar]
- 24.Ruo B, Rumsfeld J, Hlatky M, Liu H, Browner W, Whooley M. Depressive symptoms and health-related quality of life: the Heart and Soul Study. JAMA. 2003;2:215–221. doi: 10.1001/jama.290.2.215. [DOI] [PMC free article] [PubMed] [Google Scholar]
- 25.Jonsson KB, Zahradnik R, Larsson T, White KE, Sugimoto T, Imanishi Y, Yamamoto T, Hampson G, Koshiyama H, Ljunggren O, Oba K, Yang IM, Miyauchi A, Econs MJ, Lavigne J, Juppner H. Fibroblast growth factor 23 in oncogenic osteomalacia and Xlinked hypophosphatemia. N Engl J Med. 2003;348:1656–1663. doi: 10.1056/NEJMoa020881. [DOI] [PubMed] [Google Scholar]
- 26.Juppner H, Wolf M, Salusky IB. FGF-23: More than a regulator of renal phosphate handling? J Bone Miner Res. 25:2091–2097. doi: 10.1002/jbmr.170. [DOI] [PMC free article] [PubMed] [Google Scholar]
- 27.Wesseling-Perry K, Pereira RC, Wang H, Elashoff RM, Sahney S, Gales B, Juppner H, Salusky IB. Relationship between plasma fibroblast growth factor-23 concentration and bone mineralization in children with renal failure on peritoneal dialysis. J Clin Endocrinol Metab. 2009;94:511–517. doi: 10.1210/jc.2008-0326. [DOI] [PMC free article] [PubMed] [Google Scholar]
- 28.Fliser D, Kollerits B, Neyer U, Ankerst DP, Lhotta K, Lingenhel A, Ritz E, Kronenberg F, Kuen E, Konig P, Kraatz G, Mann JF, Muller GA, Kohler H, Riegler P. Fibroblast growth factor 23 (FGF23) predicts progression of chronic kidney disease: the Mild to Moderate Kidney Disease (MMKD) Study. J Am Soc Nephrol. 2007;18:2600–2608. doi: 10.1681/ASN.2006080936. [DOI] [PubMed] [Google Scholar]
- 29.Ix JH, Chertow GM, Shlipak MG, Brandenburg VM, Ketteler M, Whooley MA. Fetuin-A and kidney function in persons with coronary artery disease--data from the heart and soul study. Nephrol Dial Transplant. 2006;21:2144–2151. doi: 10.1093/ndt/gfl204. [DOI] [PMC free article] [PubMed] [Google Scholar]
- 30.Ix JH, de Boer IH, Wassel CL, Criqui MH, Shlipak MG, Whooley MA. Urinary creatinine excretion rate and mortality in persons with coronary artery disease: the Heart and Soul Study. Circulation. 121:1295–1303. doi: 10.1161/CIRCULATIONAHA.109.924266. [DOI] [PMC free article] [PubMed] [Google Scholar]
- 31.Barth JH, Jones RG, Payne RB. Calculation of renal tubular reabsorption of phosphate: the algorithm performs better than the nomogram. Ann Clin Biochem. 2000;37 ( Pt 1):79–81. doi: 10.1258/0004563001901371. [DOI] [PubMed] [Google Scholar]
- 32.Ix JH, Shlipak MG, Chertow GM, Whooley MA. Association of cystatin C with mortality, cardiovascular events, and incident heart failure among persons with coronary heart disease: data from the Heart and Soul Study. Circulation. 2007;115:173–179. doi: 10.1161/CIRCULATIONAHA.106.644286. [DOI] [PMC free article] [PubMed] [Google Scholar]
- 33.Stevens LA, Coresh J, Schmid CH, Feldman HI, Froissart M, Kusek J, Rossert J, Van Lente F, Bruce RD, 3rd, Zhang YL, Greene T, Levey AS. Estimating GFR using serum cystatin C alone and in combination with serum creatinine: a pooled analysis of 3,418 individuals with CKD. Am J Kidney Dis. 2008;51:395–406. doi: 10.1053/j.ajkd.2007.11.018. [DOI] [PMC free article] [PubMed] [Google Scholar]
- 34.Krailo MD, Pike MC. Estimation of the distribution of age at natural menopause from prevalence data. Am J Epidemiol. 1983;117:356–361. doi: 10.1093/oxfordjournals.aje.a113548. [DOI] [PubMed] [Google Scholar]
- 35.Forster IC, Hernando N, Biber J, Murer H. Proximal tubular handling of phosphate: A molecular perspective. Kidney Int. 2006;70:1548–1559. doi: 10.1038/sj.ki.5001813. [DOI] [PubMed] [Google Scholar]
- 36.Beck L, Karaplis AC, Amizuka N, Hewson AS, Ozawa H, Tenenhouse HS. Targeted inactivation of Npt2 in mice leads to severe renal phosphate wasting, hypercalciuria, and skeletal abnormalities. Proc Natl Acad Sci U S A. 1998;95:5372–5377. doi: 10.1073/pnas.95.9.5372. [DOI] [PMC free article] [PubMed] [Google Scholar]
- 37.Hoag HM, Martel J, Gauthier C, Tenenhouse HS. Effects of Npt2 gene ablation and low-phosphate diet on renal Na(+)/phosphate cotransport and cotransporter gene expression. J Clin Invest. 1999;104:679–686. doi: 10.1172/JCI7103. [DOI] [PMC free article] [PubMed] [Google Scholar]
- 38.Meng J, Ohlsson C, Laughlin GA, Chonchol M, Wassel CL, Ljunggren O, Karlsson MK, Mellstrom D, Orwoll ES, Barrett–Connor E, Ix JH. Associations of estradiol and testosterone with serum phosphorus in older men: the Osteoporotic Fractures in Men study. Kidney Int. doi: 10.1038/ki.2010.161. [DOI] [PMC free article] [PubMed] [Google Scholar]
- 39.Laughlin GA, Barrett-Connor E, May S. Sex-specific association of the androgen to oestrogen ratio with adipocytokine levels in older adults: the Rancho Bernardo Study. Clin Endocrinol (Oxf) 2006;65:506–513. doi: 10.1111/j.1365-2265.2006.02624.x. [DOI] [PubMed] [Google Scholar]
- 40.Laughlin GA, Barrett-Connor E, May S. Sex-specific determinants of serum adiponectin in older adults: the role of endogenous sex hormones. Int J Obes (Lond) 2007;31:457–465. doi: 10.1038/sj.ijo.0803427. [DOI] [PubMed] [Google Scholar]
- 41.Meng J, Ohlsson C, Laughlin GA, Chonchol M, Wassel CL, Ljunggren O, Karlsson MK, Mellstrom D, Orwoll ES, Barrett-Connor E, Ix JH. Associations of estradiol and testosterone with serum phosphorus in older men: the Osteoporotic Fractures in Men study. Kidney Int. 78:415–422. doi: 10.1038/ki.2010.161. [DOI] [PMC free article] [PubMed] [Google Scholar]
- 42.Prince RL, Dick I, Devine A, Price RI, Gutteridge DH, Kerr D, Criddle A, Garcia-Webb P, St John A. The effects of menopause and age on calcitropic hormones: a crosssectional study of 655 healthy women aged 35 to 90. J Bone Miner Res. 1995;10:835–842. doi: 10.1002/jbmr.5650100602. [DOI] [PubMed] [Google Scholar]
- 43.Need AG, O’Loughlin PD, Morris HA, Horowitz M, Nordin BE. The effects of age and other variables on serum parathyroid hormone in postmenopausal women attending an osteoporosis center. J Clin Endocrinol Metab. 2004;89:1646–1649. doi: 10.1210/jc.2003-031539. [DOI] [PubMed] [Google Scholar]
- 44.Carrillo-Lopez N, Roman-Garcia P, Rodriguez-Rebollar A, Fernandez-Martin JL, Naves-Diaz M, Cannata-Andia JB. Indirect regulation of PTH by estrogens may require FGF23. J Am Soc Nephrol. 2009;20:2009–2017. doi: 10.1681/ASN.2008121258. [DOI] [PMC free article] [PubMed] [Google Scholar]
- 45.Antoniucci DM, Yamashita T, Portale AA. Dietary phosphorus regulates serum fibroblast growth factor-23 concentrations in healthy men. J Clin Endocrinol Metab. 2006;91:3144–3149. doi: 10.1210/jc.2006-0021. [DOI] [PubMed] [Google Scholar]
- 46.Thom T, Haase N, Rosamond W, Howard VJ, Rumsfeld J, Manolio T, Zheng ZJ, Flegal K, O’Donnell C, Kittner S, Lloyd-Jones D, Goff DC, Jr, Hong Y, Adams R, Friday G, Furie K, Gorelick P, Kissela B, Marler J, Meigs J, Roger V, Sidney S, Sorlie P, Steinberger J, Wasserthiel-Smoller S, Wilson M, Wolf P. Heart disease and stroke statistics--2006 update: a report from the American Heart Association Statistics Committee and Stroke Statistics Subcommittee. Circulation. 2006;113:e85–151. doi: 10.1161/CIRCULATIONAHA.105.171600. [DOI] [PubMed] [Google Scholar]
- 47.Gallagher JC, Fowler SE, Detter JR, Sherman SS. Combination treatment with estrogen and calcitriol in the prevention of age-related bone loss. J Clin Endocrinol Metab. 2001;86:3618–3628. doi: 10.1210/jcem.86.8.7703. [DOI] [PubMed] [Google Scholar]
- 48.Gallagher JC, Riggs BL, Eisman J, Hamstra A, Arnaud SB, DeLuca HF. Intestinal calcium absorption and serum vitamin D metabolites in normal subjects and osteoporotic patients: effect of age and dietary calcium. J Clin Invest. 1979;64:729–736. doi: 10.1172/JCI109516. [DOI] [PMC free article] [PubMed] [Google Scholar]
- 49.Lore F, Nuti R, Vattimo A, Caniggia A. Vitamin D metabolites in postmenopausal osteoporosis. Horm Metab Res. 1984;16:58. doi: 10.1055/s-2007-1014696. [DOI] [PubMed] [Google Scholar]
- 50.Lund B, Sorensen OH, Agner E. Serum 1,25-dihydroxyvitamin D in normal subjects and in patients with postmenopausal osteopenia. Influence of age, renal function and oestrogen therapy. Horm Metab Res. 1982;14:271–274. doi: 10.1055/s-2007-1018990. [DOI] [PubMed] [Google Scholar]
- 51.Mirza MA, Karlsson MK, Mellstrom D, Orwoll E, Ohlsson C, Ljunggren O, Larsson TE. Serum fibroblast growth factor-23 (FGF23) and fracture risk in elderly men. J Bone Miner Res. doi: 10.1002/jbmr.263. [DOI] [PubMed] [Google Scholar]
- 52.Hartwell D, Riis BJ, Christiansen C. Changes in vitamin D metabolism during natural and medical menopause. J Clin Endocrinol Metab. 1990;71:127–132. doi: 10.1210/jcem-71-1-127. [DOI] [PubMed] [Google Scholar]
Associated Data
This section collects any data citations, data availability statements, or supplementary materials included in this article.
Supplementary Materials
Table S1: Baseline characteristics comparing women taking versus not taking estrogen.