

Abstract
Fundamental advances in secondary ion mass spectrometry (SIMS) now allow for the examination and characterization of lipids directly from biological materials. The successful application of SIMS-based imaging in the investigation of lipids directly from tissue and cells are demonstrated. Common complications and technical pitfalls are discussed. In this review, we examine the use of cluster ion sources and cryogenically compatible sample handling for improved ion yields and to expand the application potential of SIMS. Methodological improvements, including pre-treating the sample to improve ion yields and protocol development for 3-dimensional analyses (i.e. molecular depth profiling), are also included in this discussion. New high performance SIMS instruments showcasing the most advanced instrumental developments, including tandem MS capabilities and continuous ion beam compatibility, are described and the future direction for SIMS in lipid imaging is evaluated.
Keywords: ToF-SIMS, lipids, cluster sources, sample preparation, C60+QSTAR, J105 3D Chemical Imager and imaging mass spectrometry (IMS)
1. Introduction
Time-of-flight secondary ion mass spectrometry (ToF-SIMS) is a surface analysis technique capable of producing high resolution chemical images and is a well-suited platform for the analysis of lipids directly from the surface of biological materials. With this technique the sample surface is bombarded with a focused high energy primary ion beam (1–40 keV), causing desorption of secondary ions. A mass spectrometry-based image is then produced by rastering the ion beam across the sample surface. The high lateral resolution and sensitivity attributed to SIMS allows for the detection of lipid molecules at the nanometer scale and at attomolar concentrations [1, 2]. The ToF detection scheme also offers parallel detection of multiple lipid species, ideal for the analysis of complex biological samples.
In addition to ToF-SIMS, matrix-assisted laser desorption ionization (MALDI) and desorption electrospray ionization (DESI) are imaging mass spectrometry (IMS) techniques utilized in the analysis of biological materials. Like ToF-SIMS, MALDI [3–6] and DESI [7–18] have proven to be particularly successful in the detection and analysis of lipids. The pitfalls, advantages and successful applications of each technique are reviewed in detail elsewhere and are only briefly discussed in this review [19–24]. In terms of spatial resolution, MALDI and DESI are capable of resolving features as small as 20 μm and 100 μm, respectively. In many cases for tissue imaging, ToF-SIMS offers a complementary perspective to these alternative IMS techniques since the lateral resolution of ToF-SIMS can be below 1 micron (Fig. 1). Various efforts have been made to improve the spatial resolution of MALDI imaging, including oversampling [25], laser modulation [26] (i.e. smart beam technology) and solvent-free sublimation matrix application techniques [27]. Despite these efforts, the technique has not achieved the spatial resolution of ToF-SIMS.
Fig. 1.
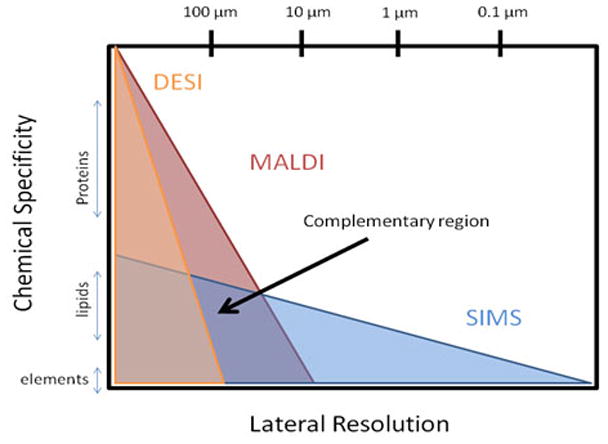
The diagram describes overlaps and unique areas of MALDI, DESI and SIMS. Lipids are detectable in all three methodologies.
In terms of chemical specificity, however, MALDI and DESI techniques cover a broader range of biomolecules—including proteins, peptides and nucleotides. The ability to detect proteins and peptides directly correlates to the techniques’ success in bio-analytical chemistry and biomedicine. Currently, MALDI is the prominent IMS method utilized in medical and bioanalytical research with applications in clinical diagnostics [28–32], pharmaceutical research[33] and biomarker discovery [34]. Although proteins represent only 20 % (by weight) of a cell, proteomics has traditionally been at the heart of biomedical investigations. However, a recent trend among system biologists from proteomics to lipidomics [35] raises the question: Will SIMS, with its higher spatial resolution and equivalent sensitivity to lipids, be more readily accepted into the biochemical and biomedical community?
2. Sample preparation
Well-developed sample preparation techniques are crucial for successful ToF-SIMS investigations. The major challenge in proper sample preparation is interfacing the biological samples with biologically unfavorable vacuum conditions while preserving chemical and spatial integrity. A variety of protocols for both tissue and cellular samples have been established; the most frequently employed procedures are reviewed below. In general these techniques contain steps in which the tissue samples are fixed, sectioned, mounted, and dried; a majority of these protocols were derived from established histological sample preparation techniques. Other techniques include ones where cellular samples are fixed and analyzed in a frozen hydrated state.
2.1 Cryofixation
To minimize sample degradation, fixation efforts are required immediately after the sample has been extracted from the specimen or culture media. Traditional chemical-based fixation techniques should be avoided especially for lipid-based analyzes; the consequences of such procedures were examined by Malm and co-workers [36]. Instead, plunge freezing, a cryogenic-based fixation technique, is employed to preserve the integrity of the sample. In plunge freezing, the sample is submerged in liquid propane (85 K) or ethane (89 K) and subsequently transferred and stored in liquid nitrogen (77 K). The low temperature and high heat capacity of these liquid hydrocarbons cools the sample fast enough to transition the sample’s water content to amorphous ice. In this process, the formation of ice crystals responsible for disrupting sample morphology and causing molecular displacement is avoided. Compared to chemical treatments, plunge-frozen samples produce higher phospholipid molecular-ion signals and retain the native distribution of diffusible ions, such as Na+, K+ and Ca+ [36].
2.2. Cryosectioning and freeze-drying
After freeze-fixation, tissue samples are typically sectioned, mounted, and freeze-dried before analysis. During cryosectioning, the sample is brought to −20º C and sliced into 10–50 μm thick sections. Tissue sections are commonly thaw-mounted to a substrate—typically a conductive indium tinoxide (ITO) coated glass microscope slides or a metal sample plate. Occasionally, a cryoprotectant agent, (e.g. optimal cutting temperature (OCT), 2.3 M sucrose and 10% gelatin) is incorporated into tissues before cryofixation to preserve vitrification at high temperature.
After mounting, tissue sections are freeze-dried. In this process the sample’s water content is slowly sublimated under vacuum conditions (mbar); subsequently, the dehydrated samples are brought to room temperature for analysis. It is not clear how this procedure influences the structure of the tissue. During the drying procedure the loss of water undoubtedly leads to some collapse of the material. To improve the freeze drying process, Nygren and coworkers have reported the use of a high pressure freezing technique. Overall image resolution was improved using this freezing method compared to traditional freeze drying techniques [37, 38]. Although freeze drying is an acceptable procedure for the preparation of tissue samples, it is not suitable for micro-analyses or sub-cellular studies.
2.3. Frozen hydration method
Chandra and coworkers were the first to describe frozen hydrated sample protocols for the SIMS analysis of cells [39, 40]. Since then, frozen hydration sample preparation has become the gold standard for cell-based investigations [41]. In this technique, cells are cryo-fixed via the freeze plunging method previously described and analyzed without drying. The samples are kept frozen with a liquid nitrogen cooled stage throughout the analysis. Cell morphology and spatial integrity of diffusible molecules are maintained with this method.
Researchers have reported enhanced molecular ion signals for phospholipids when using frozen hydrated sample preparation techniques. The origin of this enhancement effect is twofold, with the signal increase coming from both an increase in the number of protons generated from the condensed water matrix and the reduced damage accumulation during depth profiling analyses. Under static conditions, studies reveal that a proton transfer between the water matrix and the lipid molecules is responsible for the enhanced phospholipid signals observed at cryogenic temperatures. During depth profiling, damage accumulation is responsible for reduced ion signals and degraded depth resolution at increased depths [42]. Cooling the sample to liquid nitrogen temperatures has been found to reduce the damage accumulation. Studies performed by Piwowar and co-workers show that the molecular ion signal for 1,2–dipalmitoyl-sn-glycero-3-phosphocholine (DPPC) was enhanced by a factor of three when examined under cryogenic and dynamic conditions [43].
Contamination from ambient condensation, typically occurring during sample transfer, is a common complication associated with this frozen hydrated sample preparation method. To combat this, freeze etching and C60+ etching techniques have been employed to remove condensation [41]. However, condensation contamination can be avoided altogether by employing freeze-fracturing techniques and preparing samples in controlled atmospheres (i.e. glove boxes). To freeze-fracture a sample, the hydrated cells are sandwiched and frozen between two silicon shards. Once in vacuum, the sandwich is fractured and fresh unperturbed cells are exposed to the surface for analysis. Recently, Lanekoff and co-workers developed an in situ freeze fracture device for the analysis of frozen hydrated cells with ToF-SIMS (Fig. 2) [44]. This spring-loaded mechanical device eliminates human and external influences during the freeze fracturing event and generates more consistent, reliable and reproducible fractures.
Fig. 2.

Bird’s eye view (left) and profile (right) of freeze fracturing device in the closed position (bottom) before a fracture and opened (top) position after a fracture. (Note: Yellow areas = silicon shards) [44]
Another common problem associated with in situ MS-analyses of tissues and other biological materials is the overwhelming presence of biological salts. In the lipid region, salt adducts contribute to isobaric interferences and impede quantification efforts by dividing a single lipid species into multiple channels. Protocols have been established to remove biological salts by washing tissue with various solvents [36, 45, 46]. The most successful and widely accepted washing solution is pH and osmolarity-balanced ammonium formate (pH = 7.4, concentration = 10 mM). Care should be taken since washing techniques may alter the lipid distribution, obscuring spatial information.
3. Modes of operation and instrumentation
In the field of SIMS there are two fundamental modes of operation based on the primary ion fluence termed static and dynamic. Static SIMS represents acquisitions with primary ion fluencies below 1012 ions/cm2. In this mode, less than 1 % of surface molecules are perturbed, as a result, the probability of impacting the same area twice is extremely low. Intact molecular ion species are typically observed under static conditions; as a result this mode of operation is often used in lipid investigations. In dynamic mode, high fluence bombardment erodes the sample’s surface and chemical information is acquired as a function of depth. The dynamic mode is highly destructive, which limits the analyses to elemental and isotopic information. Based on the mode of operation, there are two types of SIMS instruments commercially available: instruments designed for static acquisitions and those designed for dynamic acquisitions.
Static SIMS instruments typically employ pulsed primary ion sources and ToF mass analyzers. For in situ lipid analysis, the parallel detection associated with the ToF mass analyzer is beneficial for probing complex biological samples with multiple lipid species. ToF-SIMS instruments are able to obtain chemical and spatial information as a function of depth; however, they are unable to collect data during the sputtering process. Alternatively, depth profiles are obtained by continuously alternating between data acquisition and sputtering cycles, resulting in low duty cycle depth profiles.
High fluence instruments typically employ continuous primary ion beams and scanning-based mass analyzers. The continuous generation and detection of secondary ions results in efficient, high duty cycle acquisitions. Although instruments with scanning-based mass analyzers are able to continuously monitor secondary ion generation during sputtering, they are limited in the number of ions detected per depth profile.
Only a few SIMS mass spectrometers are available commercially. Static instruments with reflectron ToF mass analyzers are available from IonToF GmbH (i.e. the ToF-SIMS IV and ToF-SIMS 300/300R instruments) and Kore Technology Ltd (i.e. the SurfaceSeer and Bio-ToF instruments). Also available commercially is a static ToF-SIMS instrument from Physical Electronic (i.e. the Trift V nanoToF), which employs three electrostatic analyzers to accelerate secondary ions into a linear ToF mass analyzer. Cameca SAS has a variety of dynamic SIMS instruments, including a line of ion microscope (IMS 7F, IMS 1270/1280) and NanoSIMS 50/50 L instruments, which employ a double-focusing sector, consisting of an electrostatic sector for filtering and a magnetic sector for mass analysis.
Newly developed SIMS instruments, the C60+-QSTAR and J105 (Ionoptika Ltd.), combine the advantages associated with a continuous primary ion beam and ToF mass analyzers. In addition, unlike any of the aforementioned instruments, these new instruments are capable of performing tandem MS analyses. Design and operational advantages associated with both instruments are discussed in detail in Section 9 of this review.
3.1. Cluster ion sources
Early ToF-SIMS studies focused on experiments in inorganic chemistry and material science, where the technique was successfully applied to semiconductors [47, 48] and polymers [49, 50]. The analyses of organic materials with these early generation-SIMS instruments were less successful, as they often suffered from low sensitivity and a high degree of molecular fragmentation. As a result, the analysis of intact lipid molecules was limited to lipids protected in liquid matrices (e.g., liquid SIMS and the analogous technique of fast atom bombardment (FAB)) [51–53]. Fortunately, progress in instrumentation, particularly in the development of cluster ion sources, has made modern ToF-SIMS instruments more compatible with fragile and labile molecules.
The emergence of cluster ion sources—C60+, Bi3+, Au3+and SF5+—has drastically changed the direction of SIMS research. This development has ushered in a new era of biologically relevant studies [54, 55]. Clusters projectiles offer several advantages over atomic ion projectiles, including enhanced sputter yields of organic molecular ions and reduced physical and chemical damage of the sample surface [56, 57]. Upon impact, the cluster ion projectile shatters—distributing its energy among the individual atoms in the cluster and changing the physics of the bombardment event. These features allow for increased molecular ion sensitivity and allow for the construction of 3-dimensional chemical images. In the analysis of lipids, the ability to detect intact molecular species spatially in 2 or 3 dimensions is an ability unique to cluster SIMS.
Ostrowski and co-workers experimentally measured the degree of molecular ion enhancement afforded by cluster ion sources for a select number of lipids commonly detected with SIMS [58]. In all cases, lipid molecular-ion signals were enhanced; although the degree of enhancement was not uniform among or within the various lipid classes. For instance, C60+ improved the ion yields of cholesterol and sulfatides by a factor of 70 and 103 compared to Ga bombardment, respectively [58]. In addition, the detection of glycerophospholipid molecular-ions was enhanced by 240- to 800- fold, with the degree of enhancement being dependent on the lipid’s headgroup composition.
Due to the emergence of cluster sources, various intact lipids, including glycerophospholipids, cholesterol and vitamin E are routinely detected and identified in tissue. However, the ability to analyze single cells is still limited and very few intact lipid species from cells have been observed. Recent scientific advances in instrumentation and sample preparation protocols are pushing the limits of spatial resolution and sensitivity in order to expand the analytical capabilities of SIMS to a point where lipids can be routinely analyzed on a cellular and sub-cellular level.
4. Tissue imaging experiments
Rat brain sections, a well-established model system for tissue-based IMS studies, have been employed to illustrate the potential of ToF-SIMS imaging for lipid-based investigations. Sjovall and co-workers were the first to report a number of sulfoglycosphingolipids (sulfatides) and cholesterol in the white matter of a rat brain as well as glycerophospholipids molecules, specifically glycerphosphocholines (GPCho) and glycerophosphoinositols (GPIns), in the gray matter of a rat brain section using a Bi3+ source [59, 60]. More recently, Benabdellah and coworkers confirmed these findings while imaging a sagittally sliced rat brain section (Fig. 3) [61]. In addition to the variety of lipids identified in the sample, their analysis of this model system demonstrated the connection between spatial and chemical information allowing inferences to be made between anatomical features and physiological functions. For example, the most striking feature observed in the coronal brain sections was the large region of cholesterol (m/z 369.3 and 385.3) which correlated to the corpus callosum. The corpus callosum is a bundle of nerve fibers that bridges the right and left hemispheres of the brain. To ensure efficient electrical signal conduct across the corpus callosum, the neural fibers are coated with myelin sheath. The high level of cholesterol localized to this region confirms that it is an essential structural and biochemical component of the myelin. Overall, the corpus callosum is easily distinguished from the cerebral cortex and other regions of the brain in SIMS images based on its distinct chemical composition.
Fig. 3.

Sagittal section of rat brain. (Top row, left to right) SIMS images obtained in the positive mode—phosphocholine headgroup (m/z 184), cholesterol (m/z 385) and m/z 796.8—and optical image of the tissue. (bottom row: left to right) SIMS images obtained in the negative mode—Stearic (18:0) fatty acid fragment (m/z 283), vitamin E (m/z 429.3) and sulfoglycosphingolipid (sulfitide, d18:1/24:1)—and the overlay of these ions. [fatty acid (red), vitamin E (green) and sulfitide (blue)[61]
The connection between spatial and chemical composition is lost with separation-based analysis techniques such as thin layer chromatography (TLC) and liquid chromatography mass spectrometry (LC-MS) since these techniques require the homogenization and extraction of the lipids from tissue before analysis. In order to retain spatial and chemical information with these methods, difficult and tedious micro-dissections are required [62]. As a result, these methods are only effective on the macroscale and require highly skilled technicians. In the analysis of tissues, ToF-SIMS is capable of both macroscopic and microscopic-scale analyses.
In the characterization of tissue, ToF-SIMS offers dual functionality: For macro-scale studies where the whole tissue is of interest, the beam can be defocused to cover a large field of view. For micro-scale analyses selected regions of interest can be probed with a highly focused ion beam for a more detailed view. Overall, the ability to elucidate finer structural and chemical features within the tissue provides insight into the biochemical complexity of the cerebellum. For example, in the macroscale, cholesterol and sulfatides are homogenously co-localized to the white matter of the cerebellum [60]. However, in a more detailed analysis of brain tissue, Nygren and coworkers were able to probe the chemistry of finer structures within the cerebellum as shown in Fig. 4 [37, 63–66]. The histological layers (the molecular layer, Purkinje layer and the granular layer) were distinguished by their chemical signatures. Heterogeneous distributions of lipids within these histological structures were also observed. Dot-like sub-cellular distributions of galactosylceramides in the Purkinje and granular layers were speculated to be the result of intracellular vesicles, lipid rafts or ion channels. These subtle features were missed in the macroscale image and only observed due to the high spatial resolution afforded by SIMS technology.
Fig. 4.
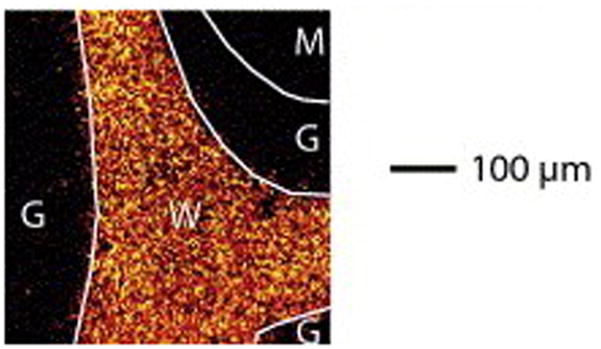

Negative ToF-SIMS images of cerebellum tissue (a) summed pixel intensities of sulfatides from m/z 778.5 to 934.6 red (b) ion intensities of cholesterol at m/z 385 green and (c) overlay of panels a and b. Regions of the cerebellum are outlined; molecular layers (m), white matter (w) and the gray mater (g). [66]
Lipid species detected and identified from various mammalian tissues, including brain [59, 60, 63, 64, 66–68], spinal cord [69], liver [70], kidney [38, 71, 72], adipose [73, 74], skeletal muscle [75, 76], aorta [77] and retina [78], with SIMS is concatenated in Table 1. Additional lipids detected from non-mammalian samples, bacillus subtillus and microbial mats, are reported in Table 2. Almost every major class of lipid is represented within these two tables. However, there are some notable absences from these lists, including saccharolipids, cholesterol esters, glycerophosphoethanolamine (GPEthn), phosphosphingolipids and all lipids with poly unsaturated fatty acid chains. Gas phase basicity and ion stability are major factors that contribute to a lipid’s ability to be detected with SIMS. The lack of GPEthn and cholesterol esters may be due to the fragile nature of these molecules. Phosphoethanolamines have the propensity to decompose, losing their phosphoethanolamine headgroups, thus producing a high mass fragment that isobarically interferes with diacylglycerides (DAGS). Similarly, the fatty acid moiety in cholesterol esters is readily hydrolyzed, producing a fragment ion that isobarically interferes with the high mass pseudomolecular ion of cholesterol (m/z 369).
Table 1.
Lipid species –protonated ions, adducts and pseudomolecular ions—identified in various mammalian tissue sections using ToF-SIMS and organized using the lipid classification system established by the Lipid MAPS consortium
| LM_ID | Sub-class | label(C:DB) | Mass | Formula | Species | Tissue | |
|---|---|---|---|---|---|---|---|
| Glycerophopholipid | GP1001 | Glycerophophates/Diacylglycerophosphates/ | PA(34:0) | 675.5 | C37H72O8P | [M-H]− | Muscle [79] |
| PA(34:1) | 673.5 | C37H70O8P | [M-H]− | Brain[60] | |||
| PA(36:1) | 701.5 | C29H74O8P | [M-H]− | Muscle[79] | |||
| GP0601 | Glycerophosphoinositols/Diacylglycerophosphoinositols/ | PI(36:4) | 857.5 | C45H78O13P | [M-H]− | Brain[59, 60] | |
| PI(38:4) | 885.6 | C47H82O13P | [M-H]− | Brain[59, 60], Adipose[74], Liver[70] | |||
| PI(38:3) | 887.6 | C47H84O13P | [M-H]− | Liver[70] | |||
| GP0701 | Glycerophosphoinositol monophosphates/Diacylglycerophosphoinositol monophosphates/ | PIP(38:4) | 965.6 | C47H83O16P2 | [M-H]− | Brain[59] | |
| GP0101 | Glycerophosphocholines/Diacylglycerophosphocholines/ | PC(34:2) | 758.6 | C42H81NO8P | [M+H]+ | Liver[70] | |
| PC(34:1) | 760.6 | C42H83NO8P | [M+H]+ | Muscle[79], Brain[59, 60], Liver[70] | |||
| PC(34:1) | 699.6 | C39H72O8P | [M-H-TMA]− | Brain[60] | |||
| PC(36:1) | 788.6 | C44H87NO8P | [M+H]+ | Brain[59] [60] | |||
| PC(32:0) | 734.6 | C40H81NO8P | [M+H]+ | Muscle[79], Brain[59, 60, 71] | |||
| Glycerolipids | GL0101 | Monoradylglycerols/Monoacylglycerols/ | MAG(16:1) | 311.3 | C19H35O3 | [M+H-OH]+ | Liver[70] |
| MAG(16:0) | 313.3 | C19H37O3 | [M+H-OH]+ | Liver[70] | |||
| MAG(18:1) | 339.3 | C21H39O3 | [M+H-OH]+ | Liver[70] | |||
| MAG(18:0) | 341.3 | C21H41O3 | [M+H-OH]+ | Liver[70] | |||
| GL0201 | Diradylglycerols/Diacylglycerols/ | DAG(30:2) | 519 | C33H59O4 | [M+H-OH]+ | Liver[70] | |
| DAG(30:1) | 521 | C33H61O4 | [M+H-OH]+ | Liver[70] | |||
| DAG(30:0) | 523 | C33H63O4 | [M+H-OH]+ | Liver[70], Adipose[74] | |||
| DAG(32:2) | 547 | C35H63O4 | [M+H-OH]+ | Liver[70] | |||
| DAG(32:1) | 549 | C35H65O4 | [M+H-OH]+ | Liver[70] | |||
| DAG(32:0) | 551 | C35H67O4 | [M+H-OH]+ | Adipose[73, 74], Liver[70], Muscle[75] | |||
| DAG(34:3) | 573 | C37H65O4 | [M+H-OH]+ | Liver[70] | |||
| DAG(34:2) | 575 | C37H67O4 | [M+H-OH]+ | Liver[70] | |||
| DAG(34:1) | 577 | C37H69O4 | [M+H-OH]+ | Adipose[73], Liver[70], Muscle[75] | |||
| DAG(34:0) | 579 | C37H71O4 | [M+H-OH]+ | Adipose[74] | |||
| DAG(36:4) | 599 | C39H67O4 | [M+H-OH]+ | Liver[70] | |||
| DAG(36:3) | 601 | C39H69O4 | [M+H-OH]+ | Liver[70] | |||
| DAG(36:2) | 603 | C39H71O4 | [M+H-OH]+ | Adipose[73], Liver[70], Muscle[75] | |||
| DAG(36:0) | 607 | C39H75O4 | [M+H-OH]+ | Adipose[74] | |||
| GL0301 | Triradylglycerols/Triacylglycerols/ | TAG(48:0) | 805 | C51H97O6 | [M-H]− | Adipose[74] | |
| TAG(50:3) | 851 | C53H97O6Na | [M+Na]+ | Liver[70] | |||
| TAG(50:2) | 829 | C53H97O6 | [M-H]− | Muscle[79] | |||
| TAG(50:2) | 853 | C53H98O6 Na | [M+Na]+ | Liver[70] | |||
| TAG(50:1) | 855 | C53H100O6Na | [M+Na]+ | Liver[70] | |||
| TAG(50:0) | 833 | C53H101O6 | [M-H]− | Adipose[74] | |||
| TAG(50:0) | 857 | C53H102O6Na | [M+Na]+ | Liver[70] | |||
| TAG(52:4) | 877 | C55H98O6Na | [M+Na]+ | Liver[70] | |||
| TAG(52:3) | 855 | C55H99O6 | [M-H]− | Adipose[74] | |||
| TAG(52:3) | 879 | C55H100O6Na | [M+Na]+ | Liver[70] | |||
| TAG(52:2) | 857 | C55H101O6 | [M-H]− | Adipose[73], Muscle[79] | |||
| TAG(52:2) | 881 | C55H102O6Na | [M+Na]+ | Liver[70] | |||
| TAG(52:1) | 883 | C55H104O6Na | [M+Na]+ | Liver[70] | |||
| TAG(52:0) | 861 | C55H105O6 | [M-H]− | Adipose[74] | |||
| TAG(52:0) | 885 | C55H106O6Na | [M+Na]+ | Liver[70] | |||
| TAG(54:4) | 881 | C57H101O6 | [M-H]− | Muscle[75] | |||
| TAG(54:3) | 883 | C57H99O6 | [M-H]− | Adipose[73] | |||
| Fatty Acyls | FA0101 | Fatty Acids and Conjugates/Straight chain fatty acid/ | FA(14:0) | 227.2 | C14H27O2 | [M-H]− | Liver[70] |
| FA(16:0) | 255.2 | C16H31O2 | [M-H]− | Adipose[73, 74], Muscle[75, 79], Liver[70] | |||
| FA(18:0) | 283.2 | C18H35O2 | [M-H]− | Muscle[75, 79], Adipose[74], Liver[70] | |||
| FA0103 | Fatty Acids and Conjugates/Unsaturated fatty acid/ | FA(16:1) | 253.2 | C16H29O2 | [M-H]− | Adipose[73], Muscle[75, 79], Liver[70] | |
| FA(16:2) | 251.2 | C16H27O2 | [M-H]− | Muscle[79] | |||
| FA(18:3) | 277.2 | C18H29O2 | [M-H]− | Muscle[79] | |||
| FA(18:2) | 279.2 | C18H31O2 | [M-H]− | Adipose[73], Muscle[79], Liver[70] | |||
| FA(18:1) | 281.2 | C18H33O2 | [M-H]− | Adipose[73], Muscle[79], Liver[70] | |||
| FA(20:4) | 303.2 | C20H31O2 | [M-H]− | Muscle[79] | |||
| Sterol Lipids | ST01010001 | Cholesterol and derivatives/ | CH | 369.3 | C27H45 | [M+H-H2O]+ | Adipose[73], Liver[70], Brain[59, 63, 71] |
| CH | 385.3 | C27H46O | [M-H]− | Muscle[79], Brain[59] | |||
| CH | 385.3 | C27H46O | [M-H]+ | Brain[59, 63], Liver[70] | |||
| 7-ketocholesterol | 399.3 | C27H43O2 | [M+H]+ | Aorta[77] | |||
| Prenol Lipids | PR02020001 | Quinones and hydroquinones/Vitamin E/ | α-tocopherol | 429.3 | C29 H49O2 | [M-H]− | Muscle[79], Liver[70] |
| 430.3 | C29 H50O2 | [M]+ | Retina[78], Liver[70] | ||||
| PR02010004 | Quinones and hydroquinones/Ubiquinones/ | coenzyme Q9 | 795.6 | C54H83O4 | [M-H]− | Muscle[79] | |
| Sphingolipids | SP0602 | Acidic glycosphingolipids/Sulfoglycosphingolipids (sulfitides)/ | C16a | 778.5 | C40H76SNO11 | [M-H]− | Brain[66] |
| C16-OHb | 794.6 | C40H76SNO12 | [M-H]− | Brain[66] | |||
| C18 | 806.6 | C42H80SNO11 | [M-H]− | Brain[59, 60, 66] | |||
| C18-OH | 822.5 | C42H80SNO12 | [M-H]− | Brain[59, 60, 66] | |||
| C20 | 834.6 | C44H84SNO11 | [M-H]− | Brain[59, 60, 66] | |||
| C22-OH | 850.6 | C44H84SNO12 | [M-H]− | Brain[59, 60, 66] | |||
| C22 | 862.6 | C46H88SNO11 | [M-H]− | Brain[59, 60, 66] | |||
| C23 | 876.7 | C47H90SNO11 | [M-H]− | Brain[59, 66] | |||
| C22-OH | 878.6 | C46H88SNO12 | [M-H]− | Brain[59, 60, 66] | |||
| C24:1 | 888.6 | C48H90SNO11 | [M-H]− | Brain[59, 60, 66] | |||
| C24 | 890.6 | C48H92SNO11 | [M-H]− | Brain[59, 60, 66] | |||
| C25:1 | 902.6 | C49H92SNO11 | [M-H]− | Brain[66] | |||
| C24:1-OH or C25 | 904.6 | C48H90SNO12 | [M-H]− | Brain[59, 60, 66] | |||
| C24-OH | 906.6 | C48H92SNO12 | [M-H]− | Brain[59, 60, 66] | |||
| C26:1 | 916.6 | C50H94SNO11 | [M-H]− | Brain[66] | |||
| C25:1-OH or C26 | 918.6 | C49H92SNO12 | [M-H]− | Brain[66] | |||
| C26:1-OH | 932.7 | C50H94SNO12 | [M-H]− | Brain[66] | |||
| C26-OH | 934.6 | C50H96SNO12 | [M-H]− | Brain[66] | |||
| SP0501 | Neutral glycosphingolipids/Simple Glc series/ | C18:0 | 750.6 | C42H81NO8Na | [M+Na]+ | Brain [63], Aorta[77] | |
| C24:0c | 834.6 | C48H93NO8Na | [M+Na]+ | Brain[63, 64], Aorta[77] | |||
| C24:1 | 832.6 | C48H91NO8Na | [M+Na]+ | Brain[63, 64] | |||
| Ch24:0d | 850.6 | C48H93NO9Na | [M+Na]+ | Brain [63, 64], Aorta[77] | |||
| Ch24:1 | 848.6 | C48H91NO9Na | [M+Na]+ | Brain[63, 64] | |||
| Ch23:0 | 836.6 | C47H91NO9Na | [M+Na]+ | Brain [64] | |||
| Ch22:0 | 822.6 | C46H89NO9Na | [M+Na]+ | Brain[64] | |||
| SP0301 | Phosphosphingolipids/Ceramide phosphocholines Sphingomylin | SM(34:1) | 616.5 | C34H67NO6P | [M-(C2H2(N(CH3)3))]− | Liver[70] | |
| SM(34:1) | 642.6 | C36H69NO6P | [M-(N(CH3)3)]− | Liver[70] | |||
| SM(34:1) | 687.6 | C38H76N2O6P | [M-CH3]− | Liver[70] |
C16 = (3′-Sulf)Galβ-Cer(d18:1/16:0)
C16-OH = (3′-Sulf)Galβ-Cer(d18:1/2-OH-16:0)
C24:0 = GalCer(d18:1/2-OH-24:0
Ch24:0 GalCer(d18:1/2-OH-24:0)
Table 2.
Lipid species identified from bacterial and microbial colonies using ToF-SIMS and organized using the lipid classification system established by the Lipid MAPS consortium
| LM_ID | sub-class | labels | Mass | Formula | Species | Tissue | |
|---|---|---|---|---|---|---|---|
| Polykeytides | PK | Surfactin/ | M13 | 1006.6 | C51H88N7O13 | [M-H]− | B. subtilis[104] |
| M14 | 1020.6 | C52H90N7O13 | [M-H]− | B. subtilis [104] | |||
| M14 | 1042.6 | C52H88N7O13Na | [M- | B. subtilis [104] | |||
| M15 | 1034.6 | C53H92N7O13 | 2H+Na] [M-H]− − | B. subtilis [104] | |||
| M15 | 1056.6 | C53H90N7O13Na | [M- | B. subtilis [104] | |||
| M15 | 1072.6 | C53H90N7O13K | [M-2H+K] 2H+Na]− − | B. subtilis [104] | |||
| M16 | 1048.6 | C54H94N7O13 | [M-H]− | B. subtilis [104] | |||
| PK1211 | Flavonoids/Flavones and Flavonols/ | Quercetin 3-o-galactoside | 463.16 | C21H19O12 | [M-H]− | P.sativum seed [105] | |
| Quercetin 3-o-rhamnoside | 447.12 | C21H19O11 | [M-H]− | A. thaliana seed[105] | |||
| Apigenin glycoside | 431.34 | C21H19O10 | [M-H]− | P.sativum seed [105] | |||
| Protocatechuic acid glycoside | 315.08 | C12H15O9 | [M-H]− | P.sativum seed [105] | |||
| PK12110003 | kaempferol | 285.01 | C15H9O6 | [M-H]− | A. thaliana and P.sativum seed [105] | ||
| PK12110004 | Quercetin | 301.05 | C15H9O7 | [M-H]− | A. thaliana and P.sativum seed [105] | ||
| PK12020001 or PK12020003 | Flavonoids/Flavans, Flavanols and Leucoanthocyanidins/ | (+) catechin or (−)- epicatechin | 288.98 | C15H13O6 | [M-H]− | P.sativum seed [105] | |
| Glycerolipids | GL0203 | Diradylglycerols/Dialkylglycerols/ | Dihydroxyarchaeol | 707 | C43H88O5 | [M+Na]+ | microbial mats [106] |
| GL02030035 | Archaeol | 675 | C43H88O3 | [M+Na]+ | microbial mats [106] | ||
| GL02030034 | Hydroxyarchaeol | 691 | C43H88O4 | [M+Na]+ | microbial mats [106] | ||
| GL0205 | Diradylglycerols/Di-glycerol tetraether/ | C40 isoprenoid GDGT 0a | 1324 | C86H172O6 | [M+Na]+ | microbial mats [106] | |
| C40 isoprenoid GDGT 1 | 1322 | C86H170O6 | [M+Na]+ | microbial mats [106] | |||
| C40 isoprenoid GDGT 2 | 1320 | C86H168O6 | [M+Na]+ | microbial mats [106] | |||
| C40 isoprenoid GDGT 3 | 1318 | C86H166O6 | [M+Na]+ | microbial mats [106] | |||
| C40 isoprenoid GDGT 4 | 1316 | C86H164O6 | [M+Na]+ | microbial mats [106] | |||
| GL0206 | Diradylglycerols/Di-glycerol tetraether/ | gentiobiosyl-GDGT 0 | 1648 | C98H192O16 | [M+Na]+ | microbial mats [106] | |
| gentiobiosyl-GDGT 1 | 1646 | C98H190O16 | [M+Na]+ | microbial mats [106] | |||
| gentiobiosyl-GDGT 2 | 1644 | C98H188O16 | [M+Na]+ | microbial mats [106] | |||
| gentiobiosyl-GDGT 3 | 1642 | C98H186O16 | [M+Na]+ | microbial mats [106] | |||
| gentiobiosyl-GDGT 4 | 1640 | C98H184O16 | [M+Na]+ | microbial mats [106] | |||
| GL0503 | Glycosyldiradylglycerols/ | gentiobiosyl-archaeol | 999 | C55H108O13 | [M+Na]+ | microbial mats [106] |
GDGT = Glycerol dialkyl glycerol tetra ether
ToF-SIMS has also been utilized in examining lipid-related diseases, such as Duchenne mulcular dystrophy [76, 79], Fabry disease [80], non-alcoholic fatty liver disease [70], atherosclerosis [77] and cystic fibrosis [81], as well as cancers. These diseases stem from dysfunctional metabolic processes (i.e. uptake, de novo synthesis or exportation) and result in abnormal concentrations of biomolecules. Chemical images across diseased tissue reveal areas of abnormal chemistry; such scarcity or over-abundance of a particular biomarker can link cellular dysfunction with anatomical specificity. Le Naour and coworkers found a higher concentration of unsaturated DAGS and triacylglycerides (TAGS), as well as increased cholesterol signals, in steatotic vesicles taken from an individual with fatty liver disease compared to normal tissue [70]. Also, in the analysis of aortic tissue, Malmberg and coworkers found that human atherosclerotic plaques contained irregular distribution of cholesterol and elongated DAGS [77]. The increased DAG concentration suggests increased phospholipase A (PLA) activity, which has been previously linked to the disease progression of atherosclerosis.
5. Single cell imaging experiments
Currently, ToF-SIMS is the only mass spectrometry imaging technique capable of characterizing the lateral distribution of lipids on a cellular and subcellular level [82, 83]. The first ToF-SIMS images of cells were obtained using atomic projectile sources. These high resolution images of isolated cells provided useful elemental distributions and isotopic information. However, the extensive molecular fragmentation from the energetic impact and the resulting chemical damage accumulation hampered technique’s utility in lipid research. One major drawback that limited the potential application of the technique was its inability to detect intact glycerophospholipids. In these early studies, this large and diverse class of molecules was routinely reduced to the detection of the headgroup fragment, such as m/z 142 for the GPEthn and m/z 184 for GPCho. In addition, the sample’s fatty acid contribution was often evaluated separately in the negative ion SIMS spectra. The separated detection of headgroups and fatty acid constituents prevented lipid identification and made it difficult to extract useful biochemical information from systems under study.
Despite these difficulties, Ostrowski and co-workers were able to study changes in the cellular membrane lipid composition during mating of tetrahymena thermophila, which was prepared in a freeze-fractured frozen hydrated state [84]. This task was accomplished by examining the GPCho headgroup fragment, phosphocholine, at m/z 184 (C5H15NPO4) and the 2-aminoethylphosphonolipids (2-AeP) headgroup fragment at m/z 126 (C2H9NPO3) (Fig. 5). These workers found an accumulation of highly contoured, non-lamellar, 2-AeP lipids and a depletion of lamellar GPCho lipids at the conjugation junction during mating. In order to elucidate the driving force behind these lipid heterogeneities, time-based studies on this system were preformed [85]. These studies concluded that structural changes in the membrane preceded chemical changes. More specifically, pore formation—most likely initiated by membrane bound protein activity—created structural deformations in the membrane that attracted high-curvature lipids and displaced phosphocholine. This study provides important insight concerning the role of lipids in complex biological processes and established a clear link between chemical structure and function. Since the observed lipid segregation was dependent upon the biophysical characteristics of the lipid’s headgroup, it is possible that the chemical composition of the lipid’s fatty acid constituents was also a contributing factor. Therefore, future studies in which intact lipid species are detected would be beneficial to better understanding this system.
Fig. 5.
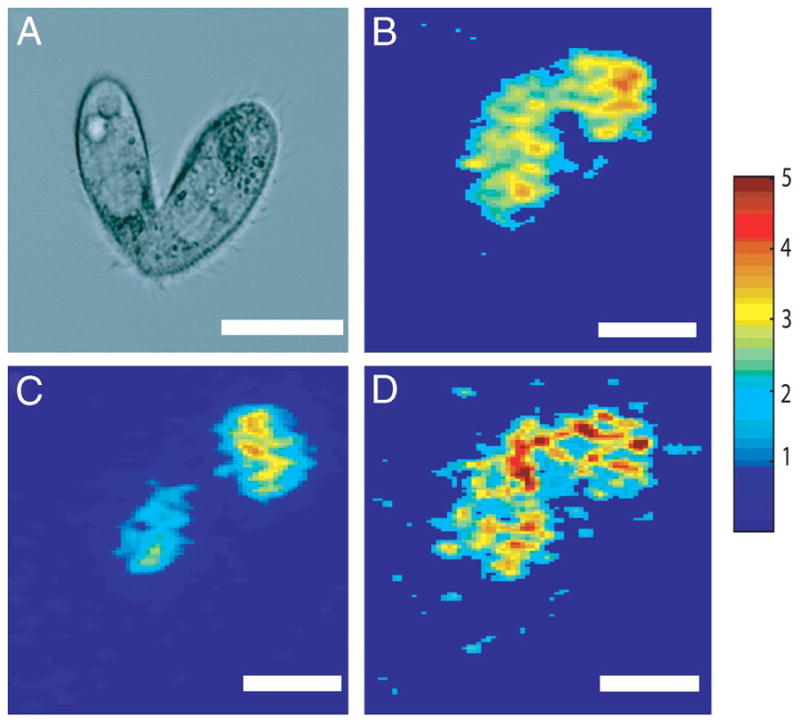
Microscopy (DIC) image of a mating tetrahymena thermophila (a) and SIMS image depicting localizations of an ubiquitous organic ion at m/z 69 (C5H9, b). Lipid heterogeneities at the mating junction includes a depletion of phosphocholine (c) and an accumulation of 2-AEP (d). (Scale bar: 25 μm) [85]
Although the detection of glycerophospholipids is difficult at the cellular level, mass spectrometric-friendly lipid molecules, such as cholesterol and vitamin E, are easily detectable at the cellular level [86, 87]. Monroe and coworkers demonstrated heterogeneous localizations of cholesterol on the surface of a single aplysia california neuron using SIMS. The ability to readily detect vitamin E at the cellular level is important, since vitamin E is implicated in lipid oxidation, which is a process linked to a variety of diseases including Alzheimer’s and Parkinson’s disease [88, 89].
Yang and co-workers were able to successfully detect intact glycerophosphocholine species directly from the surface of a cultured neuron obtained from the superior cervical ganglia of a mouse [90]. The protonated and sodiated molecular-ion of various GPCho molecules were detected. The identifications were made by reconciling the most abundant headgroup in positive ion mode with the most abundant fatty acid constituents obtained in negative ion mode. In addition, Yang and coworkers were able to distinguish the GPCho from the sphingomyelin (SM) contribution in the lipid profiles by focusing on fragment ions m/z 224.1 and 246.1 that are distinct to glycerophosphocholine (Fig. 6). This group reported that although the shared phosphocholine and SM components (m/z 206) are homogeneously distributed throughout the neuritis, the signal that was unique to GPCho was heterogeneous with strong intensity in the neurites surrounding the soma.
Fig. 6.
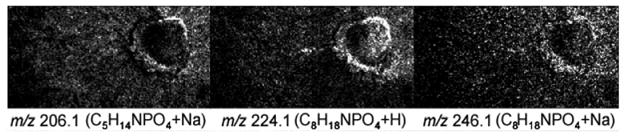
SIMS images of a cultured neuron obtained from the superior cervical ganglia of a mouse. Ion contribution from the phosphocholine headgroup (m/z 206.1, m/z 224.1 and m/z 246.1) is distinguished from the SM headgroup (m/z 206.1) fragments. [90]
6. Sensitivity issues
At the cellular level, instrument performance is greatly limited by sensitivity. The tradeoff between high resolution and secondary ion yields has often limited the detection of intact phospholipids at the cellular level. As smaller and smaller regions are probed for high lateral resolution, the number of molecules available to be desorbed, ionized and detected is reduced. The production of secondary ions is often the limiting factor in sensitivity. The search for methods to enhance ionization probability is, therefore, continuously underway. The benefit of improving sensitivity is twofold: It allows for the detection of abundant lipids at a sub-cellular level and it allows for the detection of low abundant lipid species, typically involved in signaling pathways.
Recently, novel approaches have been developed to improve the sensitivity of the system and push the detection limits beyond the technical capabilities of the instrument. Surface treatments involving thin layers of metals and matrices, known as metal assisted (MetA) and matrix enhanced (Me) SIMS, have been shown to improve the desorption/ionization of analytes. Complications associated with these methods, such as molecular specific enhancements and spectral interference from matrix clusters and adducts, tend to complicate quantification and identification efforts. The exact mechanism behind ion enhancement with these methods is currently unknown. Although matrix application methods have become more sophisticated in recent years, the incorporation of matrix into a sample ultimately reduces the lateral resolution because of chemical displacement.
Heeren and coworkers have utilized the ion yield enhancements afforded by MetA- and Me-SIMS to detect intact phospholipids and sterol from single cells [91]. Neuroblastoma cells, approximately 50 microns in diameter, were coated with a nanometer of gold using a high resolution sputter coater typically employed for secondary electron microscopy (SEM) and transmisssion electron microscopy (TEM) analyses. A highly focused 15 keV In source was employed to provide sub-cellular details. Without metal or matrix treatment, high mass intact phospholipids were not observed and the detection of lipids was limited to fragments, such as phosphocholine (m/z 184) and DAG (m/z 550–650) fragment ions. However, with the application of matrix, the group could identify several glycerophospholipid species in the positive ion mode, including 32:0, 34:1, 34:2, 36:1, 36:2, 38:4 and 38:5 GPCho and 36:1 GPEtn. Also, despite desalting procedures involving a sucrose washing, the sodium adduct of 34:1 GPCho was a dominant mass peak. Without high mass resolution or tandem MS verification, however, these assignments must be taken with caution due to possible isobaric interferences.
Molecular depth profiling [42, 45, 68, 92–95] has also been employed to improve the detection limits at high resolution and has done so without sample manipulation. With depth profiling methods, the advantage is obtained by turning a pixel into a voxel. Cluster ion sources, like C60+, are capable of interrogating the surface and sub-surface of a sample with limited damage accumulation and chemical mixing. In the end, a larger portion of the sample is probed without degrading lateral spatial resolution. This approach does not improve the ionization probability, rather it simply increases the amount of material available. The capability to analyze lipid distributions in three-dimensional space on a cellular level was demonstrated by Fletcher and coworkers (Fig. 7) [96]. The distribution of cholesterol (m/z 369), phospholipid-related fragment molecules accumulated over the m/z 540–570 mass range and fatty acid side chain fragments in an ooctye were mapped.
Fig. 7.
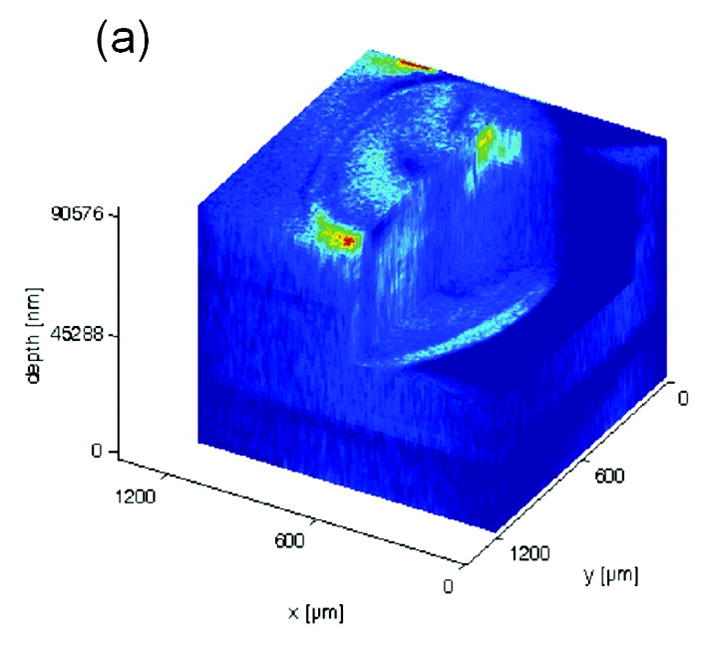

3D biochemical images of freeze-dried oocyte depicting phosphocholine signal from m/z 58, 86, 166, and 184 (a) and cholesterol signal at m/z 369 (d). [96]
Lipid species –protonated ions, adducts, pseudomolecular ions and fragments—identified in various mammalian and non-mammalian cell lines using ToF-SIMS are organized by the lipid classification system established by the Lipid MAPS consortium in Table 3. On the cellular level, very few intact lipid species are observed other than the mass spectrometry-friendly lipid species: cholesterol, vitamin E and GPCho. At this level, lipid fragments are commonly observed and used to identify whole classes of lipid species. However, this method is not always reliable since several classes of lipid share common fragment ions. Reoccurring themes in lipid chemical structure not only produce isobaric interferences, but also result in common fragments ions. For example, fragment ions at m/z 126 and 142 represent both GPEthn and phosphonosphingolipids. In protozoan cell lines, these fragments are identified as the headgroup of phosphonosphingolipids and in mammalian-derived cell lines these lipid fragments are assigned to GPEthn. Without intact lipids, previous knowledge of species and its lipid content is needed for such assignments.
Table 3.
Lipid species –protonated ions, adducts, pseudomolecular ions and fragments—identified in various mammalian and non-mammalian cell lines using ToF-SIMS and organized using the lipid classification system established by the Lipid MAPS consortium
| LM_ID | Sub-class | Label(C:DB) | Mass | Formula | Species | Cell type | |
|---|---|---|---|---|---|---|---|
| Fatty Acyls | FA0101 | Fatty Acids and Conjugates/Straight chain fatty acids/ | FA(16:0) | 255.2 | C16H31O2 | Fragment | Mouse neuron [90], Xenopus laevis oocyte[96] |
| FA(18:0) | 283.2 | C18H35O2 | Fragment | Mouse neuron[107] | |||
| FA0103 | Fatty Acids and Conjugates/Unsaturated fatty acid/ | FA(18:1) | 281.2 | C18H33O2 | Fragment | Mouse neuron [90], Xenopus laevis oocyte [96] | |
| FA(18:2) | 279.2 | C18H31O2 | Fragment | Xenopus laevis oocyte [96] | |||
| Glycerophospholipids | GP01 | Glycerophosphocholines/ | 59 | C3H9N | Fragment | Mouse neuron [90], PMNLb [108], Xenopus laevis oocyte[96] | |
| 86 | C5H12N | Fragment | PC-12c [109], Mouse neuron [90], Xenopus laevis oocyte[96] | ||||
| 104 | C5H14NO | Fragment | Mouse neuron [90] | ||||
| 166 | C5H13NPO3 | Fragment | PC-12[44], Xenopus laevis oocyte[96] | ||||
| 184 | C5H15NPO4 | Fragment | PMNL [108], PC-12[44] [109], J774[110], Aplysia californica neuron[86], Xenopus laevis oocyte[96], Mouse neuron[107] | ||||
| 206 | C5H14PO4Na | Fragment | Mouse neuron [90] | ||||
| 224 | C8H19NPO4 | Fragment | PC-12 [44], Mouse neuron [90] | ||||
| 246 | C8H18NPO4Na | Fragment | Mouse neuron [90] | ||||
| GP0101 | Glycerophosphocholine/Diacylglycerophosphocholines/ | GPCho(32:1) | 732a | C40H79NO8P | [M+H]+ | neuroblastoma cells[91] | |
| GPCho(34:2) | 758a | C42H81NO8P | [M+H]+ | neuroblastoma cells[91] | |||
| GPCho(34:1) | 760a | C42H83NO8P | [M+H]+ | neuroblastoma cells[91] | |||
| GPCho(34:1) | 782a | C42H83NO8PNa | [M+Na]+ | neuroblastoma cells[91], Mouse neuron[107] | |||
| GPCho(36:1) | 788a | C44H87NO8P | [M+H]+ | neuroblastoma cells[91] | |||
| GPCho(38:5) | 808a | C46H83NO8P | [M+H]+ | neuroblastoma cells[91] | |||
| GPCho(38:4) | 810a | C46H85NO8P | [M+H]+ | neuroblastoma cells[91] | |||
| GP0102 | Glycerophosphocholine/1-alkyl,2-Acylglycerophosphocholines/ | GPCho(16:0e/18:1) | 709 | C39H75O7PNa | [M+Na-TMA]+ | Aplysia californica neuron[102] | |
| GPCho(16:0e/18:1) | 725 | C39H75O7PK | [M+K-TMA]+ | Aplysia californica neuron[102] | |||
| GPCho(16:0e/18:1) | 746 | C42H85NO7P | [M+H]+ | Aplysia californica neuron[102] | |||
| GPCho(16:0e/18:1) | 768 | C42H84NO7PNa | [M+Na]+ | Aplysia californica neuron[102] | |||
| GPCho(16:0e/18:1) | 784 | C42H84NO7PK | [M+K]+ | Aplysia californica neuron[102] | |||
| GP02 | Glycerophosphoethanolamines | 126 | C2H9NPO3 | Fragment | PC-12 [44] | ||
| 142 | C2H9NPO4 | Fragment | PC-12 [44], J774[110] | ||||
| GP0201 | Glycerophosphoethanolamines/Diacylglycerophosphoethanolamines/ | GPEthn(36:1) | 746 | C41H81NO8P | [M+H]+ | neuroblastoma cells[91] | |
| Sphingolipids | SP0301 | Phosphosphingolipids/Ceramide phosphocholines (sphingomyelins)/ | 86 | C5H12N | Fragment | Mouse neuron [90] | |
| 102 | C5H12NO | Fragment | Mouse neuron [90] | ||||
| 104 | C5H14NO | Fragment | Mouse neuron [90] | ||||
| 184 | C5H15NPO4 | Fragment | Mouse neuron [90] | ||||
| 206 | C5H14PO4Na | Fragment | Mouse neuron [90] | ||||
| SP04 | Phosphonosphingolipids/ | (2-AeP) | 126 | C2H9NPO3 | Fragment | Tetrahymena thermophila[84, 85] | |
| 142 | C2H9NPO4 | Fragment | Tetrahymena thermophila[84, 85] | ||||
| Sterol Lipids | ST01010001 | Cholesterol and derivatives/ | CH | 95 | C7H11 | Fragment | J774[111] |
| 109 | C8H13 | Fragment | J774[111] | ||||
| 147 | C11H15 | Fragment | J774[111] | ||||
| 161 | C12H17 | Fragment | J774[111] | ||||
| 369.3 | C27H45 | [M+H-H2O]+ | PC-12 [109], J774[111], Xenopus laevis oocyte[96] | ||||
| 385.3 | C27H46O | [M-H]+ | PC-12 [109] | ||||
| 583 | C27H46OAu | [M+Au]+ | PMNL [108], neuroblastoma | ||||
| cells[91] | |||||||
| 970 | C54H93O2Au | [2M+Au]+ | PMNL [108], neuroblastoma cells[91] | ||||
| 1167 | C54H93Au2 | [2M+2Au]+ | neuroblastoma cells[91] | ||||
| Prenol Lipids | PR02020001 | Quinones and hydroquinones/Vitamin E/ | α-tocopherol | 165 | C10H13O2 | Fragment | Aplysia californica neuron[86] |
| 205 | C13H17O2 | Fragment | Aplysia californica neuron[86] | ||||
| 430.3 | C29H50O2 | [M]+ | Aplysia californica neuron[86] |
For consistency, masses were adjusted from the reported values for the neuroblasmtoma cells to compensate for rounding error.
PMNL = polymorphonuclear leukocytes
PC-12 = pheochromocytoma
7. Dynamic SIMS
Although this review mainly focuses on studies employing static SIMS, dynamic SIMS has also been successfully employed in lipid studies. As previously mentioned, this method employs a continuous primary ion beams that produces mostly atomic and diatomic species. Despite the highly destructive secondary ion generation process, this method is capable of achieving spatial resolution of at least 50 nm. In order to investigate lipid processes, halogen-based or stable isotopic tracers (13C, 14N or deuterium) are required. Incorporating these tracers into the analyte of interest is a major challenge associated with this technique. Traceable lipids are added to cell culturing media and incorporated into cell lines during incubation. Lechene and coworkers were able to study the distribution of monounsaturated fatty acid, by incubating 3T3F442A adipocytes with isotopically traceable oleate fatty acids (13C−) [97]. The movement of fatty acids within cells can be traced and measured to sub-cellular locations using the signal 13C/12C ratio (see Fig. 8). These experiments are time-limited since dynamic metabolic and catabolic processes quickly redistribute the tracers, obscuring the analyte or biological process under investigation. This technique has been used to study the formation of lipid domain in model systems [98, 99]. Like MALDI, this method provides a complementary perspective to ToF-SIMS. Although this technique does not provide molecular ion information, the high lateral resolution associated to this method is valuable for sub-cellular investigations.
Fig. 8.
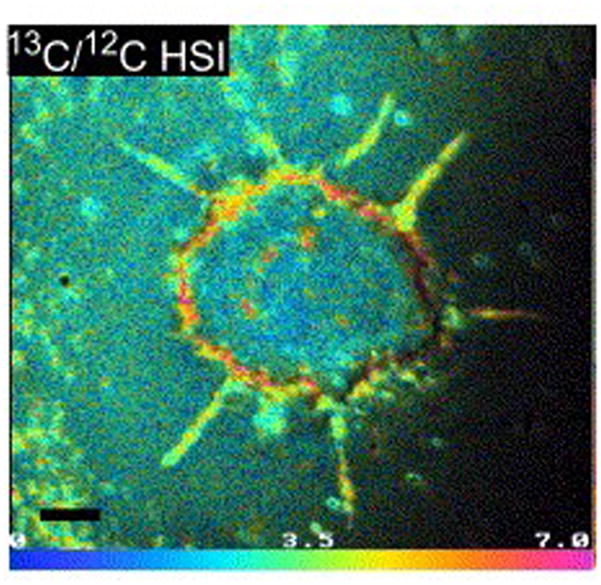
Image acquired with dynamic SIMS, illustrates the distribution of isotopically traceable monosaturated fatty acid, oleate, in a single 3T3F442A adipocyte [97]. The oleate is localized to the cell membrane and discrete lipid droplets inside the cell.
8. Challenges associated with the SIMS analysis of lipids
The increased sensitivity to intact lipid species afforded by the technical and methodological advances described above brings about new challenges in the analyses of lipids. For instance, the ability to properly identify lipid molecules from a complex mixture is crucial for in situ lipidomics-based investigation. In SIMS-based investigations, lipid assignments are typically based on standard reference spectra, mass accuracy of the molecular-ion peaks and previous knowledge of the sample’s biochemistry. However, these methods of identification are not sustainable as researchers continue to probe deeper into increasingly complex and unknown biological systems. Lipid profiles obtained from in situ mass spectrometry imaging experiments are plagued by isobaric interference in addition to matrix effects and ion suppression effects. High mass resolution and tandem MS capabilities, functionalities commonly employed in MALDI and DESI experiments, can be utilized to deconvolute isobaric interferences and help identify the detected lipid species. Traditional ToF-SIMS instruments have limited mass resolution and lack tandem MS capabilities. Newly developed SIMS instruments are emerging to overcome these inadequacies, as discussed in the next section.
High mass resolution is needed to separate and distinguish individual lipid molecules in complex mixtures. For certain classes of lipids it is not uncommon to have multiple molecular signatures at the same nominal mass unit. For example, the number of potential phospholipids at each mass unit in the 650–900 Dalton mass region can range from 2 to 200, depending on the phospholipid class. The large number of possible lipid species stems from the variability of the three fundamental structural components – the headgroup, the glycerol-fatty acid linkage, and the two fatty acid components. Structurally, the headgroup of a glycerophospholipid consists of a phosphate group attached to one of the following functional groups: choline, serine, ethanolamine, glycerol or inositol. The headgroup is attached to the sn-3 site of the glycerol moiety. The sn-1 and sn-2 glycerol sites are typically attached to the fatty acid functional groups. There are three types of glycerol-fatty acid linkages: 1–2-diacyl, 1-alkyl-2-acyl, and 1-alk-1-enyl-2-acyl; these linkages are described as diacyl, ether, and plasmalogen lipids, respectively. The fatty acid moieties vary in fatty acid chain length, degree of saturation and double bond position.
Tandem MS analyses have proven to be vital to identifying the molecular nature of lipid molecules. In this method, the unknown lipid molecule is selected and fragmented in a collision-induced dissociation (CID) chamber. The resulting spectrum reveals vital structural information that assists in the identification of the lipid molecule.
9. Recent developments in instrumentation
Although many traditional ToF-SIMS instruments have been updated with cluster ion sources, their overall design and capabilities are still generally underdeveloped for the complex nature of biological-based applications. Currently, technical design flaws associated with traditional static ToF-SIMS instruments hinder the technique’s ability to effectively and efficiently analyze lipids and other bio-molecules. For example, traditional ToF-SIMS instruments employ pulsed primary ion beams and delayed extraction optics to combat energy spreads associated with variations in ion formation times. In this configuration, mass resolution is dependent on, and ultimately limited by, the temporal width of the primary ion beam. As a result, high mass resolution is achieved at the expense of primary ion beam duty cycle, which is a performance efficiency factor defined by the time the beam is on as a function of total acquisition time. In addition, this configuration is incompatible with tandem MS analyses and continuous ion beam generation. Within this new area of lipid applications, design changes are needed. For these complex systems, it is necessary to have high throughput and high mass resolution instruments with tandem MS capabilities. With these factors in consideration, two new high performance ToF-SIMS instruments, the J105 [100] and the C60+ QSTAR [101], were developed. In both systems, high throughput was achieved by employing a continuous primary ion beam. High mass resolution was achieved in conjunction with high throughput by decoupling the ionization event from the spectral acquisition.
The C60+ QSTAR instrument combines a 20 keV C60+ source with a commercial triple quadrupole orthogonal ToF Mass Spectrometer from Applied Biosystems/MDS Sciex Q-Star XL (Fig. 9) [101]. Tandem MS information is obtained by selecting the parent ion in quadrupole 1 (Q1) and subsequently fragmenting the ion via CID in quadrupole 2 (Q2). A differential pumping system in the C60+ QSTAR instrument is used to sweep desorbed ions into the mass spectrometer without the assistance of a high voltage extraction. The lack of high voltage extraction optics mitigates sample charging issues in the positive ion mode. Orthogonal extraction is responsible for decoupling the secondary ion generation event from the detection scheme; resulting in high mass resolution spectra (m/Δm 12000–15600) [101]. Dual sources, C60+ gun and N2 laser, allow for parallel SIMS and MALDI-based investigations. Since both methods are suitable platforms for lipid imaging, complementary datasets for both techniques can be compiled in order to extract the greatest amount of information from a common system.
Fig. 9.

Schematic of the C60+ QStar instrument shows how the commercial triple quadrupole orthogonal ToF mass spectrometer was interfaced with a C60 ion source. [101]
In addition, this platform allows for the study of the fundamental aspects of MALDI, such as the effects of different matrix application techniques on the spatial resolution and desorption characteristics.
The ability of this instrument to successfully analyze lipids directly from tissue and cells has been recently demonstrated [102]. Intact phospholipids of a single neuron from an aplysia californica sea slug (Fig. 10) were resolved. With the help of MALDI, tandem MS, and knowledge of matrix effects and respective fragmentation pathways, peaks at m/z 768 and m/z 784 were identified as the sodium- and potassium-adducts of ether-containing glycerophosphocholine at m/z 746, respectively. In addition, the peaks at m/z 709.5 and m/z 725 were identified as a high mass fragments of m/z 768 and m/z 784, respectively.
Fig. 10.
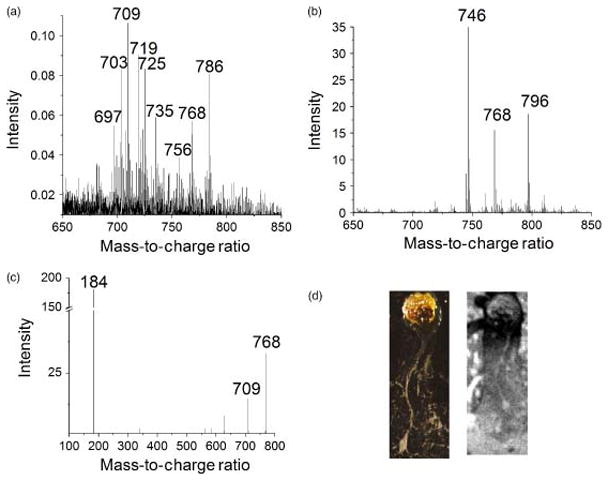
Lipid profile obtained from a single neuron with SIMS (a) and from a compilation of neurons with MALDI (b). The tandem MS spectrum shows that m/z 709 and 184 are major fragments of m/z 768.5, the sodiated adduct of major lipid component m/z 746.5 (c). Optical image (d, left) and black and white SIMS total ion image (d, right) of cultured aplysia neuron on silicon wafer (image size 2.00 × 4.75 mm). [102]
The Vickerman group at the surface analysis centre in Manchester, in cooperation with Ionoptika Ltd. and Scientific Analysis Instruments (SIA), has developed a new SIMS instrument called the Ionoptika J105 3D Chemical Imager (Fig. 11) [100]. The instrument employs a 40 keV C60+ ion gun that is operated in a direct current (dc) mode under high vacuum conditions. Secondary ions extracted with high voltage are collisionally cooled and energy-filtered before being pulsed into a buncher; where they are focused in the time domain and subsequently injected into a harmonic field ToF mass analyzer. A collision cell is positioned after the buncher for tandem MS analysis.
Fig. 11.

Schematic of Ionoptika J105 3D Chemical Imager (a) and close up diagram of time focusing buncher, collision cell for tandem MS acquisitions and ToF mass analyze (b). [100]
The time focusing buncher is the crucial element to the versatility and performance of the instrument. The buncher is responsible for decoupling the secondary ion beam with the ion formation event, a necessary procedure for combining a continuous secondary ion beam with a ToF mass analyzer. In addition, the resolution of the buncher’s time focus defines the spectral mass resolution, which for the J105 Chemical Imager is specified to be 10000 at mass 500. High ion transmission through the buncher makes the system highly sensitive and reduces duty cycle, making analyses quick and easy.
The Ionoptika J105 3D Chemical Imager has been designed with the specific purpose of analyzing biological samples. Accessories such as a glove box for storing and facilitating the transfer of frozen hydrated samples into the vacuum and a cryogenic compatible stage for maintaining sample integrity throughout the analysis are incorporated for optimal biological sample management. The ability of the instrument to construct 3-dimensional images of lipid fragments directly from frozen hydrated cells is demonstrated in Fig. 12 [103].
Fig. 12.
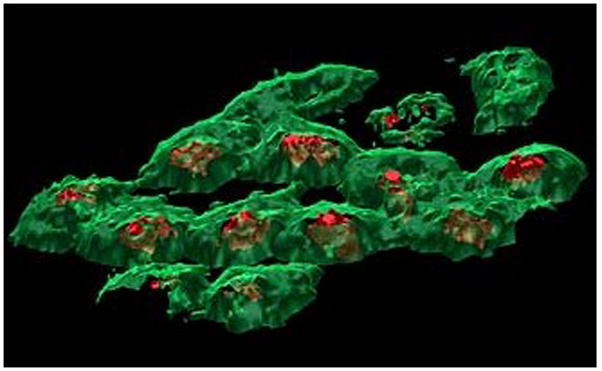
3D biochemical images of frozen hydrated HeLa M cells depicting localizations of phosphocholine headgroup (m/z 184, green) on the cell membranes and adenine (m/z 136.1, red) localized to the nucleus obtained on the Ionoptika J105 3D Chemical Imager. [22, 103]
10. Conclusions
Since lipids play a significant role in basic cellular processes, it is important to study and understand these molecules. As illustrated here, ToF-SIMS is an emerging platform for lipid-based imaging studies. The technique been successfully applied to elucidating a number of biological quandaries and complex biological processes. Several recent achievements in both technology and methodology promise to further expand the impact of these studies.
Although these are important qualities associated with the techniques, ToF-SIMS has still not been widely applied to solving biological problems or in clinical research. Hopefully the advent of newer high performance instruments, such as the C60+ QSTAR and J105, which are designed specifically to target biological sample applications, will break down this wall and push ToF-SIMS further into the field of biochemistry and biomedicine.
Highlights.
Recent instrumental and sample preparation methodological advances achieved in ToF-SIMS, as well as the successful applications of these advances in the detection of lipid from biological material are described in this review. The performance of ToF-SIMS is compared to similar imaging techniques, including MALDI, DESI and dynamic SIMS. Various lipid species detected and identified using ToF-SIMS are compiled in tables and organized using the lipid classification system established by the Lipid MAPS consortium.
Acknowledgments
The authors would like to acknowledge the LipidMAPS Consortium(GM069338-07) for financial support. Also additional financial support from the National Institutes of Health (2R01 EB002016-18) and the National Science Foundation (# CHE-0908226) is appreciated.
Abbreviations
- SIMS
secondary ion mass spectrometry
- ToF-SIMS
time-of-flight secondary ion mass spectrometry
- IMS
imaging mass spectrometry
- MALDI
matrix-assisted laser desorption ionization
- DESI
desorption electrospray ionization
- FAB
fast atom bombardment
- gallium
Ga
- ITO
indium tinoxide
- OCT
cutting temperature
- DPPC
1,2–dipalmitoyl-sn-glycero-3-phosphocholine
- GPCho
glycerphosphocholines
- GPIns
glycerophosphoinositols
- TLC
thin layer chromatography
- LC-MS
liquid chromatography mass spectrometry
- DAGS
diacylglycerides
- TAGS
triacylglycerides
- PLA
phospholipase A
- GPEthn
glycerophosphoethanolamine
- 2-AeP
2-aminoethylphosphonolipids
- SM
sphingomyelin
- MetA
metal assisted
- Me
matrix enhanced
- SEM
secondary electron microscopy
- TEM
transmission electron microscopy
- In
Indium
- CID
collision induced dissociation
- Q1
quadrupole 1
- Q2
quadrupole 2
- SIA
Scientific Analysis Instruments
- DC
direct current
Footnotes
Publisher's Disclaimer: This is a PDF file of an unedited manuscript that has been accepted for publication. As a service to our customers we are providing this early version of the manuscript. The manuscript will undergo copyediting, typesetting, and review of the resulting proof before it is published in its final citable form. Please note that during the production process errors may be discovered which could affect the content, and all legal disclaimers that apply to the journal pertain.
References
- 1.Braun RM, Beyder A, Xu JY, Wood MC, Ewing AG, Winograd N. Spatially resolved detection of attomole quantities of organic molecules localized in picoliter vials using time-of-flight secondary ion mass spectrometry. Analytical Chemistry. 1999;71:3318–3324. doi: 10.1021/ac9902042. [DOI] [PubMed] [Google Scholar]
- 2.Kollmer F. Cluster primary ion bombardment of organic materials. Applied Surface Science. 2004;231:153–158. [Google Scholar]
- 3.Fuchs B, Suss R, Schiller J. An update of MALDI-TOF mass spectrometry in lipid research. Prog Lipid Res. 2010;49:450–475. doi: 10.1016/j.plipres.2010.07.001. [DOI] [PubMed] [Google Scholar]
- 4.Murphy RC, Hankin JA, Barkley RM. Imaging of lipid species by MALDI mass spectrometry. J Lipid Res. 2009;50:S317–S322. doi: 10.1194/jlr.R800051-JLR200. [DOI] [PMC free article] [PubMed] [Google Scholar]
- 5.Sullards MC, Chen Y, Liu Y, Merrill AH. Imaging of lipids directly from brain tissue via matrix assisted laser desorption ionization Time-of-Flight Mass Spectrometry (MALDI TOF MS) J Neurochem. 2010;113:92. [Google Scholar]
- 6.Woods AS, Jackson SN. Brain tissue lipidomics: Direct probing using matrix-assisted laser desorption/ionization mass spectrometry. Aaps Journal. 2006;8:E391–E395. doi: 10.1007/BF02854910. [DOI] [PMC free article] [PubMed] [Google Scholar]
- 7.Dill AL, Ifa DR, Manicke NE, Zheng OY, Cooks RG. Mass spectrometric imaging of lipids using desorption electrospray ionization. Journal of Chromatography B-Analytical Technologies in the Biomedical and Life Sciences. 2009;877:2883–2889. doi: 10.1016/j.jchromb.2008.12.058. [DOI] [PMC free article] [PubMed] [Google Scholar]
- 8.Gerbig S, Takats Z. Analysis of triglycerides in food items by desorption electrospray ionization mass spectrometry. Rapid Communications in Mass Spectrometry. 2010;24:2186–2192. doi: 10.1002/rcm.4630. [DOI] [PubMed] [Google Scholar]
- 9.Girod M, Shi YZ, Cheng JX, Cooks RG. Desorption Electrospray Ionization Imaging Mass Spectrometry of Lipids in Rat Spinal Cord. Journal of the American Society for Mass Spectrometry. 2010;21:1177–1189. doi: 10.1016/j.jasms.2010.03.028. [DOI] [PubMed] [Google Scholar]
- 10.Ifa DR, Wiseman JM, Song QY, Cooks RG. Development of capabilities for imaging mass spectrometry under ambient conditions with desorption electrospray ionization (DESI) International Journal of Mass Spectrometry. 2007;259:8–15. [Google Scholar]
- 11.Li M, Chen H, Yang X, Chen J, Li C. Direct quantification of organic acids in aerosols by desorption electrospray ionization mass spectrometry. Atmospheric Environment. 2009;43:2717–2720. [Google Scholar]
- 12.Manicke NE, Nefliu M, Wu CP, Woods JW, Reiser V, Hendrickson RC, Cooks RG. Imaging of Lipids in Atheroma by Desorption Electrospray Ionization Mass Spectrometry. Analytical Chemistry. 2009;81:8702–8707. doi: 10.1021/ac901739s. [DOI] [PMC free article] [PubMed] [Google Scholar]
- 13.Manicke NE, Wiseman JM, Ifa DR, Cooks RG. Desorption electrospray ionization (DESI) mass Spectrometry and tandem mass spectrometry (MS/MS) of phospholipids and sphingolipids: Ionization, adduct formation, and fragmentation. Journal of the American Society for Mass Spectrometry. 2008;19:531–543. doi: 10.1016/j.jasms.2007.12.003. [DOI] [PubMed] [Google Scholar]
- 14.Paglia G, Ifa DR, Wu CP, Corso G, Cooks RG. Desorption Electrospray Ionization Mass Spectrometry Analysis of Lipids after Two-Dimensional High-Performance Thin-Layer Chromatography Partial Separation. Analytical Chemistry. 2010;82:1744–1750. doi: 10.1021/ac902325j. [DOI] [PMC free article] [PubMed] [Google Scholar]
- 15.Wiseman JM, Ifa DR, Song QY, Cooks RG. Tissue imaging at atmospheric pressure using desorption electrospray ionization (DESI) mass spectrometry. Angewandte Chemie-International Edition. 2006;45:7188–7192. doi: 10.1002/anie.200602449. [DOI] [PubMed] [Google Scholar]
- 16.Wiseman JM, Ifa DR, Venter A, Cooks RG. Ambient molecular imaging by desorption electrospray ionization mass spectrometry. Nature Protocols. 2008;3:517–524. doi: 10.1038/nprot.2008.11. [DOI] [PubMed] [Google Scholar]
- 17.Wolstenholme R, Bradshaw R, Clench MR, Francese S. Study of latent fingermarks by matrix-assisted laser desorption/ionisation mass spectrometry imaging of endogenous lipids. Rapid Communications in Mass Spectrometry. 2009;23:3031–3039. doi: 10.1002/rcm.4218. [DOI] [PubMed] [Google Scholar]
- 18.Wu CP, Ifa DR, Manicke NE, Cooks RG. Molecular imaging of adrenal gland by desorption electrospray ionization mass spectrometry. Analyst. 2010;135:28–32. doi: 10.1039/b919816d. [DOI] [PubMed] [Google Scholar]
- 19.McDonnell LA, Heeren RMA. Imaging mass spectrometry. Mass Spectrom Rev. 2007;26:606–643. doi: 10.1002/mas.20124. [DOI] [PubMed] [Google Scholar]
- 20.Pol J, Strohalm M, Havlicek V, Volny M. Molecular mass spectrometry imaging in biomedical and life science research. Histochemistry and Cell Biology. 2010;134:423–443. doi: 10.1007/s00418-010-0753-3. [DOI] [PubMed] [Google Scholar]
- 21.van Hove ERA, Smith DF, Heeren RMA. A concise review of mass spectrometry imaging. Journal of Chromatography A. 2010;1217:3946–3954. doi: 10.1016/j.chroma.2010.01.033. [DOI] [PubMed] [Google Scholar]
- 22.Vickerman JC. Molecular Imaging and Depth Profiling by Mass Spectrometry – SIMS, MALDI or DESI? Analyst. 2011 doi: 10.1039/c1an00008j. [DOI] [PubMed] [Google Scholar]
- 23.Esquenazi E, Yang YL, Watrous J, Gerwick WH, Dorrestein PC. Imaging mass spectrometry of natural products. Natural Product Reports. 2009;26:1521–1534. doi: 10.1039/b915674g. [DOI] [PubMed] [Google Scholar]
- 24.Heeren RMA, McDonnell LA, Amstalden E, Luxembourg SL, Altelaar AFM, Piersma SR. Why don’t biologists use SIMS? A critical evaluation of imaging MS. Applied Surface Science. 2006;252:6827–6835. [Google Scholar]
- 25.Jurchen JC, Rubakhin SS, Sweedler JV. MALDI-MS imaging of features smaller than the size of the laser beam. Journal of the American Society for Mass Spectrometry. 2005;16:1654–1659. doi: 10.1016/j.jasms.2005.06.006. [DOI] [PubMed] [Google Scholar]
- 26.Holle A, Haase A, Kayser M, Hohndorf J. Optimizing UV laser focus profiles for improved MALDI performance. Journal of Mass Spectrometry. 2006;41:705–716. doi: 10.1002/jms.1041. [DOI] [PubMed] [Google Scholar]
- 27.Hankin JA, Barkley RM, Murphy RC. Sublimation as a method of matrix application for mass spectrometric imaging. Journal of the American Society for Mass Spectrometry. 2007;18:1646–1652. doi: 10.1016/j.jasms.2007.06.010. [DOI] [PMC free article] [PubMed] [Google Scholar]
- 28.Bond P, McEwen AB, Wood SG, Clench M. MALDI- Imaging of Endogenous Lipids in Tumour Xenographs. Drug Metabolism Reviews. 2010;42:48–49. [Google Scholar]
- 29.Fournier I, Wisztorski M, Salzet M. Tissue imaging using MALDI-MS: a new frontier of histopathology proteomics. Expert Review of Proteomics. 2008;5:413–424. doi: 10.1586/14789450.5.3.413. [DOI] [PubMed] [Google Scholar]
- 30.Liu Y, Chen Y, Momin A, Shaner R, Wang E, Bowen NJ, Matyunina LV, Walker LD, McDonald JF, Sullards MC, Merrill AH., Jr Elevation of sulfatides in ovarian cancer: An integrated transcriptomic and lipidomic analysis including tissue-imaging mass spectrometry. Molecular Cancer. 2010;9:Article No.: 186. doi: 10.1186/1476-4598-9-186. [DOI] [PMC free article] [PubMed] [Google Scholar]
- 31.Rauser S, Deininger SO, Suckau D, Hofler H, Walch A. Approaching MALDI molecular imaging for clinical proteomic research: current state and fields of application. Expert Review of Proteomics. 2010;7:927–941. doi: 10.1586/epr.10.83. [DOI] [PubMed] [Google Scholar]
- 32.Stoeckli M, Knochenmuss R, McCombie G, Mueller D, Rohner T, Staab D, Wiederhold KH. MALDI MS imaging of amyloid. Amyloid, Prions, and Other Protein Aggregates Pt B. 2006;412:94–106. doi: 10.1016/S0076-6879(06)12007-8. [DOI] [PubMed] [Google Scholar]
- 33.Reyzer ML, Hsieh YS, Ng K, Korfmacher WA, Caprioli RM. Direct analysis of drug candidates in tissue by matrix-assisted laser desorption/ionization mass spectrometry. Journal of Mass Spectrometry. 2003;38:1081–1092. doi: 10.1002/jms.525. [DOI] [PubMed] [Google Scholar]
- 34.Wisztorski M, Lemaire R, Stauber J, Menguellet SA, Jardin-Mathe O, Day R, Salzet M, Fournier I. MALDI imaging: a new technology to discover and validate new biomarkers. M S-Medecine Sciences. 2007;23:31–36. doi: 10.1051/medsci/2007231s31. [DOI] [PubMed] [Google Scholar]
- 35.Griffiths WJ, Wang YQ. Mass spectrometry: from proteomics to metabolomics and lipidomics. Chemical Society Reviews. 2009;38:1882–1896. doi: 10.1039/b618553n. [DOI] [PubMed] [Google Scholar]
- 36.Malm J, Giannaras D, Riehle MO, Gadegaard N, Sjovall P. Fixation and Drying Protocols for the Preparation of Cell Samples for Time-of-Flight Secondary Ion Mass Spectrometry Analysis. Analytical Chemistry. 2009;81:7197–7205. doi: 10.1021/ac900636v. [DOI] [PubMed] [Google Scholar]
- 37.Nygren H, Borner K, Malmberg P, Hagenhoff B. Localization of cholesterol in rat cerebellum with imaging TOF-SIMS - Effect of tissue preparation. Applied Surface Science. 2006;252:6975–6981. [Google Scholar]
- 38.Nygren H, Borner K, Malmberg P, Tallarek E, Hagenhoff B. Imaging TOF-SIMS of rat kidney prepared by high-pressure freezing. Microscopy Research and Technique. 2005;68:329–334. doi: 10.1002/jemt.20258. [DOI] [PubMed] [Google Scholar]
- 39.Chandra S, Bernius MT, Morrison GH. INTRACELLULAR-LOCALIZATION OF DIFFUSIBLE ELEMENTS IN FROZEN-HYDRATED BIOLOGICAL SPECIMENS WITH ION MICROSCOPY. Analytical Chemistry. 1986;58:493–496. doi: 10.1021/ac00293a053. [DOI] [PubMed] [Google Scholar]
- 40.Chandra S. Challenges of biological sample preparation for SIMS imaging of elements and molecules at subcellular resolution. Applied Surface Science. 2008;255:1273–1284. [Google Scholar]
- 41.Kurczy ME, Piehowski PD, Parry SA, Jiang M, Chen G, Ewing AG, Winograd N. Which is more important in bioimaging SIMS experiments-The sample preparation or the nature of the projectile? Applied Surface Science. 2008;255:1298–1304. doi: 10.1016/j.apsusc.2008.05.139. [DOI] [PMC free article] [PubMed] [Google Scholar]
- 42.Cheng J, Wucher A, Winograd N. Molecular depth profiling with cluster ion beams. Journal of Physical Chemistry B. 2006;110:8329–8336. doi: 10.1021/jp0573341. [DOI] [PubMed] [Google Scholar]
- 43.Piwowar AM, Fletcher JS, Kordys J, Lockyer NP, Winograd N, Vickerman JC. Effects of Cryogenic Sample Analysis on Molecular Depth Profiles with TOF-Secondary Ion Mass Spectrometry. Analytical Chemistry. 2010;82:8291–8299. doi: 10.1021/ac101746h. [DOI] [PubMed] [Google Scholar]
- 44.Lanekoff I, Kurczy ME, Hill R, Fletcher JS, Vickerman JC, Winograd N, Sjovall P, Ewing AG. Time of Flight Mass Spectrometry Imaging of Samples Fractured In Situ with a Spring-Loaded Trap System. Analytical Chemistry. 2010;82:6652–6659. doi: 10.1021/ac101243b. [DOI] [PMC free article] [PubMed] [Google Scholar]
- 45.Jones EA, Lockyer NP, Vickerman JC. Depth profiling brain tissue sections with a 40 keV C-60(+) primary ion beam. Analytical Chemistry. 2008;80:2125–2132. doi: 10.1021/ac702127q. [DOI] [PubMed] [Google Scholar]
- 46.Piwowar AM, Lockyer NP, Vickerman JC. Salt Effects on Ion Formation in Desorption Mass Spectrometry: An Investigation into the Role of Alkali Chlorides on Peak Suppression in Time-of-Flight-Secondary Ion Mass Spectrometry. Analytical Chemistry. 2009;81:1040–1048. doi: 10.1021/ac8020888. [DOI] [PubMed] [Google Scholar]
- 47.McGuiness CL, Shaporenko A, Zharnikov M, Walker AV, Allara DL. Molecular self-assembly at bare semiconductor surfaces: Investigation of the chemical and electronic properties of the alkanethiolate-GaAs(001) interface. Journal of Physical Chemistry C. 2007;111:4226–4234. [Google Scholar]
- 48.Chu PK, Odom RW, Reich DF. Analysis of surface particles by time-of-flight secondary ion mass spectrometry. Materials Chemistry and Physics. 1996;43:87–94. [Google Scholar]
- 49.Mahoney CM. CLUSTER SECONDARY ION MASS SPECTROMETRY OF POLYMERS AND RELATED MATERIALS. Mass Spectrom Rev. 2010;29:247–293. doi: 10.1002/mas.20233. [DOI] [PubMed] [Google Scholar]
- 50.Mathieu HJ, Chevolot Y, Ruiz-Taylor L, Leonard D. Engineering and Characterization of Polymer Surfaces for Biomedical Applications. Radiation Effects on Polymers for Biological Use. 2003;162:1–34. [Google Scholar]
- 51.Matsubara T, Hayashi A. FAB MASS-SPECTROMETRY OF LIPIDS. Prog Lipid Res. 1991;30:301–322. doi: 10.1016/0163-7827(91)90001-l. [DOI] [PubMed] [Google Scholar]
- 52.Barber M, Bordoli RS, Sedgwick RD, Tyler AN. FAST ATOM BOMBARDMENT OF SOLIDS (FAB) - A NEW ION-SOURCE FOR MASS-SPECTROMETRY. Journal of the Chemical Society-Chemical Communications. 1981:325–327. [Google Scholar]
- 53.Jensen NJ, Tomer KB, Gross ML. FAB MS/MS FOR PHOSPHATIDYLINOSITOL, -GLYCEROL, PHOSPHATIDYLETHANOLAMINE AND OTHER COMPLEX PHOSPHOLIPIDS. Lipids. 1987;22:480–489. doi: 10.1007/BF02540363. [DOI] [PubMed] [Google Scholar]
- 54.Winograd N. The magic of cluster SIMS. Analytical Chemistry. 2005;77:142A–149A. [Google Scholar]
- 55.Xu J, Ostrowski S, Szakal C, Ewing AG, Winograd N. ToF-SIMS imaging with cluster ion beams. Applied Surface Science. 2004;231:159–163. [Google Scholar]
- 56.Postawa Z, Czerwinski B, Szewczyk M, Smiley EJ, Winograd N, Garrison BJ. Microscopic insights into the sputtering of Ag{111} induced by C-60 and Ga bombardment. Journal of Physical Chemistry B. 2004;108:7831–7838. [Google Scholar]
- 57.Postawa Z, Czerwinski B, Winograd N, Garrison BJ. Microscopic insights into the sputtering of thin organic films on Ag{111} induced by C-60 and Ga bombardment. Journal of Physical Chemistry B. 2005;109:11973–11979. doi: 10.1021/jp050821w. [DOI] [PubMed] [Google Scholar]
- 58.Ostrowski SG, Szakal C, Kozole J, Roddy TP, Xu JY, Ewing AG, Winograd N. Secondary ion MS imaging of lipids in picoliter vials with a buckminsterfullerene ion source. Analytical Chemistry. 2005;77:6190–6196. doi: 10.1021/ac0508189. [DOI] [PubMed] [Google Scholar]
- 59.Sjovall P, Lausmaa J, Johansson B. Mass spectrometric imaging of lipids in brain tissue. Analytical Chemistry. 2004;76:4271–4278. doi: 10.1021/ac049389p. [DOI] [PubMed] [Google Scholar]
- 60.Sjovall P, Johansson B, Lausmaa J. Localization of lipids in freeze-dried mouse brain sections by imaging TOF-SIMS. Applied Surface Science. 2006;252:6966–6974. [Google Scholar]
- 61.Benabdellah F, Seyer A, Quinton L, Touboul D, Brunelle A, Laprevote O. Mass spectrometry imaging of rat brain sections: nanomolar sensitivity with MALDI versus nanometer resolution by TOF-SIMS. Analytical and Bioanalytical Chemistry. 2010;396 doi: 10.1007/s00216-009-3031-2. [DOI] [PubMed] [Google Scholar]
- 62.Hankin JA, Murphy RC. Relationship between MALDI IMS Intensity and Measured Quantity of Selected Phospholipids in Rat Brain Sections. Analytical Chemistry. 2010;82:8476–8484. doi: 10.1021/ac101079v. [DOI] [PMC free article] [PubMed] [Google Scholar]
- 63.Borner K, Nygren H, Hagenhoff B, Malmberg P, Tallarek E, Mansson JE. Distribution of cholesterol and galactosylceramide in rat cerebellar white matter. Biochimica Et Biophysica Acta-Molecular and Cell Biology of Lipids. 2006;1761:335–344. doi: 10.1016/j.bbalip.2006.02.021. [DOI] [PubMed] [Google Scholar]
- 64.Nygren H, Borner K, Hagenhoff B, Malmberg P, Mansson JE. Localization of cholesterol, phosphocholine and galactosylceramide in rat cerebellar cortex with imaging TOF-SIMS equipped with a bismuth cluster ion source. Biochimica Et Biophysica Acta-Molecular and Cell Biology of Lipids. 2005;1737:102–110. doi: 10.1016/j.bbalip.2005.10.004. [DOI] [PubMed] [Google Scholar]
- 65.Nygren H, Malmberg P. High resolution imaging by organic secondary ion mass spectrometry. Trends in Biotechnology. 2007;25:499–504. doi: 10.1016/j.tibtech.2007.07.010. [DOI] [PubMed] [Google Scholar]
- 66.Pernber Z, Richter K, Mansson JE, Nygren H. Sulfatide with different fatty acids has unique distributions in cerebellum as imaged by Time-Of-Flight Secondary Ion Mass Spectrometry (TOF-SIMS) Biochimica Et Biophysica Acta-Molecular and Cell Biology of Lipids. 2007;1771:202–209. doi: 10.1016/j.bbalip.2006.12.007. [DOI] [PubMed] [Google Scholar]
- 67.Amaya KR, Monroe EB, Sweedler JV, Clayton DF. Lipid imaging in the zebra finch brain with secondary ion mass spectrometry. International Journal of Mass Spectrometry. 2007;260:121–127. [Google Scholar]
- 68.Debois D, Brunelle A, Laprevote O. Attempts for molecular depth profiling directly on a rat brain tissue section using fullerene and bismuth cluster ion beams. International Journal of Mass Spectrometry. 2007;260:115–120. [Google Scholar]
- 69.Monroe EB, Annangudi SR, Hatcher NG, Gutstein HB, Rubakhin SS, Sweedler JV. SIMS and MALDI MS imaging of the spinal cord. Proteomics. 2008;8:3746–3754. doi: 10.1002/pmic.200800127. [DOI] [PMC free article] [PubMed] [Google Scholar]
- 70.Debois D, Bralet MP, Le Naour F, Brunelle A, Laprevote O. In Situ Lipidomic Analysis of Nonalcoholic Fatty Liver by Cluster TOF-SIMS Imaging. Analytical Chemistry. 2009;81:2823–2831. doi: 10.1021/ac900045m. [DOI] [PubMed] [Google Scholar]
- 71.Fletcher JS, Lockyer NP, Vickerman JC. Molecular SIMS imaging; spatial resolution and molecular sensitivity: have we reached the end of the road? Is there light at the end of the tunnel? Surface and Interface Analysis. 2010 [Google Scholar]
- 72.Nygren H, Malmberg P, Kriegeskotte C, Arlinghaus HF. Bioimaging TOF-SIMS: localization of cholesterol in rat kidney sections. Febs Letters. 2004;566:291–293. doi: 10.1016/j.febslet.2004.04.052. [DOI] [PubMed] [Google Scholar]
- 73.Malmberg P, Nygren H, Richter K, Chen Y, Dangardt F, Friberg P, Magnusson Y. Imaging of lipids in human adipose tissue by cluster ion TOF-SIMS. Microscopy Research and Technique. 2007;70:828–835. doi: 10.1002/jemt.20481. [DOI] [PubMed] [Google Scholar]
- 74.Belazi D, Sole-Domenech S, Johansson B, Schalling M, Sjovall P. Chemical analysis of osmium tetroxide staining in adipose tissue using imaging ToF-SIMS. Histochemistry and Cell Biology. 2009;132:105–115. doi: 10.1007/s00418-009-0587-z. [DOI] [PubMed] [Google Scholar]
- 75.Magnusson Y, Friberg P, Sjovall P, Dangardt F, Malmberg P, Chen Y. Lipid imaging of human skeletal muscle using TOF-SIMS with bismuth cluster ion as a primary ion source. Clinical Physiology and Functional Imaging. 2008;28:202–209. doi: 10.1111/j.1475-097X.2008.00796.x. [DOI] [PubMed] [Google Scholar]
- 76.Tahallah N, Brunelle A, De La Porte S, Laprevote O. Lipid mapping in human dystrophic muscle by cluster-time-of-flight secondary ion mass spectrometry imaging. J Lipid Res. 2008;49:438–454. doi: 10.1194/jlr.M700421-JLR200. [DOI] [PMC free article] [PubMed] [Google Scholar]
- 77.Malmberg P, Borner K, Chen Y, Friberg P, Hagenhoff B, Mansson JE, Nygren H. Localization of lipids in the aortic wall with imaging TOF-SIMS. Biochimica Et Biophysica Acta-Molecular and Cell Biology of Lipids. 2007;1771:185–195. doi: 10.1016/j.bbalip.2006.12.003. [DOI] [PubMed] [Google Scholar]
- 78.Gong H, Amemiya T, Takaya K, Tozu M, Ohashi Y. Time-of-flight secondary ion mass spectrometry of fatty acids in rat retina. Applied Surface Science. 2003;203:734–737. [Google Scholar]
- 79.Touboul D, Brunelle A, Halgand F, De La Porte S, Laprevote O. Lipid imaging by gold cluster time-of-flight secondary ion mass spectrometry: application to Duchenne muscular dystrophy. J Lipid Res. 2005;46:1388–1395. doi: 10.1194/jlr.M500058-JLR200. [DOI] [PubMed] [Google Scholar]
- 80.Touboul D, Roy S, Germain DP, Chaminade P, Brunelle A, Laprevote O. MALDI-TOF and cluster-TOF-SIMS imaging of Fabry disease biomarkers. International Journal of Mass Spectrometry. 2007;260:158–165. [Google Scholar]
- 81.Brulet M, Seyer A, Edelman A, Brunelle A, Fritsch J, Ollero M, Laprevote O. Lipid mapping of colonic mucosa by cluster TOF-SIMS imaging and multivariate analysis in cftr knockout mice. J Lipid Res. 2010;51:3034–3045. doi: 10.1194/jlr.M008870. [DOI] [PMC free article] [PubMed] [Google Scholar]
- 82.Colliver TL, Brummel CL, Pacholski ML, Swanek FD, Ewing AG, Winograd N. Atomic and molecular imaging at the single-cell level with TOF-SIMS. Analytical Chemistry. 1997;69:2225–2231. doi: 10.1021/ac9701748. [DOI] [PubMed] [Google Scholar]
- 83.Pacholski L, Cannon DM, Ewing AG, Winograd N. Static time-of-flight secondary ion mass spectrometry imaging of freeze-fractured, frozen-hydrated biological membranes. Rapid Communications in Mass Spectrometry. 1998;12:1232. doi: 10.1002/(SICI)1097-0231(19980930)12:18<1232::AID-RCM319>3.0.CO;2-G. [DOI] [PubMed] [Google Scholar]
- 84.Ostrowski SG, Van Bell CT, Winograd N, Ewing AG. Mass spectrometric imaging of highly curved membranes during Tetrahymena mating. Science. 2004;305:71–73. doi: 10.1126/science.1099791. [DOI] [PMC free article] [PubMed] [Google Scholar]
- 85.Kurczy ME, Piehowski PD, Van Bell CT, Heien ML, Winograd N, Ewing AG. Mass spectrometry imaging of mating Tetrahymena show that changes in cell morphology regulate lipid domain formation. Proceedings of the National Academy of Sciences of the United States of America. 2010;107:2751–2756. doi: 10.1073/pnas.0908101107. [DOI] [PMC free article] [PubMed] [Google Scholar]
- 86.Monroe EB, Jurchen JC, Lee J, Rubakhin SS, Sweedler JV. Vitamin E imaging and localization in the neuronal membrane. Journal of the American Chemical Society. 2005;127:12152–12153. doi: 10.1021/ja051223y. [DOI] [PubMed] [Google Scholar]
- 87.Carado A, Kozole J, Passarelli M, Winograd N, Loboda A, Bunch J, Wingate J, Hankin J, Murphy R. Biological tissue imaging with a hybrid cluster SIMS quadrupole time-of-flight mass spectrometer. Applied Surface Science. 2008;255:1572–1575. [Google Scholar]
- 88.Arlt S, Beisiegel U, Kontush A. Lipid peroxidation in neurodegeneration: new insights into Alzheimer’s disease. Curr Opin Lipidology. 2002;13:289–294. doi: 10.1097/00041433-200206000-00009. [DOI] [PubMed] [Google Scholar]
- 89.Dexter DT, Carter CJ, Wells FR, Javoyagid F, Agid Y, Lees A, Jenner P, Marsden CD. BASAL LIPID-PEROXIDATION IN SUBSTANTIA NIGRA IS INCREASED IN PARKINSONS-DISEASE. J Neurochem. 1989;52:381–389. doi: 10.1111/j.1471-4159.1989.tb09133.x. [DOI] [PubMed] [Google Scholar]
- 90.Yang HJ, Ishizaki I, Sanada N, Zaima N, Sugiura Y, Yao I, Ikegami K, Setou M. Detection of characteristic distributions of phospholipid head groups and fatty acids on neurite surface by time-of-flight secondary ion mass spectrometry. Medical Molecular Morphology. 2010;43:158–164. doi: 10.1007/s00795-009-0487-2. [DOI] [PubMed] [Google Scholar]
- 91.Altelaar AFM, Klinkert I, Jalink K, de Lange RPJ, Adan RAH, Heeren RMA, Piersma SR. Gold-enhanced biomolecular surface imaging of cells and tissue by SIMS and MALDI mass spectrometry. Analytical Chemistry. 2006;78:734–742. doi: 10.1021/ac0513111. [DOI] [PubMed] [Google Scholar]
- 92.Sun S, Szakal C, Roll T, Mazarov P, Wucher A, Winograd N. Use of C-60 cluster projectiles for sputter depth profiling of polycrystalline metals. Surface and Interface Analysis. 2004;36:1367–1372. [Google Scholar]
- 93.Sun S, Wucher A, Szakal C, Winograd N. Depth profiling of polycrystalline multilayers using a Buckminsterfullerene projectile. Applied Physics Letters. 2004;84:5177–5179. [Google Scholar]
- 94.Cheng J, Winograd N. Depth profiling of peptide films with TOF-SIMS and a C-60 probe. Analytical Chemistry. 2005;77:3651–3659. doi: 10.1021/ac048131w. [DOI] [PubMed] [Google Scholar]
- 95.Mao D, Wucher A, Winograd N. Molecular Depth Profiling with Cluster Secondary Ion Mass Spectrometry and Wedges. Analytical Chemistry. 2010;82:57–60. doi: 10.1021/ac902313q. [DOI] [PMC free article] [PubMed] [Google Scholar]
- 96.Fletcher JS, Lockyer NP, Vaidyanathan S, Vickerman JC. TOF-SIMS 3D biomolecular imaging of Xenopus laevis oocytes using buckminsterfullerene (C-60) primary ions. Analytical Chemistry. 2007;79:2199–2206. doi: 10.1021/ac061370u. [DOI] [PubMed] [Google Scholar]
- 97.Kleinfeld AM, Kampf JP, Lechene C. Transport of C-13-oleate in adipocytes measured using multi imaging mass Spectrometry. Journal of the American Society for Mass Spectrometry. 2004;15:1572–1580. doi: 10.1016/j.jasms.2004.07.010. [DOI] [PubMed] [Google Scholar]
- 98.Boxer SG, Kraft ML, Weber PK. Advances in Imaging Secondary Ion Mass Spectrometry for Biological Samples. Annual Review of Biophysics. 2009;38:53–74. doi: 10.1146/annurev.biophys.050708.133634. [DOI] [PubMed] [Google Scholar]
- 99.Kraft ML, Weber PK, Longo ML, Hutcheon ID, Boxer SG. Phase separation of lipid membranes analyzed with high-resolution secondary ion mass spectrometry. Science. 2006;313:1948–1951. doi: 10.1126/science.1130279. [DOI] [PubMed] [Google Scholar]
- 100.Fletcher JS, Rabbani S, Henderson A, Blenkinsopp P, Thompson SP, Lockyer NP, Vickerman JC. A New Dynamic in Mass Spectral Imaging of Single Biological Cells. Analytical Chemistry. 2008;80:9058–9064. doi: 10.1021/ac8015278. [DOI] [PubMed] [Google Scholar]
- 101.Carado A, Passarelli MK, Kozole J, Wingate JE, Winograd N, Loboda AV. C-60 Secondary Ion Mass Spectrometry with a Hybrid-Quadrupole Orthogonal Time-of-Flight Mass Spectrometer. Analytical Chemistry. 2008;80:7921–7929. doi: 10.1021/ac801712s. [DOI] [PMC free article] [PubMed] [Google Scholar]
- 102.Passarelli MK, Winograd N. Characterizing in situGlycerophospholipids with SIMS andMALDI Methodologies. Surf Interface Anal. 2010 doi: 10.1002/sia.3529. [DOI] [PMC free article] [PubMed] [Google Scholar]
- 103.Fletcher JS, Rabbani S, Henderson A, Lockyer NP, Vickerman JC. Three-dimensional mass spectral imaging of HeLa-M cells - sample preparation, data interpretation and visualisation. Rapid Communications in Mass Spectrometry. 2011;25:925–932. doi: 10.1002/rcm.4944. [DOI] [PubMed] [Google Scholar]
- 104.Debois D, Hamze K, Guerineau V, Le Caer JP, Holland IB, Lopes P, Ouazzani J, Seror SJ, Brunelle A, Laprevote O. In situ localisation and quantification of surfactins in a Bacillus subtilis swarming community by imaging mass spectrometry. Proteomics. 2008;8:3682–3691. doi: 10.1002/pmic.200701025. [DOI] [PubMed] [Google Scholar]
- 105.Seyer A, Einhorn J, Brunelle A, Laprevote O. Localization of Flavonoids in Seeds by Cluster Time-of-Flight Secondary Ion Mass Spectrometry Imaging. Analytical Chemistry. 2010;82:2326–2333. doi: 10.1021/ac902528t. [DOI] [PubMed] [Google Scholar]
- 106.Thiel V, Heim C, Arp G, Hahmann U, Sjovall P, Lausmaa J. Biomarkers at the microscopic range: ToF-SIMS molecular imaging of Archaea-derived lipids in a microbial mat. Geobiology. 2007;5:413–421. [Google Scholar]
- 107.Yang HJ, Sugiura Y, Ishizaki I, Sanada N, Ikegami K, Zaima N, Shrivas K, Setou M. Imaging of lipids in cultured mammalian neurons by matrix assisted laser/desorption ionization and secondary ion mass spectrometry. Surface and Interface Analysis. 2010;42:1606–1611. [Google Scholar]
- 108.Sjovall P, Lausmaa J, Nygren H, Carlsson L, Malmberg P. Imaging of membrane lipids in single cells by imprint-imaging time-of-flight secondary ion mass spectrometry. Analytical Chemistry. 2003;75:3429–3434. doi: 10.1021/ac0207675. [DOI] [PubMed] [Google Scholar]
- 109.Roddy TP, Cannon DM, Meserole CA, Winograd N, Ewing AG. Imaging of freeze-fractured cells with in situ fluorescence and time-of-flight secondary ion mass spectrometry. Analytical Chemistry. 2002;74:4011–4019. doi: 10.1021/ac0255734. [DOI] [PubMed] [Google Scholar]
- 110.Kurczy ME, Kozole J, Parry SA, Piehowski PD, Winograd N, Ewing AG. Relative quantification of cellular sections with molecular depth profiling ToF-SIMS imaging. Applied Surface Science. 2008;255:1158–1161. doi: 10.1016/j.apsusc.2008.05.018. [DOI] [PMC free article] [PubMed] [Google Scholar]
- 111.Piehowski PD, Carado AJ, Kurczy ME, Ostrowski SG, Heien ML, Winograd N, Ewing AG. MS/MS Methodology To Improve Subcellular Mapping of Cholesterol Using TOF-SIMS. Analytical Chemistry. 2008;80:8662–8667. doi: 10.1021/ac801591r. [DOI] [PMC free article] [PubMed] [Google Scholar]