

Abstract
Background
Chromosomal instability (CIN) is thought to be associated with poor prognosis in solid tumours, however, evidence from pre-clinical and mouse tumour models suggest that CIN may paradoxically enhance or impair cancer cell fitness. Breast cancer prognostic expression signature sets, which reflect tumour CIN status, efficiently delineate outcome in ER-positive breast cancer in contrast to ER-negative breast cancer, suggesting that the relationship of CIN with prognosis differs in these two breast cancer subtypes.
Methods
Direct assessment of CIN requires single cell analysis methods such as centromeric fluorescence in situ hybridisation (FISH) aimed at determining the variation around the modal number of two or more chromosomes within individual tumour nuclei. Here we document the frequency of tumour CIN by dual centromeric FISH analysis in a retrospective primary breast cancer cohort of 246 patients with survival outcome.
Results
There was increased CIN and clonal heterogeneity in ER-negative compared to ER-positive breast cancer. Consistent with a negative impact of CIN on cellular fitness, extreme CIN in ER-negative breast cancer was an independent variable associated with improved long-term survival in multivariate analysis. In contrast, a linear relationship of increasing CIN with poorer prognosis in ER-positive breast cancer was observed, using three independent measures of CIN.
Conclusions
The paradoxical relationship between extreme CIN and cancer outcome in the ER-negative cohorts may explain why prognostic expression signatures, reflecting tumour CIN status, fail to predict outcome in this subgroup.
Impact
Assessment of tumour CIN status may support risk stratification in ER negative breast cancer and requires prospective validation.
Keywords: Chromosomal instability, CIN, Fluorescence in-situ hybridisation, Clonal heterogeneity, Aneuploidy, ER-negative, Breast cancer
Introduction
Faithful segregation of chromosomes to daughter cells during mitosis maintains chromosome stability and a diploid genome. Altered mitotic spindle assembly checkpoint function, centrosome duplication, kinetochore function and microtubule stability have been implicated in chromosome missegregation and the ensuing pattern of chromosomal instability (CIN) in cancer model systems (1).
The poor prognosis associated with CIN in solid tumours, including breast cancer (2-4), may relate to the ability of CIN tumours to adapt more readily to environmental or stromal-pressures, owing to intra-tumour heterogeneity and diversity among cancer cells (5-7). Consistent with the proposal that CIN confers an adaptive advantage, in murine lung tumours induced by activated KRAS expression, aneuploidy caused by transient MAD2 over-expression promotes rapid tumour relapse following withdrawal of the activated KRAS stimulus (8) and aneuploidy induction in yeast generates phenotypic variation driving survival under adverse conditions such as drug exposure (9).
However, aneuploidy may also slow growth of yeast and mammalian cells and CIN is poorly tolerated by cancer cells when induced through spindle assembly checkpoint inactivation or multipolar mitoses (10-14). Accordingly, elevation of the frequency of chromosome missegregation has been proposed as a strategy to kill tumour cells (15). In summary, pre-clinical evidence indicates that CIN can have a negative impact upon cancer cell viability, suggesting that extreme-CIN in vivo may prove both detrimental to cancer cell biological fitness and unsustainable for tumour progression (6).
Identification of methods to predict breast cancer clinical outcome, particularly in Estrogen Receptor (ER) negative disease, are of paramount importance in order to identify patients at higher risk of relapse who may therefore require more aggressive adjuvant therapy. In this regard, prognostic gene expression approaches, such as Oncotype DX and MammaPrint®, which have utility in ER-positive breast cancer, have limited prognostic value in ER-negative disease (16).
Intriguingly, evidence is beginning to emerge that these prognostic expression signatures also reflect breast cancer CIN status as measured by DNA image cytometry-based techniques (17). Conceivably, the combined observations that prognostic expression signatures reflect tumour CIN status but fail to predict outcome in ER-negative breast cancer, may be related to a paradoxical relationship between chromosomal instability and clinical outcome in ER-negative disease, whereby intermediate and extreme chromosomal instability are associated with poor and good prognosis respectively. Thus, as prognostic signature expression increases, reflecting increased CIN, instead of prognosis worsening, paradoxically, outcome might be improved due to a negative impact of genome instability upon cancer cell biological fitness. Conversely, the robust prognostic relationship of gene signature expression with outcome in ER-positive disease might imply that the association of CIN with risk of death might approximate to a linearly increasing relationship in this subtype.
In order to test this hypothesis and assess whether extreme CIN might be associated with improved clinical outcome in ER-negative breast cancer in contrast to ER-positive breast cancer, we identified a tissue microarray cohort of 246 primary breast carcinomas with associated clinico-pathological details and survival outcome data. Using dual centromeric FISH analysis and standard approaches based on deviation from the modal chromosomal signal (18, 19) and a measure of tumour cell and ecological clonal heterogeneity, the Shannon Diversity Index (20), we have estimated the degree of numerical chromosomal heterogeneity within each of these tumours and explored the relationship between tumour chromosomal instability and clinical outcome in ER-negative and ER-positive breast cancer. We then test the concordance of our findings using two further methods of CIN determination by CGH and CIN70 expression in a meta-analysis of 832 ER-positive and 356 ER-negative breast cancer patients.
Methods
Tissue Microarray Cohort
Archival paraffin-embedded breast cancer tissue was obtained from 246 patients diagnosed at Leeds Teaching Hospitals NHS Trust between 1983–1997. Tissue microarrays (TMAs) were constructed containing cores, 0.6mm in diameter and 4μm in thickness, selected from representative tumour areas as determined by a consultant breast histopathologist (AMH) from H&E stained sections. Full clinico-pathological data was available (See table 1). Ethical approval was obtained (Leeds East 05/Q1206/136).
Table 1. Clinico-pathological characteristics of the Leeds TMA cohort and distribution of histopathological parameters for all patients across MCD cohorts.
P values: Cochrane-Armitage trend tests with multiple testing correction. Significant results (labelled with asterixes) suggest a trend in proportions of histopathological parameters across MCD cohorts (e.g. increasing proportions of ER-negative patients across MCD cohorts). Each particular tumour grade is tested against the remaining two grade types. Tumours with size > 2 cm are tested against tumours between 0-2 cm.
| Whole Cohort |
MCD1 | MCD2 | MCD3 | MCD4 | p value | adjusted p | |
|---|---|---|---|---|---|---|---|
| Number Patients | 246 | 77 | 77 | 59 | 33 | ||
| Median Age Years | 58 | 61 | 57 | 58 | 57 | ||
| Range | 29 - 92 | 31 - 91 | 35 - 89 | 29 – 92 | 33 - 80 | ||
|
| |||||||
| Age(%) | 0.1 | 0.40 | |||||
| Age > 50 | 170(69) | 60(78) | 50(65) | 39(66) | 21(64) | ||
| Age ≤ 50 | 76(31) | 17(22) | 27(35) | 20(34) | 12(36) | ||
|
| |||||||
| Grade(%) | |||||||
| 1 | 46(18) | 17(22) | 19(25) | 8(13) | 2(6) | 0.03* | 0.15 |
| 2 | 93(38) | 37(48) | 26(34) | 17(29) | 13(39) | 0.12 | 0.40 |
| 3 | 106(43) | 23(30) | 31(40) | 34(58) | 18(55) | 0.001* | 0.007* |
| Unknown | 1(1) | 0(0) | 1(1) | 0(0) | 0(0) | ||
|
| |||||||
| ER Status(%) | 0.02* | 0.12 | |||||
| ER− | 53(21) | 13(17) | 12(16) | 17(29) | 11(33) | ||
| ER+ | 192(78) | 63(82) | 65(84) | 42(71) | 22(67) | ||
| Unknown | 1(1) | 1(1) | 0(0) | 0(0) | 0(0) | ||
|
| |||||||
|
ER/HER2
Status(%) |
|||||||
| ER−/HER2− | 41(16) | 8(10) | 11(15) | 15(26) | 7(21) | ||
| ER−/HER2+ | 12(5) | 5(7) | 1(1) | 2(3) | 4(12) | ||
| ER+/HER2+ | 11(4) | 2(3) | 4(5) | 5(9) | 0(0) | ||
| ER+/HER2− | 180(73) | 61(79) | 61(79) | 36(61) | 22(67) | ||
| Unknown | 2(1) | 1(1) | 0(0) | 1(1) | 0(0) | ||
|
| |||||||
| Node(%) | 0.69 | 1.0 | |||||
| No | 118(48) | 38(49) | 34(44) | 32(54) | 14(42) | ||
| Yes | 116(47) | 35(46) | 37(48) | 25(43) | 19(58) | ||
| Unknown | 12(5) | 4(5) | 6(8) | 2(3) | 0(0) | ||
|
| |||||||
| Size(%) | 0.64 | 1.0 | |||||
| 0 – 2 cm | 117(47) | 36(47) | 38(50) | 30(51) | 13(39) | ||
| 2 - 5 cm | 100(41) | 30(39) | 27(35) | 25(42) | 18(55) | ||
| ≥ 5 cm | 20(8) | 8(10) | 8(10) | 3(5) | 1(3) | ||
| Unknown | 9(4) | 3(4) | 4(5) | 1(3) | 1(3) | ||
FISH Analysis
Centromeric FISH allows an assessment of inter-cellular heterogeneity of chromosome number in contrast to other techniques such as aCGH. Dual colour fluorescence in situ hybridisation was carried out using two centromeric probes (CEP2 and CEP15 labelled with spectrum orange and spectrum green respectively (Abbott Laboratories)) using standard procedures. These chromosomes were selected on the basis of infrequent copy number alterations in a series of breast tumours analysed by 1Mb aCGH analysis in our laboratory in order that aberrations would more closely reflect underlying chromosomal numerical instability rather than structural chromosomal instability resulting from intra-chromosomal rearrangements. Briefly, following dewaxing the TMA slides were placed in SPoTLight Pretreatment buffer (Invitrogen) at 980C for 15mins, then washed. 300μl digestion enzyme was added to each slide, left for 4 minutes at room temperature then washed. 1.5μl of centromeric probes were mixed and diluted to give a final volume of 10μl per slide. Slides were incubated overnight at 370C. After washing slides were stained and mounted using DAPI antifade (Invitrogen). Slides were scanned and FISH images captured using a 40x objective on the Applied Imaging Ariol System (Applied Imaging), with seven 0.5μm z-stacks. 50 nuclei per core showing clear and discrete hybridisation signals for both chromosomes were scored manually.
Gene expression data analysis
We obtained raw microarray expression data for 13 publicly available breast cancer cohorts (21-31) and GSE2109 and GSE16446, representing 2125 individual patients. Additionally, we obtained gene expression data from 3 ovarian cancer cohorts (http://cancergenome.nih.gov/, (32, 33)) 2 squamous NSCLC cohorts (32, 34) and one gastric cancer cohort (35).
ER status was inferred by k-medoids clustering of the Affymetrix probeset 205225_at representing the ESR1 gene (36). CIN70 scores were calculated as the mean expression of the 70 genes of the CIN70 signature (2). To combine the breast cancer cohorts, CIN70 scores were centered within each cohort, and then divided by the standard deviation. All samples were stratified into CIN70 quartiles based on CIN70 scores of all tumours of the given cancer type. For the analysis of MammaPrint® and Genomic Grade Index (GGI), the mean of the expression values of all genes present in the particular expression signature multiplied by 1 or −1 to represent expression direction was used as a score.
SNP based measurements of structural complexity
Publicly available SNP data based on the Affymetrix 100k platform (37), representing 281 breast tumour specimens with paired expression data (22), was acquired from GEO. We determined the Genome Integrity Index as described (38). To determine the total number of DNA breakpoints, we counted the number of DNA segments with an inferred log2 ratio of greater/less than +/−0.3. The total number of LOH regions was inferred as described (39). To determine a combined structural complexity score composed of GII/number breakpoints/LOH score, we linearly transformed each set of scores, with no aberrations being assigned to 0, and the highest number of aberrations assigned a value of 1. We defined the combined structural complexity as the mean of the three transformed scores.
Statistical Analysis
For the breast cancer expression and SNP data cohorts and the gastric cancer cohort, survival analysis was performed with time to relapse or, if not available, time to distant metastasis as outcome variable. For the ovarian and squamous lung cohorts, the outcome variable was overall survival. To derive a CIN score based on centromeric signals, the number of centromeres in 50 nuclei were counted for chromosome 2 and 15. The mean (chromosome 15 and 2) percentage deviating from the modal centromere number was utilised to define four CIN score groups (Modal Centromere Deviation groups 1-4, MCD1 0-15%, MCD2 15%-30%, MCD3 30%-45% and MCD4 >45%) with similar range. To avoid false classification of CIN due to sectioning artefacts and to control for bimodality in diploid tumours, all centromere counts equal to one were removed for the derivation of the CIN score. In order to confirm the validity of this approach to identify tumours with the most extreme CIN, we performed two independent validations. The MCD score was compared to the measure of clonal heterogeneity, the Shannon Diversity Index, where centromere one counts were included. The Shannon Diversity Index (H) (20) was estimated for chromosome 15 and 2 using the formula:
where pi is the frequency of centromere signal, i. We also analysed a small cohort of normal breast tissue which confirmed including chromosome counts of one would result in an over-estimation of the percentage deviating from the modal centromere number (unpublished data). The survival analysis for the centromeric FISH data was performed with time to breast cancer specific death as outcome variable. A robust Cox Proportional-Hazards (R package coxrobust) regression model with a quadratic weighting function was used to perform a multivariate Cox Regression for all ER-negative patients. Cox Proportional-Hazards regression models were performed for the univariate survival analysis of MCD4 and follow-up times were censored at 100 months. P values for univariate analysis were estimated by a logrank statistic. All statistics were performed in R version 2.11.1. All P values are two-sided. All statistical calculations and R scripts can be found in the supplementary Sweave document.
Results
Distribution of Modal Centromeric Deviation in Primary Breast Cancer
In order to address the frequency of directly quantified tumour chromosomal instability in ER-negative compared to ER-positive breast cancer and identify the relationship of CIN with clinical outcome in ER-negative breast cancer, we assessed tumour CIN by centromeric FISH analysis in a tissue microarray cohort of 246 primary breast cancers diagnosed at Leeds Teaching Hospitals NHS trust between 1983-1997 (Table 1 and Figure 1A). Primary breast cancers from this cohort reflected the diversity of histological tumour grade, tumour size, nodal involvement and ER and HER2 receptor status encountered in common clinical practice. Patients received conventional (neo)-adjuvant chemotherapy at the time, consisting of predominantly CMF (cyclophosphamide, methotrexate and 5 fluorouracil) or FEC (5-fluorouracil, epirubicin and cyclophosphamide). No patients received either taxane-based chemotherapy or if HER2-positive, Trastuzumab, as this cohort preceded the dates of introduction of these agents. Radiotherapy was given following breast conserving surgery. All ER-positive patients received 5 years of tamoxifen.
Figure 1. Distribution of average Modal Centromeric Deviation across the Leeds primary breast cancer cohort.

Figure 1A: Flowchart of experimental procedures and breast cancer cohort CIN analysis. Figure 1B: Histogram distribution of the percentage of nuclei with deviation from the modal centromere signals and allocation of MCD cohorts 1-4. The y-axis shows the frequency of the MCD score. The MCD scores were grouped into four cohorts with similar range. Figure 1C: Heatmap of centromeric distribution for chromosome 2 and 15. Each column represents one tumour ranked according to MCD scores, with corresponding ER status: ER-negative (red), ER-positive (black) and HER2 status: HER2 negative (red), HER2 positive (black). The rows of the heatmap indicate the centromere number of each chromosome per nucleus and colours the percentage of nuclei having the particular centromere number (blue = 0%, red = 100%). For diagrammatic purposes the figure only portrays centromere counts between one and five.
Studies have previously demonstrated that the use of FISH probes for two chromosomes is sufficient to segregate diploid from aneuploid tumours (40, 41). This technique also enables an estimation of clonal heterogeneity within the tumour and allows the differentiation between CIN (aneuploid tumours with high clonal heterogeneity) and stable aneuploidy (low clonal heterogeneity) (18, 42). Therefore, we used centromeric FISH analysis of chromosomes 2 and 15, to assess the mean percentage of nuclei within each tumour deviating from the modal centromere number, using established methods (18, 40).
The percentage of nuclei with centromeric signals deviating from the centromere mode was assessed for each of the 246 tumours in order to establish the range of tumour numerical CIN across the cohort. We calculated the percentage of nuclei deviating from the modal centromeric signal for chromosome 2 and 15 separately. A summary measure, the average Modal Centromere Deviation (MCD), was assessed by calculating the mean percentage of nuclei that deviated from the mode for both centromeric probes within each tumour (Figure 1A). We separated tumours into four groups of increasing numerical CIN based on increasing MCD, (Modal Centromere Deviation groups 1-4, MCD1 0.0-15%, MCD2 15%-30%, MCD3 30-45% and MCD4 >45%, Figure 1A and 1B) and displayed tumours according to the distribution of centromeric signals, HER2 and ER status (Figure 1C and Supplementary Figure 1). The MCD4 cohort was classified as a MCD score greater than 45%, concordant with the “unstable aneuploidy” definition previously defined by Lingle and colleagues in an analysis of 20 breast tumours (18).
Relationship between Tumour Modal Centromeric Deviation and Clonal Heterogeneity
Deviation from the modal centromere number provides an estimate of tumour CIN (18). However, this measure may similarly classify unstable aneuploid tumours with high clone heterogeneity (eg 60% of nuclei with two centromeres and 25% with three, 5% with four and 10% with five centromeric signals) together with stable aneuploid tumours with relatively few clones making up a large proportion of the tumour (e.g. 60% nuclei with two centromeres and 40% nuclei with three centromeres). In order to more directly assess clone heterogeneity within each tumour and assess whether the MCD4 cohort represents the tumours with the most extreme CIN, we calculated the Shannon Diversity Index that integrates both the number and abundance of tumour clones within each tumour across the cohort according to published methods (20). Consistent with a close relationship of MCD with clonal heterogeneity in breast cancer, there was a highly significant correlation between Modal Centromere Deviation and the Shannon Diversity Index for chromosome 2 (Figure 2A, Pearson’s correlation coefficient=0.941, p < 0.0001) and chromosome 15 (Figure 2B, Pearson’s correlation coefficient=0.902, p < 0.0001). These data suggest that tumours in the MCD4 cohort have the highest Shannon Diversity Index and thus the greatest clonal heterogeneity (Figure 2C, t-test, p < 0.0001), indicating that these tumours have the most extreme chromosomal numerical heterogeneity (Supplementary Figures 2A and 2B) and, within the experimental limitations of our analysis of paraffin-embedded tumour microarrays, can be designated CIN-extreme (MCD4 representative images Figure 2D). In order to assess the concordance of CIN status defined by MCD cohort with FACS-based measures of DNA index, through a parallel analysis of 29 tumours for which FISH data and DNA index data derived from FACS analysis was present, we confirmed a significant enrichment of MCD3 and MCD4 cohorts within the aneuploid tumours classified by FACS (p=0.014, Fisher test data not shown).
Figure 2. Relationship of CIN scores to Shannon Diversity Index.

Correlation of modal centromere deviation with Shannon Diversity Index for chromosome 2 (Figure 2A) and chromosome 15 (Figure 2B). The MCD4 extreme CIN cohort has the highest mean (Chromosome 15 and 2) Shannon Diversity Index (Figure 2C) Representative images of MCD4 cohort tumours (Figure 2D). Centromeric probes of chromosome 2 and chromosome 15 were labelled in red and green respectively.
ER-negative breast cancers display significantly greater numerical CIN
Previous evidence from a DNA image cytometry analysis of 48 breast cancers demonstrated that higher risk ER-negative breast cancer subtypes were more frequently chromosomally unstable than lower risk ER-positive breast cancers (17). Consistent with these data, we noted significant differences in the proportion of ER negative compared to ER positive subtypes between the four MCD groups (p=0.02, Cochran-Armitage trend test), with over-representation of ER-negative compared to ER-positive tumours within the MCD3 and the CIN-extreme MCD4 cohorts (Figure 3A and Table 1). After correcting for multiple testing across all histopathological subtypes, we noted a significant difference in the proportion of grade 3 tumours between the four MCD groups (p=0.007, Cochran-Armitage trend test), with over-representation of grade 3 tumours in the higher MCD cohorts 3 and 4 (Table 1). Neither node-positive (p=0.69) nor larger (p=0.64) tumours appeared to show significant differences between the MCD cohorts.
Figure 3. Relationship of histopathological parameters to MCD cohort.
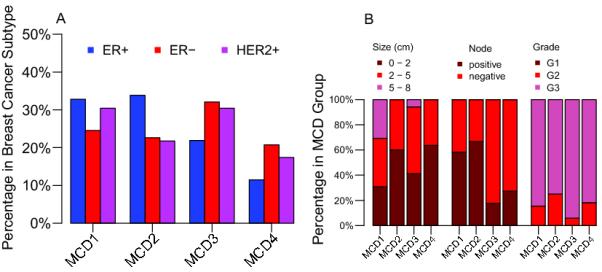
Figure 3A: Distribution of Estrogen and HER2 receptor status across each MCD cohort. The frequency of ER− (including HER2+/− tumours), ER+ (including HER2+/− tumours) and HER2+ (including ER+/− tumours) breast cancers within each MCD cohort. Figure 3B: Relationship of histopathological parameters to MCD cohort in ER-negative breast cancer.
In contrast, in ER-negative tumours, MCD cohorts 3 and 4 were significantly more likely to be node negative than tumours in MCD cohorts 1 and 2 (Figure 3B, p=0.004, Fisher’s exact test). Tumours were not significantly larger or of higher grade in MCD3 and 4 compared to MCD1 and MCD2 cohorts (Figure 3B).
Relationship of Extreme Chromosomal Instability with Breast Cancer Clinical Outcome
Pre-clinical observations demonstrating that CIN can negatively impact upon tumour biological fitness and the limited utility of prognostic expression signatures in ER-negative breast cancer, such as MammaPrint® and Oncotype DX which may also reflect tumour chromosomal instability status (17), led us to investigate whether ER-negative tumours with extreme-CIN might be associated with a better outcome relative to the rest of the cohort or tumours with intermediate levels of CIN.
Consistent with a positive prognostic relationship between CIN and breast cancer outcome, patients with ER-negative breast cancers in the CIN-extreme MCD4 cohort had a significantly better breast cancer survival than patients in the intermediate and lower MCD cohorts (Figure 4, logrank test p=0.014) and specifically in a comparison with the MCD3 intermediate cohort alone (p=0.015). In order to determine that these results do not simply reflect the diversity of treatment given to this cohort, we restricted our analysis to patients treated with adjuvant chemotherapy only. Significantly improved outcome was also seen in the CIN-extreme MCD4 cohort when the analysis was repeated in patients treated with adjuvant chemotherapy (Supplementary Figure 3, p=0.04). In a multivariate model including MCD4, tumour grade, HER2 status, chemotherapy exposure, size and nodal status, MCD4 was a significant independent positive prognostic variable in ER-negative breast cancer (Table 2, p=0.02). When repeating the multivariate analysis based on modal centromeric deviation by using the mean Shannon Diversity Index to separate the ER-negative breast cancers into four increasingly clonally heterogeneous tumour groups with equal range, consistent with the results of the MCD approach, the most extreme CIN group (SDI4) was also a significant positive predictor of outcome in multivariate analysis (p=0.005, Supplementary Table 1).
Figure 4. Association of Modal Centromeric Deviation Cohort with Breast cancer death.
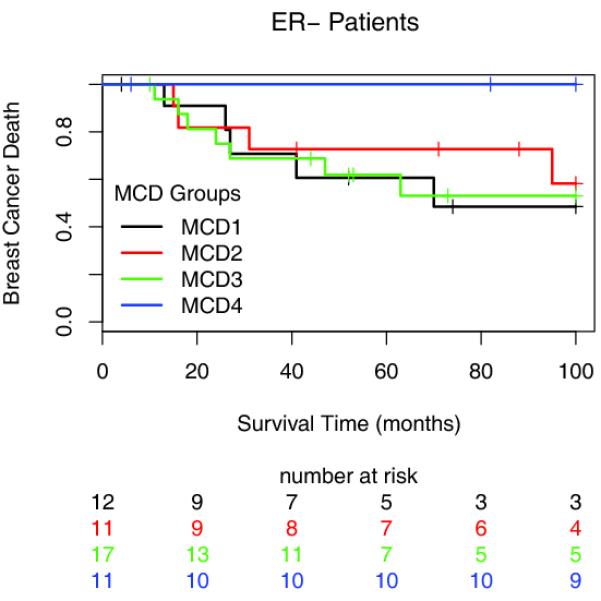
Kaplan-Meier survival curves for the four MCD cohorts across all ER-negative breast cancer patients. The y-axis shows breast cancer specific survival probabilities, the x-axis shows survival time in months.
Table 2. Multivariate analysis of prognostic variables in ER-negative breast cancer with CIN grouped by MCD.
Analysis results of the multivariate robust Cox Proportional- Hazard Regression for all ER-negative patients with covariates size, grade, HER2 status, chemotherapy, node status and MCD4 versus all other MCD cohorts taken together. The table shows the hazard ratio, upper and lower 95% confidence limits and P values for each covariate. The covariates are ranked by P values. Significant covariates are labelled by asterixes.
| Hazard Ratio | Lower .95 CI | Upper .95 CI | p value | |
|---|---|---|---|---|
| Size | 1.1051 | 1.0238 | 1.1193 | 0.0103* |
| Grade | 14.7902 | 1.7581 | 124.4247 | 0.0132* |
| HER2 Status | 7.1390 | 1.3560 | 37.5875 | 0.0204* |
| CIN Extreme (MCD4) | 0.0827 | 0.0097 | 0.7066 | 0.0228* |
| Chemotherapy | 1.8154 | 0.5743 | 5.7386 | 0.3099 |
| Node Status | 1.6023 | 0.4673 | 5.4942 | 0.4533 |
Concordance of CIN with Prognostic Expression Signatures in ER-Negative and ER-Positive Breast Cancer
Breast cancer gene expression signatures such as MammaPrint® prognosticate in ER-positive but not ER-negative breast cancer. We therefore hypothesised that the association between CIN and outcome in ER-positive breast cancer may approximate to a linear rather than a non-monotonic relationship as witnessed in ER-negative breast cancer. For this reason, we assessed the relationship of CIN with clinical outcome in an independent cohort of 356 ER-negative patients compared to 832 patients with ER-positive breast cancer using two further measurements of CIN, the CIN70 expression signature and an aCGH-based structural complexity score (reported by our group in (43)). In each case we compared the results to our centromeric FISH analysis using centromeres 2 and 15 in the Leeds cohort of 53 patients with ER-negative and 192 patients with ER-positive breast cancer (Figure 5).
Figure 5. Association of Chromosomal Instability with clinical outcome. CIN status is determined by quartile distribution using CIN70, aCGH structural chromosome complexity score and MCD (CEP2 and 15).

Figure 5A: Hazard ratios for ER-negative breast cancer across CIN quartiles determined by CIN70, combined structural chromosomal complexity (aCGH) score and MCD. Figure 5B: Hazard ratios for ER-negative breast cancer associated with quartiles of MammaPrint® and GGI (Genomic Grade Index) expression signatures. Figure 5C: Hazard ratios for ER-positive breast cancer with CIN scored by CIN70, combined structural instability (aCGH) and MCD 5D: Hazard ratios for ER-positive breast cancer associated with quartiles of MammaPrint® and GGI (Genomic Grade Index) expression signatures. Hazard ratios represent risk of death for centromeric analysis and risk of recurrence or development of metastasis for gene expression/CGH analyses.
Patients with ER-negative breast cancer in the CIN extreme (4th quartiles) have improved outcome across the three measures of CIN (Figure 5A). The same relationship was observed with ovarian, gastric and non-small cell lung cancer where the CIN extreme (fourth quartile determined by CIN70 expression) is associated with improved prognosis (Supplementary Figure 4). Consistent with the concordance of breast cancer prognostic signatures with breast cancer CIN status as reported by Habermann et al. (17), a similar relationship was observed in ER-negative breast cancer using MammaPrint® and the Genomic Grade Index (GGI), where 4th quartile expression was associated with relatively improved outcome compared to intermediate expression quartiles (Figure 5B).
Given the ability of prognostic signatures to both mirror tumour CIN status (17) and predict outcome in ER-positive breast cancer, we hypothesised that in contrast to ER-negative breast cancer, there would be a near linear relationship between CIN and breast cancer outcome. Accordingly, in ER-positive breast cancer, the CIN extreme 4th quartile was associated with the worst prognosis across all three measurements of CIN, including direct CIN assessment using CEP2 and CEP15 in the independent Leeds cohort of 192 patients (Figure 5C), concordant with the hazard ratio for the quartiles of MammaPrint® and GGI expression (Figure 5D).
In summary, the MCD4 cohort is associated with the most extreme clonal heterogeneity and chromosomal instability and relatively enriched with ER-negative breast cancers. Consistent with evidence suggesting there is a negative impact of aneuploidy on cell biological fitness, patients with ER-negative breast cancer in the CIN-extreme MCD4 cohort have a significantly improved survival outcome in multivariate analysis. In contrast, consistent with the ability of prognostic expression signature sets to reflect CIN status and define outcome in ER-positive in contrast to ER-negative breast cancer, increasing CIN status, defined by MCD, CIN70 expression or aCGH-based measurements of structural chromosome complexity, appears to be associated with increased risk of cancer death in ER-positive but not ER-negative breast cancer.
Discussion
Developments in breast cancer prognostication over the last 10 years have provided gene expression-based approaches to assess risk of tumour relapse in the adjuvant setting, such as the Oncotype DX recurrence score and MammaPrint®, that are applicable to patients with ER-positive breast cancer (44). In part, these signatures provide information regarding tumour proliferative capacity and identify high-risk ER-positive, highly proliferative luminal B tumours (16). Recently, Habermann and colleagues demonstrated that both MammaPrint® and Oncotype DX signatures closely reflect tumour CIN status as quantified by DNA image cytometry in breast cancer (17).
Heterogeneity in terms of clinical outcome is well recognised for ER-negative breast cancer (45). Furthermore, predicting relapse in patients with ER-negative disease, using prognostic gene expression approaches that effectively predict outcome in ER-positive breast cancer, has proven challenging, with the overwhelming majority of ER-negative and node negative tumours classified as high risk using MammaPrint® (46, 47). Therefore, identification of independent and distinct biological processes influencing breast cancer clinical outcome, particularly in ER-negative disease, remains an important research area to help refine prognostic signatures and provide new methods to stratify good from poor prognosis disease (48).
There is a seemingly paradoxical relationship between tumour karyotypic instability and tumour biological behaviour. Aneuploidy and CIN can both enhance and negatively impact upon cell biological fitness (8, 9, 12-14). Furthermore, proliferation-associated prognostic signature sets, that may also mirror chromosomal instability status, fail to predict outcome in ER-negative breast cancer. These observations prompted us to formally address the relationship of directly quantified tumour CIN with clinical outcome in patients with primary ER-negative compared to ER-positive breast cancer.
Using two centromeric FISH probes and estimating the deviation from the modal chromosome signals in nuclei from 246 breast cancers, we find that tumours with the greatest deviation from the modal chromosomal signal are enriched for Grade 3 and ER-negative breast cancers. These data are consistent with previous observations of tumour CIN measured using DNA image cytometry in a cohort of 48 breast cancers (17). The association of higher MCD cohort with grade 3 tumours is not surprising given the Bloom-Richardson scoring for tumour grade in breast cancer, where nuclear pleomorphism forms one of the three components of the scoring system.
The relationship of increasing tumour CIN status, across four MCD cohorts, with clinical outcome in ER-negative compared to ER-positive breast cancer was addressed. The selection of the MCD cohorts was based on an unbiased stratification of increasing chromosomal numerical heterogeneity into four groups of similar range with the most extreme CIN MCD4 cohort (>45%) corresponding to the “Unstable Aneuploid” category defined by Lingle and colleagues (18). Consistent with pre-clinical evidence suggesting that CIN may have a negative impact on organism fitness, we have observed that ER-negative tumours in the CIN-extreme MCD4 cohort are associated with the best prognosis and that MCD4 may serve as an independent favourable prognostic variable in ER-negative breast cancer in multivariate analysis. Notably, although node negative status was associated with higher MCD cohorts 3 and 4, in a multivariate model, MCD4 remained a significant predictor of favourable outcome in ER-negative breast cancer.
These data are concordant with a parallel analysis by our group using the CIN70 expression signature as a surrogate of genome instability (Figure 5) (43). We have demonstrated that extreme CIN70 expression, which correlates with structural chromosome complexity and numerical chromosome instability, is associated with improved prognosis in multivariate analysis of retrospective independent cohorts of patients with ER negative breast cancer (Figure 5A). Importantly, the same phenomenon is observed in gastric, squamous non-small cell lung cancer and ovarian cancer ((43) and Supplementary Figure 4), indicating that the association of extreme CIN with improved prognosis may be more widely apparent across solid tumours. In contrast, in ER-positive breast cancer, the risk of death increases with increasing CIN status determined by CIN70 expression, aCGH based structural chromosomal complexity and numerical CIN determined by CEP2 and CEP15 (Figure 5C). These data are consistent with the hypothesis that breast cancer prognostic expression signature sets, which may reflect tumour CIN status, have utility in ER-positive but not ER-negative disease due to an approximately linear relationship between CIN status and risk of death in ER-positive but not ER-negative breast cancer (Figure 5B and 5D). The mechanistic basis for this differential relationship of CIN with clinical outcome in ER-positive breast cancer compared to ER-negative breast cancer, NSCLC, gastric and ovarian cancer is intriguing and requires further investigation.
Although directly quantified numerical CIN has been well described in breast cancer, to our knowledge this is the largest study to assess numerical CIN directly using two centromeric FISH probes, for structurally stable chromosomes, across a panel of breast cancers of mixed size, grade and estrogen receptor status. The selection of structurally stable chromosomes may help to minimize errors in CIN frequency assessment due to selection of chromosomes based on copy number alterations that might confer tumour cell survival advantage. Lingle et al. studied chromosome number in 20 breast tumours and identified 9 breast cancers (45%) with approximately 45% of tumour cells deviating from the modal chromosomal signal, that were classified as unstable aneuploid (18). The “extreme CIN”, MCD4 cohort reported here (>45% of tumour cells deviating from the modal chromosomal signal) correlates closely with Lingle et al.’s “unstable aneuploid” cohort. When we use a direct statistical measure of clonal heterogeneity, the Shannon Diversity Index, we confirm that tumours in the MCD4 cohort are the most chromosomally unstable and clonally heterogeneous. On the basis of our retrospective data from a cohort of 246 primary breast cancers, 13% of all primary breast cancers, 21% of ER-negative, 18% of HER2 positive and 11% of ER-positive tumours would be represented in the CIN-extreme MCD4 cohort (Supplementary Table 2).
These data from a small retrospective clinical cohort of ER-negative breast cancer patients, with validation by surrogate measures of CIN in an independent analysis of 356 patients, must be interpreted with caution and require prospective validation in larger patient cohorts with defined tumour stage and treatment history. At this stage we have limited insight into the prognostic or predictive relevance of CIN extreme with patient outcome. Conceivably, ER-negative tumours in the extreme CIN cohort have an improved outcome due to their sensitivity to adjuvant chemotherapy regimens relative to tumours with intermediate CIN. We are testing such a hypothesis in order to distinguish the prognostic from predictive relevance of genome instability in a cohort of 3300 patients treated within the TACT adjuvant chemotherapy trial.
Supplementary Material
Acknowledgements
CS is a Medical Research Council senior clinical research fellow. This work was funded by CR-UK, MRC, Inflammatory Breast Cancer UK, NIH (grants NCI SPORE P50 CA 89393, R21LM008823-01A1) and by the Breast Cancer Research Foundation.
References
- 1.Mcclelland S, Burrell R, Swanton C. Chromosomal Instability, a composite phenotype that determines drug resistance. Cell Cycle. 2009;8 doi: 10.4161/cc.8.20.9690. [DOI] [PubMed] [Google Scholar]
- 2.Carter SL, Eklund AC, Kohane IS, Harris LN, Szallasi Z. A signature of chromosomal instability inferred from gene expression profiles predicts clinical outcome in multiple human cancers. Nat Genet. 2006;38:1043–8. doi: 10.1038/ng1861. [DOI] [PubMed] [Google Scholar]
- 3.Walther A, Houlston R, Tomlinson I. Association between chromosomal instability and prognosis in colorectal cancer: a meta-analysis. Gut. 2008;57:941–50. doi: 10.1136/gut.2007.135004. [DOI] [PubMed] [Google Scholar]
- 4.Kronenwett U, Huwendiek S, Ostring C, Portwood N, Roblick UJ, Pawitan Y, et al. Improved grading of breast adenocarcinomas based on genomic instability. Cancer Res. 2004;64:904–9. doi: 10.1158/0008-5472.can-03-2451. [DOI] [PubMed] [Google Scholar]
- 5.Gerlinger M, Swanton C. How Darwinian models inform therapeutic failure initiated by clonal heterogeneity in cancer medicine. British Journal of Cancer. 2010;103:1139–1143. doi: 10.1038/sj.bjc.6605912. [DOI] [PMC free article] [PubMed] [Google Scholar]
- 6.Cahill DP, Kinzler KW, Vogelstein B, Lengauer C. Genetic instability and darwinian selection in tumours. Trends in cell biology. 1999;9:M57–60. [PubMed] [Google Scholar]
- 7.Pavelka N, Rancati G, Li R. Dr Jekyll and Mr Hyde: role of aneuploidy in cellular adaptation and cancer. Curr Opin Cell Biol. 2010;22:1–7. doi: 10.1016/j.ceb.2010.06.003. [DOI] [PMC free article] [PubMed] [Google Scholar]
- 8.Sotillo R, Schvartzman JM, Socci ND, Benezra R. Mad2-induced chromosome instability leads to lung tumour relapse after oncogene withdrawal. Nature. 2010;464:436–40. doi: 10.1038/nature08803. [DOI] [PMC free article] [PubMed] [Google Scholar]
- 9.Pavelka N, Rancati G, Zhu J, Bradford WD, Saraf A, Florens L, et al. Aneuploidy confers quantitative proteome changes and phenotypic variation in budding yeast. Nature. 2010;468:321–5. doi: 10.1038/nature09529. [DOI] [PMC free article] [PubMed] [Google Scholar]
- 10.Torres EM, Sokolsky T, Tucker CM, Chan LY, Boselli M, Dunham MJ, et al. Effects of aneuploidy on cellular physiology and cell division in haploid yeast. Science. 2007;317:916–24. doi: 10.1126/science.1142210. [DOI] [PubMed] [Google Scholar]
- 11.Williams BR, Prabhu VR, Hunter KE, Glazier CM, Whittaker CA, Housman DE, et al. Aneuploidy affects proliferation and spontaneous immortalization in mammalian cells. Science. 2008;322:703–9. doi: 10.1126/science.1160058. [DOI] [PMC free article] [PubMed] [Google Scholar]
- 12.Kops GJ, Foltz DR, Cleveland DW. Lethality to human cancer cells through massive chromosome loss by inhibition of the mitotic checkpoint. Proc Natl Acad Sci U S A. 2004;101:8699–704. doi: 10.1073/pnas.0401142101. [DOI] [PMC free article] [PubMed] [Google Scholar]
- 13.Schmidt M, Budirahardja Y, Klompmaker R, Medema RH. Ablation of the spindle assembly checkpoint by a compound targeting Mps1. EMBO Rep. 2005;6:866–72. doi: 10.1038/sj.embor.7400483. [DOI] [PMC free article] [PubMed] [Google Scholar]
- 14.Ganem NJ, Godinho SA, Pellman D. A mechanism linking extra centrosomes to chromosomal instability. Nature. 2009 doi: 10.1038/nature08136. [DOI] [PMC free article] [PubMed] [Google Scholar]
- 15.Janssen A, Kops GJ, Medema RH. Elevating the frequency of chromosome mis-segregation as a strategy to kill tumor cells. Proc Natl Acad Sci U S A. 2009;106:19108–13. doi: 10.1073/pnas.0904343106. [DOI] [PMC free article] [PubMed] [Google Scholar]
- 16.Pusztai L. Gene expression profiling of breast cancer. Breast Cancer Res. 2009;11(Suppl 3):S11. doi: 10.1186/bcr2430. [DOI] [PMC free article] [PubMed] [Google Scholar]
- 17.Habermann JK, Doering J, Hautaniemi S, Roblick UJ, Bundgen NK, Nicorici D, et al. The gene expression signature of genomic instability in breast cancer is an independent predictor of clinical outcome. Int J Cancer. 2009;124:1552–64. doi: 10.1002/ijc.24017. [DOI] [PMC free article] [PubMed] [Google Scholar]
- 18.Lingle WL, Barrett SL, Negron VC, D’Assoro AB, Boeneman K, Liu W, et al. Centrosome amplification drives chromosomal instability in breast tumor development. Proc Natl Acad Sci U S A. 2002;99:1978–83. doi: 10.1073/pnas.032479999. [DOI] [PMC free article] [PubMed] [Google Scholar]
- 19.Farabegoli F, Santini D, Ceccarelli C, Taffurelli M, Marrano D, Baldini N. Clone heterogeneity in diploid and aneuploid breast carcinomas as detected by FISH. Cytometry. 2001;46:50–6. doi: 10.1002/1097-0320(20010215)46:1<50::aid-cyto1037>3.0.co;2-t. [DOI] [PubMed] [Google Scholar]
- 20.Maley CC, Galipeau PC, Finley JC, Wongsurawat VJ, Li X, Sanchez CA, et al. Genetic clonal diversity predicts progression to esophageal adenocarcinoma. Nat Genet. 2006;38:468–73. doi: 10.1038/ng1768. [DOI] [PubMed] [Google Scholar]
- 21.Sotiriou C, Wirapati P, Loi S, Harris A, Fox S, Smeds J, et al. Gene expression profiling in breast cancer: understanding the molecular basis of histologic grade to improve prognosis. J Natl Cancer Inst. 2006;98:262–72. doi: 10.1093/jnci/djj052. [DOI] [PubMed] [Google Scholar]
- 22.Wang Y, Klijn JG, Zhang Y, Sieuwerts AM, Look MP, Yang F, et al. Gene-expression profiles to predict distant metastasis of lymph-node-negative primary breast cancer. Lancet. 2005;365:671–9. doi: 10.1016/S0140-6736(05)17947-1. [DOI] [PubMed] [Google Scholar]
- 23.Andre F, Job B, Dessen P, Tordai A, Michiels S, Liedtke C, et al. Molecular characterization of breast cancer with high-resolution oligonucleotide comparative genomic hybridization array. Clin Cancer Res. 2009;15:441–51. doi: 10.1158/1078-0432.CCR-08-1791. [DOI] [PubMed] [Google Scholar]
- 24.Chin K, DeVries S, Fridlyand J, Spellman PT, Roydasgupta R, Kuo WL, et al. Genomic and transcriptional aberrations linked to breast cancer pathophysiologies. Cancer Cell. 2006;10:529–41. doi: 10.1016/j.ccr.2006.10.009. [DOI] [PubMed] [Google Scholar]
- 25.Desmedt C, Haibe-Kains B, Wirapati P, Buyse M, Larsimont D, Bontempi G, et al. Biological processes associated with breast cancer clinical outcome depend on the molecular subtypes. Clin Cancer Res. 2008;14:5158–65. doi: 10.1158/1078-0432.CCR-07-4756. [DOI] [PubMed] [Google Scholar]
- 26.Hess KR, Anderson K, Symmans WF, Valero V, Ibrahim N, Mejia JA, et al. Pharmacogenomic predictor of sensitivity to preoperative chemotherapy with paclitaxel and fluorouracil, doxorubicin, and cyclophosphamide in breast cancer. J Clin Oncol. 2006;24:4236–44. doi: 10.1200/JCO.2006.05.6861. [DOI] [PubMed] [Google Scholar]
- 27.Lu X, Wang ZC, Iglehart JD, Zhang X, Richardson AL. Predicting features of breast cancer with gene expression patterns. Breast Cancer Res Treat. 2008;108:191–201. doi: 10.1007/s10549-007-9596-6. [DOI] [PubMed] [Google Scholar]
- 28.Miller LD, Smeds J, George J, Vega VB, Vergara L, Ploner A, et al. An expression signature for p53 status in human breast cancer predicts mutation status, transcriptional effects, and patient survival. Proc Natl Acad Sci U S A. 2005;102:13550–5. doi: 10.1073/pnas.0506230102. [DOI] [PMC free article] [PubMed] [Google Scholar]
- 29.Minn AJ, Gupta GP, Siegel PM, Bos PD, Shu W, Giri DD, et al. Genes that mediate breast cancer metastasis to lung. Nature. 2005;436:518–24. doi: 10.1038/nature03799. [DOI] [PMC free article] [PubMed] [Google Scholar]
- 30.Pawitan Y, Bjohle J, Amler L, Borg AL, Egyhazi S, Hall P, et al. Gene expression profiling spares early breast cancer patients from adjuvant therapy: derived and validated in two population-based cohorts. Breast Cancer Res. 2005;7:R953–64. doi: 10.1186/bcr1325. [DOI] [PMC free article] [PubMed] [Google Scholar]
- 31.Silver DP, Richardson AL, Eklund AC, Wang ZC, Szallasi Z, Li Q, et al. Efficacy of neoadjuvant Cisplatin in triple-negative breast cancer. J Clin Oncol. 2010;28:1145–53. doi: 10.1200/JCO.2009.22.4725. [DOI] [PMC free article] [PubMed] [Google Scholar]
- 32.Bild AH, Yao G, Chang JT, Wang Q, Potti A, Chasse D, et al. Oncogenic pathway signatures in human cancers as a guide to targeted therapies. Nature. 2006;439:353–7. doi: 10.1038/nature04296. [DOI] [PubMed] [Google Scholar]
- 33.Dressman HK, Berchuck A, Chan G, Zhai J, Bild A, Sayer R, et al. An integrated genomic-based approach to individualized treatment of patients with advanced-stage ovarian cancer. J Clin Oncol. 2007;25:517–25. doi: 10.1200/JCO.2006.06.3743. [DOI] [PubMed] [Google Scholar]
- 34.Raponi M, Zhang Y, Yu J, Chen G, Lee G, Taylor JM, et al. Gene expression signatures for predicting prognosis of squamous cell and adenocarcinomas of the lung. Cancer Res. 2006;66:7466–72. doi: 10.1158/0008-5472.CAN-06-1191. [DOI] [PubMed] [Google Scholar]
- 35.Ooi CH, Ivanova T, Wu J, Lee M, Tan IB, Tao J, et al. Oncogenic pathway combinations predict clinical prognosis in gastric cancer. PLoS Genet. 2009;5:e1000676. doi: 10.1371/journal.pgen.1000676. [DOI] [PMC free article] [PubMed] [Google Scholar]
- 36.Gong Y, Yan K, Lin F, Anderson K, Sotiriou C, Andre F, et al. Determination of oestrogen-receptor status and ERBB2 status of breast carcinoma: a gene-expression profiling study. The lancet oncology. 2007;8:203–11. doi: 10.1016/S1470-2045(07)70042-6. [DOI] [PubMed] [Google Scholar]
- 37.Zhang Y, Martens JW, Yu JX, Jiang J, Sieuwerts AM, Smid M, et al. Copy number alterations that predict metastatic capability of human breast cancer. Cancer Res. 2009;69:3795–801. doi: 10.1158/0008-5472.CAN-08-4596. [DOI] [PubMed] [Google Scholar]
- 38.Chin SF, Teschendorff AE, Marioni JC, Wang Y, Barbosa-Morais NL, Thorne NP, et al. High-resolution aCGH and expression profiling identifies a novel genomic subtype of ER negative breast cancer. Genome Biol. 2007;8:R215. doi: 10.1186/gb-2007-8-10-r215. [DOI] [PMC free article] [PubMed] [Google Scholar]
- 39.Li C, Beroukhim R, Weir BA, Winckler W, Garraway LA, Sellers WR, et al. Major copy proportion analysis of tumor samples using SNP arrays. BMC bioinformatics. 2008;9:204. doi: 10.1186/1471-2105-9-204. [DOI] [PMC free article] [PubMed] [Google Scholar]
- 40.Fiegl M, Kaufmann H, Zojer N, Schuster R, Wiener H, Mullauer L, et al. Malignant cell detection by fluorescence in situ hybridization (FISH) in effusions from patients with carcinoma. Hum Pathol. 2000;31:448–55. doi: 10.1053/hp.2000.6550. [DOI] [PubMed] [Google Scholar]
- 41.Takami S, Kawasome C, Kinoshita M, Koyama H, Noguchi S. Chromosomal instability detected by fluorescence in situ hybridization in Japanese breast cancer patients. Clin Chim Acta. 2001;308:127–31. doi: 10.1016/s0009-8981(01)00473-9. [DOI] [PubMed] [Google Scholar]
- 42.Chin K, de Solorzano CO, Knowles D, Jones A, Chou W, Rodriguez EG, et al. In situ analyses of genome instability in breast cancer. Nat Genet. 2004;36:984–8. doi: 10.1038/ng1409. [DOI] [PubMed] [Google Scholar]
- 43.Birkbak NJ, Eklund AC, Li Q, McClelland SE, Endesfelder D, Tan P, et al. Paradoxical relationship between chromosomal instability and survival outcome in cancer. Cancer Res. 2011;71(10):3447–3452. doi: 10.1158/0008-5472.CAN-10-3667. [DOI] [PMC free article] [PubMed] [Google Scholar]
- 44.Kim C, Paik S. Gene-expression-based prognostic assays for breast cancer. Nat Rev Clin Oncol. 2010;7:340–7. doi: 10.1038/nrclinonc.2010.61. [DOI] [PubMed] [Google Scholar]
- 45.Foulkes W, Smith IE, Reis-Filho J. Triple-Negative Breast Cancer. N Engl J Med. 2010;362:1938–48. doi: 10.1056/NEJMra1001389. [DOI] [PubMed] [Google Scholar]
- 46.van de Vijver MJ, He YD, van’t Veer LJ, Dai H, Hart AA, Voskuil DW, et al. A gene-expression signature as a predictor of survival in breast cancer. N Engl J Med. 2002;347:1999–2009. doi: 10.1056/NEJMoa021967. [DOI] [PubMed] [Google Scholar]
- 47.Bueno-de-Mesquita JM, van Harten WH, Retel VP, van’t Veer LJ, van Dam FS, Karsenberg K, et al. Use of 70-gene signature to predict prognosis of patients with node-negative breast cancer: a prospective community-based feasibility study (RASTER) The lancet oncology. 2007;8:1079–87. doi: 10.1016/S1470-2045(07)70346-7. [DOI] [PubMed] [Google Scholar]
- 48.Brenton JD, Carey LA, Ahmed AA, Caldas C. Molecular classification and molecular forecasting of breast cancer: ready for clinical application? J Clin Oncol. 2005;23:7350–60. doi: 10.1200/JCO.2005.03.3845. [DOI] [PubMed] [Google Scholar]
Associated Data
This section collects any data citations, data availability statements, or supplementary materials included in this article.