

Abstract
Protein structure networks are constructed for the identification of long-range signaling pathways in cysteinyl tRNA synthetase (CysRS). Molecular dynamics simulation trajectory of CysRS-ligand complexes were used to determine conformational ensembles in order to gain insight into the allosteric signaling paths. Communication paths between the anticodon binding region and the aminoacylation region have been identified. Extensive interaction between the helix bundle domain and the anticodon binding domain, resulting in structural rigidity in the presence of tRNA, has been detected. Based on the predicted model, six residues along the communication paths have been examined by mutations (single and double) and shown to mediate a coordinated coupling between anticodon recognition and activation of amino acid at the active site. This study on CysRS clearly shows that specific key residues, which are involved in communication between distal sites in allosteric proteins but may be elusive in direct structure analysis, can be identified from dynamics of protein structure networks.
Keywords: Aminoacyl tRNA Synthetase, Computation, Molecular Dynamics, Protein-Nucleic Acid Interaction, Transfer RNA (tRNA), Aminoacylation, Cysteinyl tRNA Synthetase, Protein Structure Networks, Communication Paths, Dynamic Cross-correlation
Introduction
Aminoacyl-tRNA synthetases (aaRSs)3 are an important class of enzymes involved in the processing of genetic information. These enzymes catalyze the attachment of amino acids to the 3′ end of their cognate tRNAs with the primary responsibility of synthesizing correctly matched aminoacyl-tRNAs that are used in decoding of genetic information. High resolution crystal structural analysis of representative members of each aaRS family has separated these enzymes into two classes (I and II) with unrelated active-site motifs (1). Class I enzymes share the conserved HIGH and KMSKS motifs in a Rossmann-fold active site made up of alternating α helices and β sheets, whereas class II enzymes share three degenerate motifs in an active site made up of anti-parallel β sheets (2). Both classes of enzymes have a second and less conserved domain responsible for the selection and binding of cognate tRNA. The two-domain structure accommodates the L-shaped tRNA by docking the acceptor stem and anticodon triplet into the active site and the anticodon binding domain, respectively (3). For the great majority of aaRS enzymes, mutations that disturb recognition of the anticodon triplet cause a severe loss of the catalytic efficiency of aminoacylation at the active site even though the two sites are physically separated by ∼70 Å in space (4). This long-distance signaling suggests the existence of an allosteric mechanism of molecular communication that transmits the signal of anticodon recognition to the active site (5–8). However, the pathways within each aaRS-tRNA complex responsible for the communication are not well understood despite the available detailed structural information.
Elucidating the pathways of communication from the anticodon binding domain to the active site to achieve the specificity of aminoacylation is challenging for several reasons. First, molecular communication involves the trajectories between two points of contacts that are adjacent to each other or are separated by a distance. These trajectories are not readily deducible by crystal structures, which capture only snapshots in the dynamic process of synthetase-tRNA interaction. Second, a specific synthetase-tRNA complex proceeds through multiple stages of induced fit and mutual adaptation of both binding partners to give rise to the productive structure so that the basis for communication is not necessarily apparent from examining an existing structure. Third, discrimination among tRNAs by synthetases involves both “direct” and “indirect” readout. Direct readout refers to enzyme contacts with base-specific functional groups, whereas indirect readout refers to contacts with tRNA sugar-phosphate groups in sequence-dependent specific conformations. Operation of indirect readout mechanism is often proximal to the sites of direct mechanism, and both are further mediated by induced-fit rearrangements. Although the synergism arising from both direct and indirect mechanisms likely elevates the efficiency and specificity of communication, it also complicates the deciphering of the communication pathways.
Amalgamation of graph theoretical techniques with molecular dynamics (MD) simulation to determine cross-correlation among residues during the dynamics of tRNA-aaRS interactions can provide a powerful approach to elucidate biologically relevant pathways of allosteric communication. We have developed a robust yet simple methodology with these techniques to probe allosteric pathways of communication in several class I aaRSs. For example, we constructed unweighted graphs for methionyl and tryptophanyl tRNA synthetase on the basis of the non-covalent connectivity of side chains and residue cross-correlation information from MD simulations, which was used to determine correlated fluctuations and the extent of connectivity. Special attention was paid to the conserved residues to elucidate biological relevance. A similar approach has been developed by Luthey-Schulten and co-workers (9) by weighing the network on the basis of cross-correlation values and by including the interaction with tRNA in the construction of graphs, resulting in insights into the paths of communication in glutamyl and leucyl tRNA synthetases. Several other concepts have also been explored to elucidate communication pathways within proteins. For instance, the pathways of signal transmission have been investigated using an integration of network theory and concepts of mutual information theory (10). Other techniques to study allosteric communication involve analysis of elastic network models in combination with structural perturbation methods (10, 11) as well as exploitation of the concepts of linear response theory (12). Furthermore, Kong and Karplus (13) have proposed a methodology based on the tertiary coupling of interactions to shed light on the residues important for signaling in PDZ domain and rhodopsin, whereas other groups have investigated evolutionary data and related statistical coupling analysis to identify paths of communication (14–16). Most of these techniques, either alone or in combination, have provided valuable information on the residues that perform communication.
In this work we investigated the MD simulation trajectory involving communication between the anticodon binding region and the aminoacylation site in CysRS, the smallest monomeric enzyme of the class I family (17). Extensive biochemical studies of the model enzyme, Escherichia coli CysRS, have shown that mutations in the tRNA anticodon severely decrease the catalytic efficiency at the active site (18–20), indicating the existence of communication. A unique feature of CysRS is the strong emphasis on the use of both direct and indirect readout of tRNA to achieve the specificity of aminoacylation (21). The small size of the enzyme offers an excellent model for the exploration of how the two readout mechanisms are integrated to establish communication. We have evaluated the dynamic correlation of residues involved in the two readout mechanisms with those involved in the aminoacylation activity in the active site. From this analysis we have proposed key residues that are crucial for communication and have subsequently determined the significance of a subset of these residues by biochemical analysis. Importantly, the identified residues required for the signaling of communication from the anticodon-binding site to the active site are not proximal to each other in the available structures of CysRS, indicating that the computation analysis showing their correlation provides an important complementary approach to understand the specificity of tRNA-aaRS interaction for aminoacylation.
EXPERIMENTAL PROCEDURES
Molecular Simulations
The modeled structures of CysRS-CysAMP and CysRS-tRNACys-CysAMP complexes were equilibrated by performing a long time simulation of ∼20 ns, and the equilibrated modeled structures were obtained for both of them. Using these two equilibrated modeled and ligand-unbound crystal structures of E. coli CysRS as starting structures, three separate MD simulations were performed at 300 K by using the AMBER 9 (22) package with parm99 (23) parameters. These three structures correspond to the unbound CysRS (PDB entry 1LI5) (24) (A), the equilibrated modeled structure of CysRS-CysAMP complex (B), and the equilibrated modeled structure of CysRS-tRNACys-CysAMP complex (C). All of the simulations were carried out in water for 10 ns by using the TIP3P water model (25). The solvation box was 10 Å from the farthest atom along any axis, which resulted in 24,720, 24,709, and 28,134 water molecules, respectively, for the structures A, B, and C. The simulations were performed under NPT (isothermal-isobaric ensemble, i.e., constant temperature and constant pressure ensemble) conditions. van der Waals cut-off was set at 10 Å, whereas the pressure and temperature relaxations were set at 0.5 ps−1. The first 500 ps of simulations were considered as the equilibration phase, and the coordinate sets (snapshots) from the remaining 9.5 ns were used for analysis. A time step of 2 fs was used with the integration algorithm, and the structures were stored at every 1 ps.
Correlated Motion
The dynamical nature of protein-tRNA network is evaluated using cross-correlation maps. Correlated displacements of protein residue/atom during the simulation can be described by Amadei et al. (26),
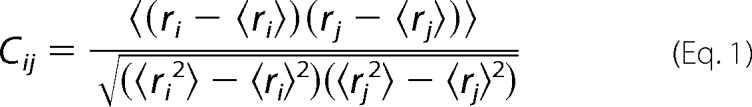 |
where i and j may correspond to any two atoms, residues, or domains. ri and rj are position vectors of i and j, and the angle brackets denote an ensemble average. Interatomic cross-correlation fluctuations between any two pairs of atoms (or residues) can be calculated using this expression and can be represented graphically by the dynamic cross-correlation map (DCCM). The value of Cij can vary from −1 (completely anti-correlated motion) to +1 (completely correlated motion).
Construction of Protein Structure Networks
Protein structure networks are constructed based on the number of non-covalent interacting atoms between two residues. The details of the construction of such a network on the basis of interaction strength (Imin) and the implications of such network have been given earlier (27, 28). The utilities of protein structure networks in the following MD trajectories have been discussed earlier (29, 30).
Shortest Correlated Path of Communication
The shortest path between selected pairs of nodes in the network is found by using Floyd-Warshall Algorithm. The method of identification of the shortest path of non-covalently connected residues between specified region of the protein structure networks from MD snapshots has been described previously (30). This involves identification of dynamically cross-correlated residues between end members from DCCM at two levels (highly correlated (Cij = 0.5–1.0) and weakly correlated (Cij = 0.3–0.5)). The distant correlated residues are connected spatially by non-covalent interactions in space by using protein structure networks. The shortest non-covalently connected path between the selected two residues was identified from the network analysis of the MD snapshots obtained from simulation trajectories.
Community Analysis
Protein structure networks contain k clique (a subgraph of k nodes, where each node is connected to each other) or community (two k cliques sharing k–1 vertices) that are densely interconnected nodes in the network. The network parameters, cliques, communities, and hubs were evaluated from all the snapshots of the MD simulations in all three structures and are based on the algorithm proposed by Palla et al. (31). They were considered dynamically stable if present in more than 50% of the simulation snapshots. These dynamically stable quantities represent the major conformational populations in the MD ensemble. The two-dimensional graphic representations of dynamically stable cliques and communities were drawn using CFinder (32), and the schematic three-dimensional representations were drawn with VMD (33).
Aminoacylation Analysis
The transcript of E. coli tRNACys was made by in vitro transcription by T7 RNA polymerase based on the template sequence constructed from overlapping oligonucleotides (20). The tRNA after denaturation by heat and annealing in the presence of 10 mm Mg+2 exhibited a plateau level of aminoacylation of ∼20%. The enzyme E. coli CysRS with a C-terminal His tag was purified from E. coli BL21 DE3 by using a Talon resin, and the concentration was corrected by active site titration. Aminoacylation of tRNACys by E. coli CysRS was performed as described previously (20). Steady state analysis was performed with 2 nm WT enzyme and up to 50 nm concentrations of mutant enzymes using tRNACys substrate in the range of 5-fold below and above the respective Km value of each enzyme. Aliquots of an aminoacylation reaction that allowed linear synthesis of Cys-tRNACys were collected by acid precipitation on filter pads, washed, dried, and analyzed by scintillation counting analysis.
RESULTS
Modeling of E. coli CysRS Structure Bound to CysAMP and tRNACys
The aminoacylation reaction catalyzed by all aaRS enzymes takes place in two steps in which the first involves the activation of the cognate amino acid with ATP to generate an enzyme-bound aminoacyl-adenylate (aaAMP), and the second involves the transfer of the aaAMP intermediate to the 2′ or 3′-OH group of the terminal ribose to form the aminoacyl tRNA. Based on the cysteine-bound E. coli CysRS crystal structure (24), we extended cysteine to CysAMP using the MetAMP-bound methionyl tRNA synthetase crystal structure as a template (34). The AMP conformation in the modeled CysAMP structure is similar to the AMP conformation of MetAMP in methionyl tRNA synthetase. The CysAMP bound-CysRS structure was obtained by aligning CysAMP and MetAMP molecules using ALIGN (35). Based on the CysAMP-docked E. coli CysRS crystal structure and the binary structure of the enzyme bound to tRNACys (21), we built a ternary complex model consisting of the enzyme, CysAMP, and tRNACys. However, the docking of CysAMP in the active site of the binary CysRS-tRNA complex resulted in steric conflict of the base A76 with AMP. As a result, we modified the acceptor stem conformation using the crystal structure of the class I ternary complex of E. coli glutaminyl RS-tRNA-ATP as a template (36). The conformation of the last four nucleotides of E. coli tRNACys, U73-C74-C75-A76, was changed to a conformation similar to the conformation of the last four nucleotides in the corresponding positions of E. coli tRNAGln using the Insight II software developed by Accelrys (San Diego, CA). The modeled structure was energy-minimized using steepest descent and conjugate gradient algorithms to obtain a model of the ternary complex of E. coli CysRS-tRNACys-CysAMP. The modeled structure was simulated for an extended time (∼20 ns) to obtain the equilibrated structure (Fig. 1).
FIGURE 1.

Interaction of CysAMP (brown balls) in the active site for the equilibrated modeled structure of E. coli CysRS-CysAMP-tRNACys, where tRNA is shown in yellow, helical regions of CysRS are shown in long tubes, and β-strands are in arrows. The Rossmann-fold domain is in green, the CP domain is in pink, the stem-contact (SC)-fold is in red, the helix bundle domain is in blue, and the anticodon binding domain is in orange.
Molecular Dynamics Analysis of the Native and the Ligand-bound CysRS Complexes
The communication paths between tRNA recognition sites and the activated amino acid binding region (active site region) in E. coli CysRS were identified by analyzing the network parameters. We compared the dynamic cross-correlation of residues between these sites using molecular dynamics of three structures: the crystal structure of ligand-free CysRS (24) (A), the equilibrated modeled structure of the CysAMP-bound CysRS (B), and the equilibrated modeled structure of the ternary complex of both CysAMP- and tRNACys-bound CysRS (C). The network analysis included both direct and indirect readout contact of tRNA recognition and direct contact with CysAMP, the latter of which serves as the end point in path calculation. The results are presented below.
Root Mean Square Deviation
Molecular dynamics simulations were carried out for 10 ns in aqueous medium on the three forms of CysRS described above. In the ligand-free enzyme, the Cα root mean square deviation values fluctuate significantly with a mean value of 3.4 ± 0.6 Å starting at around 2 ns, whereas in the enzyme complex with CysAMP and in the complex with both CysAMP and tRNACys, the Cα root mean square deviation values remained relatively stable at 2.1 ± 0.3 Å throughout the entire time course (Fig. 2). This comparison showed that the ligand-free enzyme exhibited more dynamics relative to the ligand-bound enzyme.
FIGURE 2.

Molecular dynamic simulation analysis of root mean square deviation of the three structures, the ligand-free crystal structure of E. coli CysRS, the modeled structure of CysRS-CysAMP, and the modeled structure of CysRS-tRNACys-CysAMP. r.m.s.d., root mean square deviation.
CysAMP Interaction at the Active Site
Simulation analysis of CysRS in complex with CysAMP and in complex with CysAMP and tRNACys was performed to identify the dynamically stable interactions between CysAMP and the enzyme active site (details given in supplemental Table S1). The cysteinyl moiety of the ligand binds at the base of the active site in a conformation capable of making interactions with amino acids in both halves of the Rossmann fold (Fig. 3). This conformation is similar to the conformation of amino acid ligands bound to other class I aaRS enzymes. The α-NH3+ group of CysAMP donates hydrogen bonds to both the main chain of Gly-29 and the side chain hydroxyl group of Thr-68 (Fig. 3 and supplemental Table S1). The catalytically important zinc ion is coordinated by the thiol group of the cysteine substrate as well as by the side chains of Cys-28, Cys-209, His-234 and Glu-238. The side chains of Thr-31 and His-40 form hydrogen bonds with phosphate oxygen of CysAMP. The ribose 2′-OH group of CysAMP is stabilized by hydrogen bonds provided by the backbone and the side chain of Gly-227 and Asp-229, respectively. The adenine base is stabilized by the backbone of Val-260.
FIGURE 3.
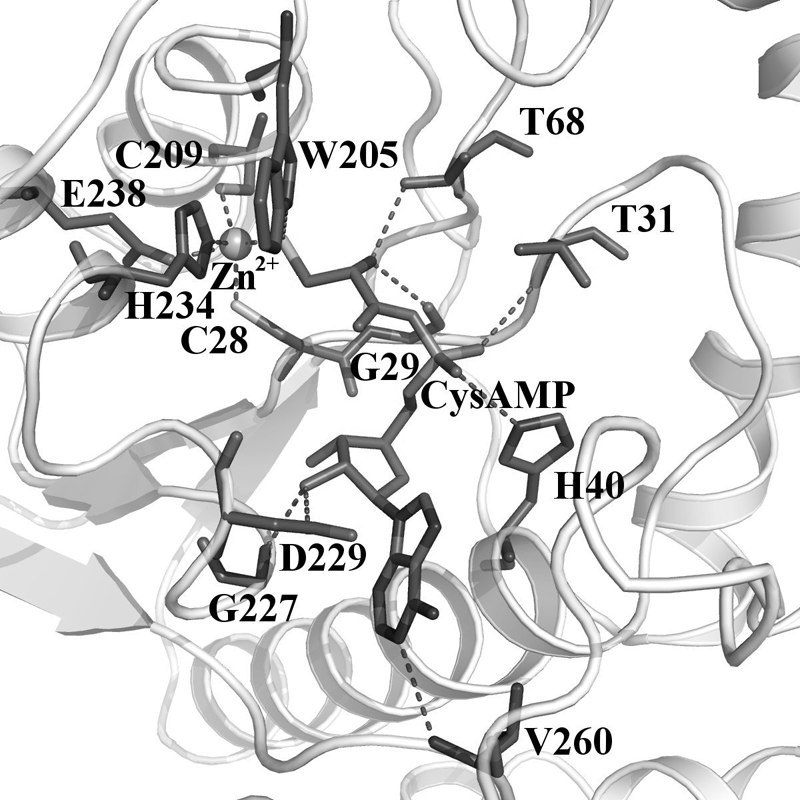
Interaction of CysAMP (represented as a thick line) in the active site of the equilibrated modeled structure of E. coli CysRS-CysAMP complex. Dynamically stable hydrogen bonds between CysRS residues and the modeled CysAMP are shown in dotted lines. The catalytically competent zinc atom is shown as a sphere. The carbon backbone is shown in grey, nitrogen atoms are in dark grey, and sulfur is in light grey.
Conformation of tRNA and Its Recognition by CysRS
Analysis of the dynamically stable interactions of CysRS in complex with CysAMP and tRNACys revealed that the anticodon loop spanning U32 to A38 makes contact only with the mixed α/β domain of CysRS (Fig. 4a). Nucleotides G34 and C35 are recognized by amino acids in a helix-loop-helix motif of the domain involving residues 423–443 of the enzyme. G34 forms three stable hydrogen bonds with Arg-423, Arg-427, and Asp-436. The other two bases of the anticodon C35 and A36 interact directly through stable hydrogen bonds with Arg-439 and Asp-451, respectively. The interactions with anticodon bases are stable and retained throughout the simulation. This analysis suggested that residues Arg-423 and Arg-427 are directly involved in tRNA recognition and are part of the network of direct readout communication path 1 (DR1).
FIGURE 4.

Interaction with tRNA in the modeled ternary structure of E. coli CysRS. a, recognition of the anticodon (G34C35A36) of E. coli tRNACys by the α/β fold domain of E. coli CysRS. is shown. b, indirect readout of the anticodon stem of tRNA is shown. Non-conserved residues Arg-318, Arg-364, and Asn-367 make hydrogen bonds with phosphate oxygen of bases U39-C40, C40, and C41, respectively. c, indirect readout of the tertiary core of tRNA is shown. Residues Asn-351 and His-297 make hydrogen bonds with the phosphate and the ribose of A14, respectively. Glu-354 makes contact with Asn-351. The interacting protein region is shown in green ribbon representation. The bases in the anticodon region and the interacting amino acids are shown in line representation. The dynamically stable hydrogen bonds are shown by dotted lines.
A helical bundle domain conserved in all subclass Ia aaRSs interacts with the anticodon stem and D stem. The anticodon stem is stabilized by a stable hydrogen-bonding interaction with phosphates at U39, C40, and C41 (Fig. 4b). In addition, the base oxygen of G24 in the D stem interacts directly with Gln-311, suggesting a second communication path for direct readout (DR2). Less conserved residues Arg-364, Arg-318, and Asn-367 of the helix bundle domain interact with the phosphate oxygen of U39-C40, C40, and C41, respectively, forming indirect readout IR1 (Fig. 4b and supplemental Table S2). In the tertiary core region, G15 is stacked on A14, allowing the 3′-phosphate of A14 to form hydrogen bond with Asn-351 in an indirect readout IR2 (Fig. 4c). Residues around the catalytic region that contact the 5′-end of the tRNA are involved in the indirect readout IR3, whereas those that contact the backbone of the terminal acceptor stem backbone are involved in the indirect readout IR4. These two indirect readout pathways may help to re-orient the tRNA CCA end away from the ATP site and to position it for catalysis.
Analysis of Dynamic Cross-correlation Maps
Allosteric signals within aaRSs arise from coupled motion between the residues in the active site domain and those in the tRNA binding domain, indicating long-range communication. The magnitude of coupled motion existing in the CysRS-tRNA crystal complex (21) was computed as correlation coefficients from the MD trajectories. The DCCM for CysRS in complex with CysAMP and tRNACys is shown in Fig. 5. The local cross-correlations are shown along the diagonal, whereas positive and negative correlation motions are shown as above and below the diagonal, respectively. A significant amount of off diagonal correlations was observed due to positive correlation of distant residues separated in space. For example, the square boxes between the markings 22 and 131 and between 208 and 254 in the x and y axes exhibit positive correlation between two halves of the Rossmann-fold domain. In addition to intra-domain residue correlation, there are many inter-domain correlated residues, such as the strong positive correlation between Phe-44 from the Rossmann-fold domain and Gln-287 from the stem contact fold domain. Notably, in the ligand-free and CysAMP-bound CysRS, the anticodon binding domain residues are found to exhibit strong anti-correlation with the residues of the Rossmann-fold domain, the stem contact-fold domain, or the helix bundle domain (supplemental Fig. S1). However, binding of tRNA on the CysRS surface has reduced the anti-correlation of the residues in the anticodon binding domain with the rest of the protein, resulting in the ordering and stabilization of the anticodon binding domain from the structure observed in the absence of the tRNA (24).
FIGURE 5.

DCCM representing the collective atom fluctuation for the modeled CysRS-tRNACys-CysAMP complex; the strong (Cij = ±(0.5–1.0)) and weak (Cij = ± (0.3–0.5)) ones are represented by black and grey, respectively. Lower and upper triangles correspond to negative and positive correlations, respectively. Boxes indicate the path from Cys-28 to His-224 to Met-225 to Tyr-298 and to Asn-351, and the path from Gly-29 to Phe-44 to Phe-402 to Arg-459 and to Arg-423/Arg-427. These paths are also listed in Table 1. The coordinates for the correlated residues shown in different boxes are marked by arrows. The numbers 1–461 correspond to CysRS residues. The residue numbers corresponding to different domains are: Rossmann-fold domain (22–131, 208–254); CP domain (132–207); stem-contact fold domain (255–325); helix bundle domain (326–400); anticodon-binding domain (401–461). The tRNA residues are indicated as residues 461–76. The positive correlation shown in rectangular boxes are used for communication pathway calculation.
The correlated motions of specific protein residues in the CysRS-tRNA complex provided the basis to propose cooperative networks among these residues by analysis of the dynamic cross-correlation map (Fig. 5). This analysis shows that the carbonyl oxygen of Gly-29 makes a hydrogen bond with the α-NH3 group of the cysteinyl group of CysAMP in a stable interaction throughout the simulation period, whereas residues Arg-423 and Arg-427 make direct contact with the anticodon bases of the tRNA, suggesting a pathway of communication from the direct readout of the anticodon bases to stabilize the aminoacyl moiety at the active site (supplemental Table S2). Hence, Gly-29 from the activation site and Arg-423 and Arg-427 from the anticodon region were selected to define the end points within which the shortest correlation paths were explored. Similarly, we used residue Asn-351 as the end point to explore the indirect readout paths. All of these paths were identified with strong correlations (Cij = 0.5–1.0) and are shown in Table 1. The correlated residues involved in each path from Arg-423/Arg-427 to Gly-29 and from Asn-351 to Gly-29 are marked with grey and light grey colored boxes (Fig. 5).
TABLE 1.
Network of correlated residues identified from DCCM for the modeled structure of CysRS-tRNACys-CysAMP complex (system C)
| Path | Strong |
|---|---|
| Gly-29 to Arg-423 | Gly-29–Phe-44–Phe-402–Arg-459–Arg-423 |
| Gly-29 to Arg-427 | Gly-29–Phe-44–Phe-402–Arg-459–Arg-427 |
| Cys-28 to Asn-351 | Cys-28–His-224–Met-225–Tyr-298–Asn-351 |
Network Parameter Analysis
Communication Paths from Analysis of Protein Structure Networks
The cross-correlated residues important for long-range communication from the anticodon binding domain to the active site were incorporated into protein structure network analysis to better define the communication paths. Such an analysis has elucidated spatially correlated residues involved in long-range communication. Based on the analysis in previous sections, we have selected residues important for interaction with CysAMP and the anticodon region as the end points for determining communication paths. We have identified the two shortest paths (supplemental Fig. S2 and drawn schematically in Fig. 6) that connect the end points with a series of residues that possess residue-residue interactions and are in strong correlations with each other (supplemental Fig. S2). The direct path 1 (DR1) forms the major path, defined as path I, which is the longest and originates from the CysAMP-interacting residue Gly-29 and terminates near anticodon binding region with residues Asp-451, Arg-423, and Arg-427. The indirect path 2 (IR2) forms the second major path, defined as path II, which connects the zinc coordination site Glu-238 with the indirect readout of A14 by Asn-351. Residues Arg-318 and Asn-367 involved in indirect readout IR1 are linked to path I through residue Tyr-320 by covalent interaction through Leu-319. Furthermore Gln-311 mediating direct readout DR2 is closely linked to Phe-401, suggesting that IR1 and DR2 are involved in amplifying the correlated motion dynamics arising from the anticodon binding domain. Residue Asn-351 mediating indirect readout IR2 is connected to path I through Tyr-356. Three sequentially close residues (His-40, Arg-42, and Phe-44), originating from a helix in the Rossmann-fold domain, are involved in connecting communication paths I and II to the active site. Residues Ser-156 and Arg-157 mediating indirect readout IR3 are linked to IR2 through Glu-236.
FIGURE 6.

Pictorial representation of the shortest paths (between CysAMP and direct readouts (DR1), indirect readouts (IR1, IR2, IR3, and IR4)). The residues participating in the communication paths and CysAMP are represented as thick lines, CysAMP is shown in magenta, and tRNA bases mediating direct/indirect readouts are shown in blue. The residues for the paths are color coded: path DR1 (path I) in red, path DR2 in pink, path IR1 in orange, path IR2 (path II) in green, path IR3 in blue, and path IR4 in yellow, whereas the connection between path I and II is shown in brown.
Cliques, Communities, Hubs, and the Communication Paths
The network parameters cliques, communities, and hubs are known to capture subtle conformational changes due to interaction of ligands with proteins, with an increase in their number correlated with local rigidity (30, 38–40). The combined analysis of communication paths and of the parameters cliques and communities in the network analysis of aaRS-tRNA complexes can enhance the understanding of how long-range signaling takes place. Here all of the stable cliques and communities were evaluated for the ligand-free, the CysAMP-bound, and the ternary model of CysRS (supplemental Table S3 and Fig. S3). The information flow from the anticodon-recognition residues to G29 in the active site in the complex of CysRS with both CysAMP and tRNA is elucidated from network analysis of cliques and communities and is shown in Fig. 7a. The anticodon binding domain is separated from the helix bundle domain through a linker peptide L1 (residues ranging from 398 to 405), which is supported by a strong community of four cliques with residues Leu-316, Tyr-320, Glu-287, Gln-396, and Phe-401 (shown in a grey square in Fig. 7a). Another linker peptide L2 (residues ranging from 285 to 296), which has a homolog in the closely related methionyl tRNA synthetase enzyme, is located near the interface region of the Rossmann-fold and the stem-contact-fold domains. Here also, we observed relatively strong community with residues Thr-288, Asp-285, Arg-313, and Phe-401 (shown in a grey parallelogram in Fig. 7a). Path DR1 passes through both communities on linker peptides L1 and L2, which are linked to each other by Phe-401 to form a single large community C1 (in grey, Fig. 7a) that connects the Rossmann-fold, stem-contact-fold, helix bundle-domain, and the anticodon binding domain in proper orientation of each. The clustering of domains into a larger community may facilitate a better coordination between the dynamic motions of individual domains during communication. Residues Gln-311 and Arg-318, connecting direct path DR2 with indirect path IR1, may help to minimize random fluctuations.
FIGURE 7.

Schematic representation of communication paths between the ligand CysAMP and the anticodon bases in CysRS as obtained for CysRS-tRNACys-CysAMP complex (a) and CysRS-tRNACys-CysAMP complex with mutated residues His-40, Arg-42, Met-294, His-297, Glu-354, and Arg-427 (b). The residues along the paths that are not part of cliques are shown in the rectangular boxes. Residues highlighted in darker grey are from alternate paths. Triangles represent cliques or communities from which one or more residues take part in communication. Path I/DR1 passes through a big community (C1, parallelogram) consisting of 7 cliques for k = 3. Path II/IR2 passes communities C4 (hexagon and pentagon) and C5 (square). The residues with an inside box are the conserved ones across various bacterial species.
Indirect readout IR2 passes through communities C4 (shown as an up pentagon and a hexagon in Fig. 7a) and C5 (shown in a grey square in Fig. 7a) with nine and two cliques, respectively. The enhanced rigidity of this path by the identified cliques may be further exacerbated by the connection of the path with IR3 through community C3 (shown as a down pentagon in Fig. 7a) of three cliques. Thus, indirect readouts IR2 and IR3 communicate with the catalytic site through rigid communities and hubs.
A significant number of residues participating in communication in CysRS are conserved (shown in Fig. 7a). Residues Ile-420, Arg-423, Arg-427, Leu-449, Glu-450, Asp-451, and Arg-459 in path I that interact directly or indirectly with the anticodon bases of tRNA are strictly conserved. Interestingly, residues mediating DR2 and IR1 are not conserved, whereas those in community C1 are somewhat conserved. Despite substantial variations of the residues in the domain interface regions of the protein during the process of evolution, 51% of the residues along communication pathways are conserved. Of interest are the conservation of the residues His-40, Arg-42, and Val-45, emanating from the helix near the class I signature motif HIGH that are involved in communication and in connecting paths I and II. The modes of communication in CysRS are significantly different from the communication paths obtained in methionyl tRNA synthetase. Apart from direct readout from anticodon bases in CysRS, substantial contribution comes from other direct and indirect readouts, which was absent in methionyl tRNA synthetase. The unusual domain architecture of CysRS suggests the possibility to provide an efficient mechanism for communication.
Mutational Analysis of Communication Paths
To evaluate the proposed communication paths, we carried out mutational analysis on some of the identified conserved residues of CysRS. Communication was tested by analysis of the additivity of the free energy change (ΔΔG) (41) of a double-substitution mutant for aminoacylation relative to those of the two-component single mutants. If the ΔΔG of the double mutant equals the sum of ΔΔG of the two single mutants, indicating additivity, this implies that the two sites are independent of each other and share no communication. In contrast, if the ΔΔG of the double mutant is smaller than the sum of the single mutants, indicating sub-additivity, this implies that the two sites share a common effect and are in communication. We focused on residues His-40 and Arg-42 as a pair that resides on a long helix that connects the active-site domain with the stem-contact domain. The two paths I and II are connected with each other by the His-40—Arg-42 of the Rossmann-fold domain as predicted by our network analysis. Second, we investigated Met-294 and His-297 as a pair, where residues Met-294 and His-297 were from paths I and II, respectively. Third, we also tested residues Met-294 and Arg-427 as a pair in path I, where Arg-427 contacts the backbone of A36 in the anticodon and is at a distal end from Met-294. Fourth, we investigated Glu-354 and Arg-427 as a pair, where communication between path I and path II is monitored by the effects of the two residues on aminoacylation. The residues in each pair were mutated to alanine, except for one.
The catalytic efficiency of aminoacylation (monitored by the parameter kcat/Km (tRNA)) of each CysRS mutant pair was examined by steady state kinetic analysis under conditions where the synthesis of cysteinyl-tRNACys was linear with time. The T7 transcript of E. coli tRNACys was prepared and annealed to serve as the substrate, which was shown to exhibit a capacity of aminoacylation at 40% in extended time courses, similar to values reported previously (20). The kcat and Km (tRNA) values of each mutant were measured from fitting the data of the initial rate of aminoacylation as a function of tRNA concentration to the Michaelis-Menten equation, from which the ratio kcat/Km was calculated. The kcat/Km value provides an assessment of specificity and is directly related to the free energy of activation in the transition state of aminoacylation. The data of free energy additivity analysis are shown in Table 2.
TABLE 2.
Summary of the E. coli CysRS mutant activity
The free energy ΔΔG was calculated according to the equation ΔΔG = −RT ln (change of kcat/Km in -fold), where R is the gas constant 1.986 cal K−1 mol−1, and T is the absolute temperature (310 K).
| Wild type | |||
|---|---|---|---|
| Km (μm) | 1.2 ± 0.01 | ||
| kcat(s−1) | 1.2 ± 0.07 | ||
| kcat/Km (μm−1s−1) | 1.1 ± 0.07 | ||
| Ratio to wild type | 1 | ||
| ΔΔG (kcal/mol) |
| H40A | R42A | H40A + R42A | |
|---|---|---|---|
| Km (μm) | 2.0 ± 0.8 | 1.8 ± 1.0 | 2.4 ± 1.4 |
| kcat (s−1) | 0.0093 ± 0.0030 | 1.1 ± 0.03 | 0.010 ± 0.005 |
| kcat/Km (μm−1s−1) | 0.0054 ± 0.0038 | 0.75 ± 0.34 | 0.0053 ± 0.0027 |
| Ratio to wild type | 1/204 | 1/1.5 | 1/209 |
| ΔΔG (kcal/mol) | 3.3 | 0.23 | 3.3 |
| M294A | R427A | M294A + R427A | |
|---|---|---|---|
| Km (μm) | 0.47 ± 0.05 | 7.5 ± 0.2 | 7.6 ± 3.6 |
| kcat (s−1) | 0.14 ± 0.00 | 0.027 ± 0.001 | 0.020 ± 0.001 |
| kcat/Km (μm−1s−1) | 0.30 ± 0.03 | 0.0038 ± 0.0003 | 0.0030 ± 0.0015 |
| Ratio to wild type | 1/3.7 | 1/291 | 1/370 |
| ΔΔG (kcal/mol) | 0.80 | 3.5 | 3.6 |
| M294A | H297A | M294A + H297A | |
|---|---|---|---|
| Km (μm) | 0.47 ± 0.05 | 0.55 ± 0.25 | 0.66 ± 0.03 |
| kcat (s−1) | 0.14 ± 0.00 | 0.16 ± 0.01 | 0.088 ± 0.027 |
| kcat/Km (μm−1s−1) | 0.30 ± 0.03 | 0.32 ± 0.16 | 0.14 ± 0.04 |
| Ratio to wild type | 1/3.7 | 1/3.4 | 1/8.1 |
| ΔΔG (kcal/mol) | 0.80 | 0.75 | 1.3 |
| E354Q | R427A | E354Q + R427A | |
|---|---|---|---|
| Km (μm) | 0.52 ± 0.03 | 7.5 ± 0.2 | 10.0 ± 0.1 |
| kcat (s−1) | 0.082 ± 0.001 | 0.027 ± 0.001 | 0.49 ± 0.09 |
| kcat/Km (μm−1s−1) | 0.16 ± 0.004 | 0.0038 ± 0.0003 | 0.050 ± 0.008 |
| Ratio to wild type | 1/6.8 | 1/291 | 1/22 |
| ΔΔG (kcal/mol) | 1.2 | 3.5 | 1.9 |
The kcat (1.2 ± 0.07 s−1), Km (tRNA, 1.2 ± 0.01 μm), and kcat/Km (1.1 ± 0.07 μm−1s−1) values of the wild-type (WT) CysRS are closely similar to values reported previously (20, 42–44). The H40A mutant had a decreased kcat (to 0.0093 ± 0.0030 s−1) and an increased Km (to 2.0 ± 0.8 μm), leading to an overall decrease in kcat/Km by 204-fold relative to the WT enzyme. In contrast, the R42A mutant had a minor effect on kcat or Km, whereas the double mutant (H40A/R42A) exhibited a defect in kcat and Km similar to that of the H40A mutant, with an overall decrease in kcat/Km by 209-fold. Free energy analysis based on the decrease in -fold of kcat/Km showed that the sum of free energy change of the H40A and R42A mutants (3.3 + 0.23 = 3.53 kcal/mol) is greater than the free energy change of the double mutant (3.3 kcal/mol), indicating sub-additivity, implying that residues His-40 and Arg-42 are in communication. Importantly, whereas His-40 is part of the HIGH motif and makes direct contact with CysAMP, Arg-42 is not. The energetic coupling between the two residues during the establishment of kcat/Km for aminoacylation specificity suggests that they jointly play a role in the specificity.
Analysis of the Met-294–Arg-427 pair showed a similar pattern. The single M294A and R427A mutations decreased the kcat/Km value by 3.7- and 291-fold, respectively, whereas the double mutations (M294A/R427A) decreased kcat/Km by 370-fold. Free energy analysis showed that the sum of the free energy change of the two single mutants (0.8 + 3.5 = 4.3 kcal/mol) is greater than the free energy change of the double mutant (3.6 kcal/mol), indicating sub-additivity and implying communication between the two residues. This result supports the notion that Arg-427, localized at the anticodon binding end of path I, is in communication with Met-294, localized near the other end of path I close to the His-40—Arg-42 motif in the active site.
Analysis of the Met-294–His-297 pair showed that both the single and double mutations were deleterious for aminoacylation, leading to reduced kcat and increased Km values. The single H297A mutation decreased the kcat/Km value by 3.4-fold, and upon combining with the M294A mutation, it conferred the double mutant (M294A/H297A) a decrease in kcat/Km by 8.1-fold. Free energy analysis showed that the sum of the free energy change of the two single mutants (0.8 + 0.75 = 1.55 kcal/mol) is greater than the free energy change of the double mutant (1.3 kcal/mol), indicating sub-additivity. Note that Met-294 is a component of path I, whereas His-297 is a component of path II. The communication between the two paths suggests the existence of a cross-talk between direct readout of anticodon and indirect readout of the tertiary core, implying that perturbation at one site may affect the operation of the other readout.
Analysis of the Glu-354-Arg-427 pair showed an interesting but re-enforcing pattern. The single E354Q mutation exhibited kcat and Km values closely similar to the previously reported values (21). However, in combination with the more severely defective R427A mutation, the E354Q mutation appeared to have helped to recover some of the lost activity by the R427A mutation in the double mutant. Specifically, the double mutant (E354Q + R427A) exhibited a loss in kcat/Km by only 22-fold from the WT enzyme compared with the 291-fold of the single R427A mutant. This suggests that the E354Q mutation rescued the defect of the R427A mutation in the double mutant. As a result, free energy analysis showed that the sum of the free energy change of the two single mutants (1.2 + 3.5 = 4.7 kcal/mol) is much greater than the free energy change of the double mutant (1.9 kcal/mol). Although the sub-additivity indicated communication between paths I and II, the rescue effect of E354Q on R427A suggests that disruption of the communication between the two paths can enable path I to achieve a higher specificity of aminoacylation. Thus, although most of the communication pathways are indeed to improve the specificity at the active site by mediating allosteric signal transmission from the anticodon binding domain to the active site, some communication may actually have a negative effect. Such a negative effect may provide a mechanism to increase flexibility in a temporal and spatial order during the mutual induced-fit process between CysRS and tRNACys.
The single and double mutations of the above six important residues along the communication paths have resulted in reduction of catalytic activity, indicating that these mutations have opened up alternative paths to permit communication from the anticodon-binding site to the active site. To identify the alternative paths created by a mutation, we systematically removed all of the interactions of the residue of interest from the rest of the network and then recalculated the shortest paths of communication. This allowed us to identify alternate paths important for communication in the presence of single and double mutations of the residue of interest. A general pattern that emerged from this analysis was an increase in number of residues that participated in the communication path and also a reduction in multiple paths (Fig. 7b). For example, the removal of residues Met-294 (from path I) and His-297 (from path II) from the network led to the addition of new sets of connecting residues Ile-105—Tyr-63—Asp-48 and Arg-65—Val-27—Phe-47—Gly-225—Phe-350, respectively. Furthermore, we noted that, although opening alternate paths can restore the communication lost upon mutations in one path, this was not the case for removal of residues Glu-354 and Arg-427 from the network. Indeed, the loss of communication between paths I and II due to the double mutations of Glu-354 and Arg-427 was not compensated by alternate connecting residues, supporting the notion that the communication mediated by these two residues was non-productive and that disconnecting the communication between the two residues was actually beneficial to the overall activity at the active site.
Thus, the mutational analysis suggests that, although the primary communication paths are derived from the major population in the MD ensemble, alternative or minor paths can open up under different condition such as upon the enzyme-tRNA complex binding to ligands or upon mutations occurring on the protein structure. These alternative or minor paths can shift the conformational population (37) to modulate the activity of aminoacylation.
DISCUSSION
Key residues involved in allosteric communication in E. coli CysRS have been identified from molecular dynamics simulations and protein structure network analysis. Two major paths of communication between the residues mediating DR1, IR2, and the activation site have been identified by combining the cross-correlation information with the protein structure network constructed on the basis of non-covalent interaction. These two paths have cross-talk with each other, both predicted by our computation analysis and verified by kinetic experiments, suggesting that the major pathways of direct and indirect readout are not independent of each other but may form a network that promotes the specificity of aminoacylation.
Non-covalently interacting residues imparting structural rigidity are present along the major paths. Identified through network parameters clique/communities, patches of structural rigidity stabilized by communities are found in the Rossmann fold, the stem-contact-fold, helix bundle, and anticodon binding regions. The anticodon binding domain and the helix bundle domain are held together in a strong community. The same community is also involved in orienting both the stem-contact-fold domain and Rossmann-fold domain for efficient communication. The increase in size of the community upon tRNA binding allows further cross-talk between the major pathways, allowing for example the path originated from DR1 to intersect with several indirect readouts, such as IR1, IR2, and IR3 along the length of CysRS. These intersections establish a wide-ranging network of interactions, where distal regions of protein-tRNA contact can inter-converge to the active site to influence the specificity of tRNA aminoacylation.
Acknowledgments
We acknowledge the Computational grants for the Indian Institute of Science from the Department of Science and Technology (DST) (support for Mathematical Biology, DSTO773), Government of India, and the computational facilities at the Supercomputer Education and Research Centre, Indian Institute of Science, Bangalore. We thank Moitrayee Bhattacharyya for readings of the manuscript.
This work was supported, in whole or in part, by National Institutes of Health Grant GM56662 (to Y.-M. H.).

The on-line version of this article (available at http://www.jbc.org) contains supplemental Tables S1–S4 and Figs. S1–S3.
- aaRS
- aminoacyl-tRNA synthetase
- MD
- molecular dynamics
- CysAMP
- cysteinyl-adenylate
- CysRS
- cysteinyl tRNA synthetase
- DCCM
- dynamic cross-correlation map
- DR
- direct readout
- IR
- indirect path.
REFERENCES
- 1. Eriani G., Delarue M., Poch O., Gangloff J., Moras D. (1990) Nature 347, 203–206 [DOI] [PubMed] [Google Scholar]
- 2. Webster T., Tsai H., Kula M., Mackie G. A., Schimmel P. (1984) Science 226, 1315–1317 [DOI] [PubMed] [Google Scholar]
- 3. Schimmel P., Giegé R., Moras D., Yokoyama S. (1993) Proc. Natl. Acad Sci. U.S.A. 90, 8763–8768 [DOI] [PMC free article] [PubMed] [Google Scholar]
- 4. Alexander R. W., Schimmel P. (1999) Biochemistry 38, 16359–16365 [DOI] [PubMed] [Google Scholar]
- 5. Del Sol A., Araúzo-Bravo M. J., Amoros D., Nussinov R. (2007) Genome Biol. 8, R92. [DOI] [PMC free article] [PubMed] [Google Scholar]
- 6. Monod J., Wyman J., Changeux J. P. (1965) J. Mol. Biol. 12, 88–118 [DOI] [PubMed] [Google Scholar]
- 7. Koshland D. E., Jr., Némethy G., Filmer D. (1966) Biochemistry 5, 365–385 [DOI] [PubMed] [Google Scholar]
- 8. Gunasekaran K., Ma B., Nussinov R. (2004) Proteins 57, 433–443 [DOI] [PubMed] [Google Scholar]
- 9. Sethi A., Eargle J., Black A. A., Luthey-Schulten Z. (2009) Proc. Natl. Acad. Sci. U.S.A. 106, 6620–6625 [DOI] [PMC free article] [PubMed] [Google Scholar]
- 10. Chennubhotla C., Bahar I. (2007) PLoS Comput. Biol. 3, 1716–1726 [DOI] [PMC free article] [PubMed] [Google Scholar]
- 11. Zheng W., Brooks B. R., Thirumalai D. (2007) Biophys. J. 93, 2289–2299 [DOI] [PMC free article] [PubMed] [Google Scholar]
- 12. Atilgan C., Atilgan A. R. (2009) PLoS Comput. Biol. 5, e1000544. [DOI] [PMC free article] [PubMed] [Google Scholar]
- 13. Kong Y., Karplus M. (2009) Proteins 74, 145–154 [DOI] [PMC free article] [PubMed] [Google Scholar]
- 14. Tang S., Liao J. C., Dunn A. R., Altman R. B., Spudich J. A., Schmidt J. P. (2007) J. Mol. Biol. 373, 1361–1373 [DOI] [PMC free article] [PubMed] [Google Scholar]
- 15. Lockless S. W., Ranganathan R. (1999) Science 286, 295–299 [DOI] [PubMed] [Google Scholar]
- 16. Kass I., Horovitz A. (2002) Proteins 48, 611–617 [DOI] [PubMed] [Google Scholar]
- 17. Hou Y. M., Shiba K., Mottes C., Schimmel P. (1991) Proc. Natl. Acad. Sci. U.S.A. 88, 976–980 [DOI] [PMC free article] [PubMed] [Google Scholar]
- 18. Komatsoulis G. A., Abelson J. (1993) Biochemistry 32, 7435–7444 [DOI] [PubMed] [Google Scholar]
- 19. Zhang C. M., Liu C., Slater S., Hou Y. M. (2008) Nat. Struct. Mol. Biol. 15, 507–514 [DOI] [PMC free article] [PubMed] [Google Scholar]
- 20. Liu C., Gamper H., Shtivelband S., Hauenstein S., Perona J. J., Hou Y. M. (2007) J. Mol. Biol. 367, 1063–1078 [DOI] [PMC free article] [PubMed] [Google Scholar]
- 21. Hauenstein S., Zhang C. M., Hou Y. M., Perona J. J. (2004) Nat. Struct. Mol. Biol. 11, 1134–1141 [DOI] [PubMed] [Google Scholar]
- 22. Case D. A., Darden T. A., Cheatham I., T. E., Simmerling C. L., Wang J., Duke R. E., Luo R., Merz K. M., Pearlman D. A., Crowley M., Walker R. C., Zhang W., Wang B., Hayik S., Roitberg A., Seabra G., Wong K. F., Paesani F., Wu X., Brozell S., Tsui V., Gohlke H., Yang L., Tan C., Mongan J., Hornak V., Cui G., Beroza P., Mathews D. H., Schafmeister C., Ross W. S., Kollman P. A. (2006) AMBER 9, University of California, San Francisco [Google Scholar]
- 23. Cheatham T. E., 3rd, Cieplak P., Kollman P. A. (1999) J. Biomol. Struct. Dyn. 16, 845–862 [DOI] [PubMed] [Google Scholar]
- 24. Newberry K. J., Hou Y. M., Perona J. J. (2002) EMBO J. 21, 2778–2787 [DOI] [PMC free article] [PubMed] [Google Scholar]
- 25. Jorgensen W. L., Chandrasekhar J., Madura J. D., Impey R. W., Klein M. L. (1983) J. Chem. Phys. 79, 926–935 [Google Scholar]
- 26. Amadei A., Linssen. A. B., Berendsen H. J. (1993) Proteins 17, 412–425 [DOI] [PubMed] [Google Scholar]
- 27. Kannan N., Vishveshwara S. (1999) J. Mol. Biol. 292, 441–464 [DOI] [PubMed] [Google Scholar]
- 28. Brinda K. V., Vishveshwara S. (2005) Biophys. J. 89, 4159–4170 [DOI] [PMC free article] [PubMed] [Google Scholar]
- 29. Ghosh A., Brinda K. V., Vishveshwara S. (2007) Biophys. J. 92, 2523–2535 [DOI] [PMC free article] [PubMed] [Google Scholar]
- 30. Ghosh A., Vishveshwara S. (2007) Proc. Natl. Acad. Sci. U.S.A. 104, 15711–15716 [DOI] [PMC free article] [PubMed] [Google Scholar]
- 31. Palla G., Derényi I., Farkas I., Vicsek T. (2005) Nature 435, 814–818 [DOI] [PubMed] [Google Scholar]
- 32. Adamcsek B., Palla G., Farkas I. J., Derényi I., Vicsek T. (2006) Bioinformatics 22, 1021–1023 [DOI] [PubMed] [Google Scholar]
- 33. Humphrey W., Dalke A., Schulten K. (1996) J. Mol. Graph. 14, 33–38 [DOI] [PubMed] [Google Scholar]
- 34. Crepin T., Schmitt E., Mechulam Y., Sampson P. B., Vaughan M. D., Honek J. F., Blanquet S. (2003) J. Mol. Biol. 332, 59–72 [DOI] [PubMed] [Google Scholar]
- 35. Cohen G. E. (1997) J. Appl. Cryst. 30, 1160–1161 [Google Scholar]
- 36. Rould M. A., Perona J. J., Steitz T. A. (1991) Nature 352, 213–218 [DOI] [PubMed] [Google Scholar]
- 37. del Sol A., Tsai C. J., Ma B., Nussinov R. (2009) Structure 17, 1042–1050 [DOI] [PMC free article] [PubMed] [Google Scholar]
- 38. Ghosh A., Vishveshwara S. (2008) Biochemistry 47, 11398–11407 [DOI] [PubMed] [Google Scholar]
- 39. Bhattacharyya M., Ghosh A., Hansia P., Vishveshwara S. (2010) Proteins 78, 506–517 [DOI] [PubMed] [Google Scholar]
- 40. Hansia P., Ghosh A., Vishveshwara S. (2009) Mol. Biosyst. 5, 1860–1872 [DOI] [PubMed] [Google Scholar]
- 41. Carter P. J., Winter G., Wilkinson A. J., Fersht A. R. (1984) Cell 38, 835–840 [DOI] [PubMed] [Google Scholar]
- 42. Christian T., Lipman R. S., Evilia C., Hou Y. M. (2000) J. Mol. Biol. 303, 503–514 [DOI] [PubMed] [Google Scholar]
- 43. Zhang C. M., Christian T., Newberry K. J., Perona J. J., Hou Y. M. (2003) J. Mol. Biol. 327, 911–917 [DOI] [PubMed] [Google Scholar]
- 44. Zhang C. M., Perona J. J., Hou Y. M. (2003) Biochemistry 42, 10931–10937 [DOI] [PubMed] [Google Scholar]