Abstract
Choosing the option with the highest expected value (EV; reward probability × reward magnitude) maximizes the intake of reward under conditions of uncertainty. However, human economic choices indicate that our value calculation has a subjective component whereby probability and reward magnitude are not linearly weighted. Using a similar economic framework, our goal was to characterize how subjective value influences the generation of simple motor actions. Specifically, we hypothesized that attributes of saccadic eye movements could provide insight into how rhesus monkeys, a well-studied animal model in cognitive neuroscience, subjectively value potential visual targets. In the first experiment, monkeys were free to choose by directing a saccade toward one of two simultaneously displayed targets, each of which had an uncertain outcome. In this task, choices were more likely to be allocated toward the higher valued target. In the second experiment, only one of the two possible targets appeared on each trial. In this task, saccadic reaction times (SRTs) decreased toward the higher valued target. Reward magnitude had a much stronger influence on both choices and SRTs than probability, whose effect was observed only when reward magnitude was similar for both targets. Across EV blocks, a strong relationship was observed between choice preferences and SRTs. However, choices tended to maximize at skewed values whereas SRTs varied more continuously. Lastly, SRTs were unchanged when all reward magnitudes were 1×, 1.5×, and 2× their normal amount, indicating that saccade preparation was influenced by the relative value of the targets rather than the absolute value of any single-target. We conclude that value is not only an important factor for deliberative decision making in primates, but also for the selection and preparation of simple motor actions, such as saccadic eye movements. More precisely, our results indicate that, under conditions of uncertainty, saccade choices and reaction times are influenced by the relative expected subjective value of potential movements.
Keywords: oculomotor-capture, motor preparation, utility, prospect theory, neuroeconomics, reaction time, reward, probability
Introduction
Choosing under conditions of uncertainty requires estimating the value of each alternative and then selecting the option whose value is highest. Choosing based on expected value (EV), the product of reward magnitude and probability, maximizes the intake of reward over time. However, subjectivity in the valuation process results in choices that deviate from the EV prediction (Dayan and Abbott, 2001; Glimcher, 2003, 2011; Rolls, 2005; Milstein and Dorris, 2007; Rolls et al., 2008). For example, behavioral economic studies in humans have shown that both reward magnitude and probability are non-linearly weighted before being combined (Gonzalez and Wu, 1999; Trepel et al., 2005; Paulus and Frank, 2006; Hsu et al., 2009).
Recently, value has also been shown to influence choice behavior and underlying neural processes in the well-studied rhesus monkey model (McCoy and Platt, 2005; Padoa-Schioppa and Assad, 2006; So and Stuphorn, 2010). The influence of value on reaction time, however, has not been fully characterized. Therefore, our goal was to examine the relationship between choice and saccadic reaction times (SRTs), another common behavioral measure of a wide variety of decision factors, under conditions of changing value. If such a relationship exists, then SRT can be used to study the moment-to-moment neural activations underlying the valuation process with invasive electrophysiological techniques particularly under conditions in which speeded responses are favored.
The behavioral economic studies that measure subjective value rely mainly on methodologies that are largely incompatible with the non-human primate model such as verbal or written communication. For example, experimenters typically present human subjects with the choice between a risky, high-reward gamble (the prospect), and a lower, but guaranteed, reward (the certain outcome). Varying the reward magnitude of the certain outcome until the subject is indifferent to the prospect and the certain outcome provides the researchers with a certainty equivalent (Tversky and Kahneman, 1992). This certainty equivalent provides an estimate of how the reward magnitude is subjectively valued under risk. Recently these techniques have been modified in monkey subjects to examine the valuation process on choice using abstract symbols to indicate reward magnitude or probability (Yang and Shadlen, 2007; Rorie et al., 2010; So and Stuphorn, 2010; Cai et al., 2011).
In an effort to yield speeded responses, we did not present value cues that had to be assessed on each trial, but allowed animals to estimate the value of targets through experience across blocks of fixed value (e.g., Dorris and Munoz, 1998; Lauwereyns et al., 2002; Takikawa et al., 2002; Ikeda and Hikosaka, 2003; Ding and Hikosaka, 2007). Specifically, monkeys made simple saccadic eye movements to visual targets whose values were manipulated through changing the probability and reward magnitude they yielded. Two behavioral measures assessed subjective value across these prospects – the proportion of choices and SRT. Allocation of choices provides us with an established measure of the monkeys’ preferences (Samuelson, 1938) and this was compared with the latency with which monkeys responded during the same prospects. Our findings suggest that, when faced with uncertainty, monkeys estimate the relative expected subjective value (RESV) of potential actions similarly when both choosing and preparing simple motor actions.
Materials and Methods
General methodology
Two male rhesus monkeys (Macaca mulatta) that weighed between 9 and 13.5 kg each performed saccadic eye movement tasks for liquid reward. All procedures were approved by the Queen’s University Animal Care Committee and complied with the guidelines of the Canadian Council on Animal Care. Animals were under the close supervision of the university veterinarian. Surgical procedures have been described previously (Munoz and Istvan, 1998).
Behavioral paradigms, visual displays, delivery of liquid reward, and storage of eye movement data were under the control of a PC running a real-time data acquisition system (Gramalkn – Ryklin Software). Red and green visual stimuli (11 cd/m2) were produced by a digital projector (Duocom InFocus SP4805, refresh rate 100 Hz) and back-projected onto a translucent screen that spanned 50° horizontal and 40° vertical of visual space. Left eye position was recorded at 500 Hz with a resolution of 0.1° using an infra-red eye tracking system (Eyelink II, SR Research). Data analysis was performed offline using MATLAB version 2007a (MathWorks Inc.,) on a Pentium 4 personal computer.
Behavioral paradigms
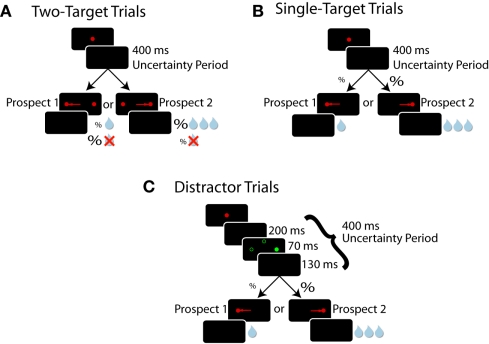
Subjects received liquid reward for successfully completing one of three simple oculomotor tasks sharing the same root structure (Figure 1). In each trial type, subjects were required to acquire, then hold their gaze on, a centrally placed fixation point for 800 ms. After this epoch, the fixation point was removed and subjects were required to maintain central fixation for an additional 400 ms before targets were presented 10° to the left and/or 10° to the right. We referred to this 400 ms epoch as the “uncertainty period” because at this point in time subjects did not know which specific trial type they were engaged in. The fixed duration of this period provided timing information which promoted the advanced preparation of upcoming saccades (Saslow, 1967; Dorris et al., 1997). Subjects had to direct a saccade toward a target and maintain fixation on it for 300 ms for the possibility of receiving a liquid reward. The inter-trial interval was fixed at 1000 ms.
Figure 1.
Experimental paradigms. Each window represents what the monkey sees chronologically ordered from top to bottom. Red filled circles represent targets, green filled circles represent distractors, and unfilled green circles represent potential distractor locations. (A) Two-target trials. Both targets are displayed but the reward outcome for choosing a target is probabilistic (%). (B) Single-target trials. Only one of the two potential targets appears, but reward is certain. Note that during a particular prospect block, the probability of target presentation at a particular location in single-target trials equals the probability of receiving a reward for choosing that target during two-target trials. (C) Distractor trials. These trials follow the same pattern as single-target trials, with the addition of an irrelevant green distractor being displayed prior to target appearance. Directing a saccade toward a distractor aborts the trial and reward is withheld.
To receive a liquid reward, subjects were required to initiate a saccade toward a displayed target within 70–1000 ms of its presentation. The value of the two possible target locations was varied across 49 blocks of trials which we will refer to as prospects. The details of how these prospects were structured are provided for single-, two-target, and oculomotor-capture trials below and in Table 1. Each prospect block consisted of 100 ± 15 trials and block transitions were not signaled.
Table 1.
Relative expected value of left target across 49 prospect blocks*.
| Magnitude of reward for the left target (mL) | Probability (%)** | Magnitude of reward for the right target (mL) | ||||||
|---|---|---|---|---|---|---|---|---|
| 10 | 25 | 40 | 50 | 60 | 75 | 90 | ||
| 0.050 | 0.02 | 0.05 | 0.10 | 0.14 | 0.20 | 0.33 | 0.60 | 0.300 |
| 0.050 | 0.04 | 0.10 | 0.18 | 0.25 | 0.33 | 0.50 | 0.75 | 0.150 |
| 0.075 | 0.06 | 0.17 | 0.29 | 0.38 | 0.47 | 0.64 | 0.84 | 0.125 |
| 0.100 | 0.10 | 0.25 | 0.40 | 0.50 | 0.60 | 0.75 | 0.90 | 0.100 |
| 0.125 | 0.16 | 0.36 | 0.53 | 0.63 | 0.71 | 0.83 | 0.94 | 0.075 |
| 0.150 | 0.25 | 0.50 | 0.67 | 0.75 | 0.82 | 0.90 | 0.96 | 0.050 |
| 0.300 | 0.40 | 0.67 | 0.80 | 0.86 | 0.90 | 0.95 | 0.98 | 0.050 |
For the oculomotor-capture task, only the shaded blocks were used. For the relative versus absolute value task, only the bold cells were used.
*The relative expected value of the right target is 1 − relative expected value of left target.
**For single-target trials, probability indicates the probability of the left target appearing. For two-target trials, probability indicates the probability of a reward being delivered when the left target is selected. For both trials, the right target probability is 1 − probability of left target.
Two-target trials
The purpose of the two-target trials (Figure 1A) was to assess which of the two valued targets the subject preferred. These trials followed the aforementioned task structure with the following exceptions. At the end of the uncertainty period, both left and right targets were displayed simultaneously and subjects were free to saccade toward either. Receipt of reward was probabilistic. We refer to this measure of probability as reward probability. Reward probability and their associated magnitudes were fixed for each target for a block of trials. The prospect for the next block was randomly selected without replacement from Table 1.
Single-target trials
Single-target trials (Figure 1B) were used to assess how saccade preparation was allocated across prospects. Compared to discrete choices during two-target trials, SRTs were a more continuous measure. These trials followed the general framework of the two-target trials, except that only one target was presented on each trial. Unlike two-target trials, reward was guaranteed if the monkey made a correct saccade to the target, but the probability of the target appearing in one of two locations varied between blocks. We refer to this measure of probability as target probability. Target probability and reward magnitude for each target were fixed for a block of trials and were randomly selected without replacement from Table 1.
Oculomotor-capture trials
Oculomotor-capture trials (Figure 1C) probed the level of saccade preparation at specific locations in the visual field. These trials were identical to single-target trials, except that an irrelevant circular green distractor, equiluminant to the red stimuli, flashed for 70 ms halfway through the uncertainty period. If subjects looked to the distractor (i.e., oculomotor-capture), the trial was immediately aborted and reward was withheld, followed by the inter-trial interval. Saccade preparation was indexed by the proportion of oculomotor captures triggered by the presentation of abrupt-onset visual distractors at particular locations.
Experiment 1: Prospect task
This experiment combined two-target (25% of trials) and single-target (75% of trials) trials together, to compare choice preferences during two-target trials with the SRTs during single-target trials for each prospect. Monkeys performed 49 different prospects, using seven different reward magnitude and seven different probability levels (Table 1). The same prospect was used for both single-target and two-target trials during a given block. Monkeys completed, on average, 12 blocks per day until satiated, and data from multiple experimental days were combined together for subsequent analysis.
Experiment 2: Oculomotor-capture task
We interleaved single-target and oculomotor-capture trials together (50% of each) to determine how monkeys allocated saccade preparation to specific locations across the visual field. A subset of 11 prospects that spanned the range of values were used in this experiment (Table 1, shaded cells). Distractors were equally likely to be presented at the location of one of the two possible targets or orthogonal to the target (10° upward). This latter distractor allowed us to assess levels of saccade preparation in non-valued areas of the visual field.
Experiment 3: Relative versus absolute value task
To examine the contribution of relative value versus absolute value to saccade preparation, monkeys performed blocks of trials with target reward magnitudes set at 1.0×, 1.5×, and 2.0× their normal magnitudes. Only three blocks of trials that spanned the range of prospects were tested (Table 1, bold cells). Our goal was to determine whether changes in absolute value contributed to SRT effects beyond those observed for relative value.
Data analysis
Trials were aborted online if eye position was not maintained within a 3° diameter circle centered on the appropriate spatial location or if saccades were initiated outside a 70- to 1000-ms temporal window following target presentation. Oculomotor captures were defined as saccades initiated toward a 6° diameter spatial window centered on the distractor within a 70- to 200-ms temporal window following distractor appearance. The spatial window was relaxed due to the tendency of oculomotor-capture saccades to be hypometric (Theeuwes et al., 1998; Milstein and Dorris, 2007). The first 20 trials from all blocks were discarded from offline analysis to allow subjects time to adjust to the new EV condition. Computer software determined the beginning and end of each saccade using velocity and acceleration criteria and accuracy was verified by the experimenter. SRT was defined as the time when eye velocity first surpassed 20°/s following target presentation.
We defined relative EV as:
| (1) |
Where p(T1) and p(T2) denote the proportion with which target 1 and target 2 appeared (single-target trials) or yielded a reward (two-target trials), respectively, during a block of trials. r(T1) and r(T2) denote the reward magnitude in milliliter of water allocated to each of the two targets, respectively.
We determined whether linear or logistic functions provided superior fits to our data using the model selection criterion derived from Akaike’s Information Criterion (Akaike, 1973; Sakamoto et al., 1986). In general, logistic fits provided superior fits for choice data and linear fits were superior for SRT data. The one-parameter logistic function we used was:
| (2) |
Where β > 0 is the shape parameter. The data was fit with least squares regression.
Results
The expected value of uncertain outcomes influences choice preferences
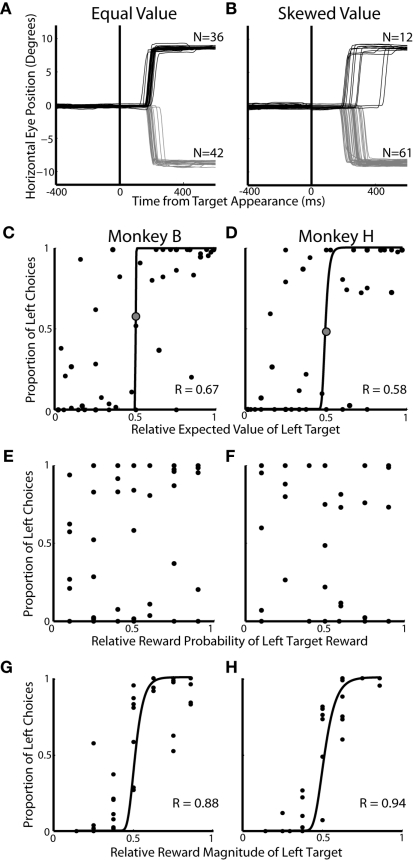
In experiment 1, we examined the allocation of choices made during two-target trials across 49 prospects (Figure 1A; Table 1). The two-target trials (25%) analyzed here were interspersed with a majority of single-target trials (75%). We hypothesized that EV will influence choice preferences in two-target trials. In a representative equal EV block (Figure 2A), approximately the same number of saccades were directed to each target. Conversely, in a block with a higher valued left target, more leftward saccades were chosen (Figure 2B). Across all 49 prospects, we found that the EV of the targets was correlated to the allocation of choices (Figure 2C; logistic fits: Monkey B; R = 0.67 and Figure 2D; Monkey H; R = 0.58, p < 0.05, respectively). Furthermore, animals tended to maximize, or choose one target exclusively, when EV was highly skewed. When we analyzed each decision factor independently, we found that probability of reward had no influence on the allocation of choices (Figures 2E,F, p > 0.05), but reward magnitude (Figure 2G; logistic fits; Monkey B; R = 0.88 and Figure 2H; Monkey H; R = 0.94, p < 0.01, respectively) had a strong influence on choice behavior. Furthermore, we found that reward magnitude exerted a significantly stronger effect on choice allocation than relative EV (p < 0.02, Fisher r-to-z transformation).
Figure 2.
Influence of decision factors on choice preference during two-target trials. All data is taken from the two-target trials of Experiment #1. (A,B) Individual eye traces for equal value (50% left probability/50% left reward magnitude) and skewed value (50% left probability/62% left reward magnitude) blocks of trials. Each line represents horizontal eye position on a single trial. (C,D) Influence of relative expected value on saccadic choices. Each dot represents 50–75 trials of a particular prospect collapsed over two to three blocks of trials. Correlation coefficients (R) are based on least square fits of a logistic function (black lines). The large gray dot indicates the equal value prospect. (E,F) Influence of relative reward probability on saccadic choices. (G,H) Influence of relative reward magnitude on saccadic choices.
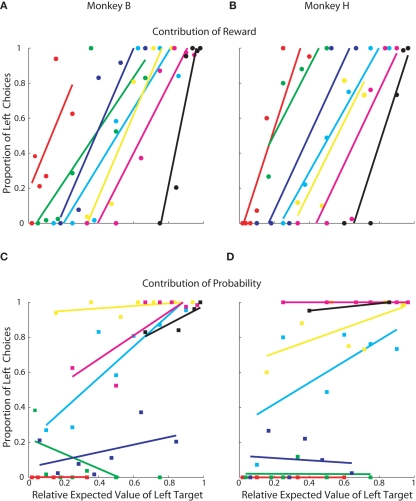
Although it is clear that, in this task, monkeys weighed reward magnitude more heavily than probability, additional analysis indicated that probability did have an effect when reward magnitudes were similar (Figure 3). We re-plotted the data from Figures 2C,D to highlight how choices were allocated within each specific probability and reward magnitude condition. Reward magnitude always had a strong effect on choice behavior, regardless of its associated outcome probability (Figures 3A,B). Probability, however, had an effect only when reward magnitudes were approximately equal (e.g., cyan lines, Figures 3C,D) and had negligible effect when reward magnitudes became skewed.
Figure 3.
Contribution of reward and probability of choice. Each point represents 50–75 trials of a specific prospect. Same data as Figures 2C,D. (A,B) Contribution of reward magnitude. Each color indicates a group of prospects with the same probability. Within each color, each point represents a different reward magnitude condition. In order, red was the lowest probability, followed by green, blue, cyan, yellow, magenta, and black was the highest. See Table 1 for exact values. (C,D) Contribution of reward probability. Each color indicates a group of prospects with the same reward magnitude and each point within the colored groups represents a different reward probability.
The expected value of uncertain movements influences saccade preparation
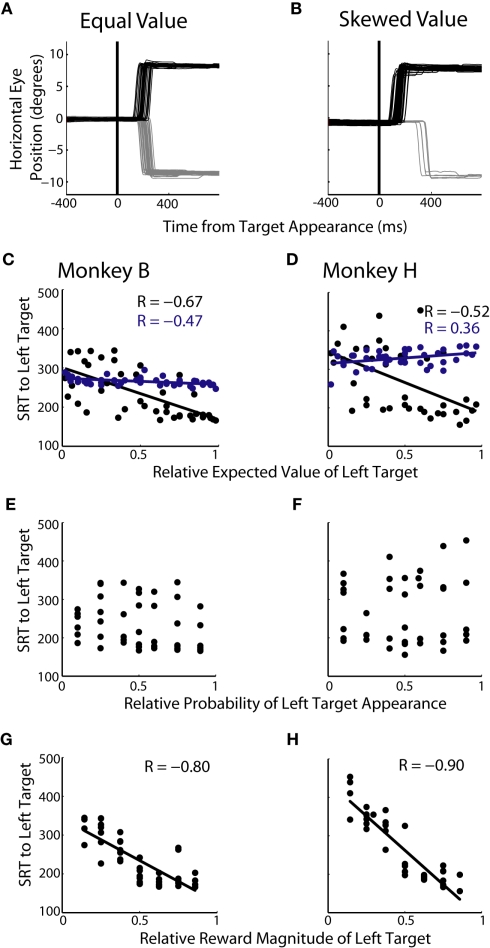
We examined changes in SRT during single-target trials of experiment 1. We hypothesized that changes in EV would lead to a bias in saccade preparation, in turn leading to skewed SRTs. Figure 4A shows a representative block with equal EVs for the two targets. Saccades were initiated with similar latencies regardless of which target was ultimately presented. Conversely, when EV was skewed in favor of the rightward target, SRTs were shorter to the right and longer to the left (Figure 4B). Across all 49 prospects, we found that SRTs were significantly correlated to relative EV (Figure 4C; R = −0.67, p < 0.05; Figure 4D; R = −0.52, p < 0.05). When we analyzed each decision factor independently we found that, similar to choice allocation, there was no correlation found between SRT and the probability of target appearance (Figures 4E,F). However, a significant correlation between SRTs and reward magnitude (Figure 4G; R = −0.80, p < 0.05; Figure 4H; R = −0.90, p < 0.05) was found. We also found that reward magnitude was significantly more correlated to SRTs than relative EV in both monkeys (p < 0.05, Fisher r-to-z transformation).
Figure 4.
Influence of decision factors on SRT during single-target trials. (A,B) Individual eye traces for equal value (50% left probability/50% left reward magnitude) and skewed value (10% left probability/38% left reward) blocks of trials. (C,D) Relationship between relative expected value of the left target and SRT for each monkey. Each black point represents 150–225 single-target trials of a specific prospect collapsed across two to three blocks of trials. Each blue point represents 50–75 two-target trials collapsed across two to three blocks of trials. (E,F) Relationship between probability and SRT for each monkey. (G,H) Relationship between reward magnitude and SRT for each monkey.
Whereas we found, using the model selection criterion derived from Akaike’s Information Criterion (Akaike, 1973; Sakamoto et al., 1986), that logistic functions provided significantly better fits than linear regressions for the effects of value on choice data (p < 0.05), the opposite was true for the effects of value on SRTs (p < 0.05). This suggests that the influence of value on choice quickly leads to maximization of binary responses whereas the effects of value on SRTs are more continuous.
Saccadic reaction times were longer on average across the 49 prospects for two-target trials compared to single-target trials (Figures 4C,D; 31 ms for monkey B, 67 ms for monkey H). This slowing is consistent with competitive inhibition resulting from the simultaneous presentation of two targets (Munoz and Istvan, 1998). Furthermore, the effects of value on SRT in two-target trials were attenuated, as shown by the shallower slopes of the linear fits when compared to single-target trial data. These correlations were also significantly worse than those found between value and SRT in single-target trials (p < 0.05, Fisher r-to-z transformation). Lastly, these effects were less consistent in two-target trials compared to single-target trials, with one monkey showing a slight positive slope and the other showing a slight negative slope between value and SRT (Figure 4C; Monkey B; R = −0.47, Figure 4D; Monkey H; R = 0.36).
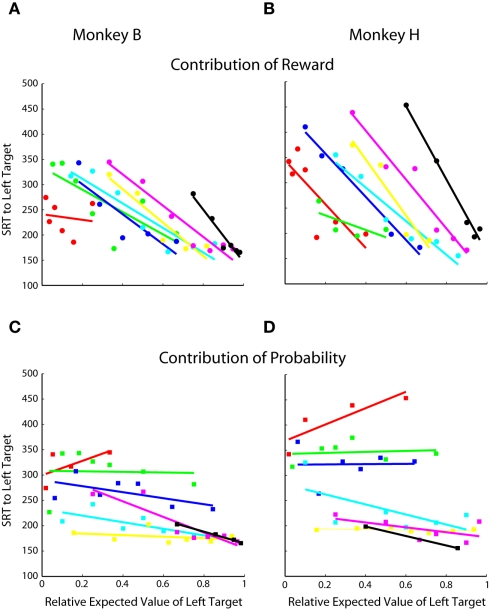
We further examined the effects of probability and reward magnitude on SRT by replotting the data from Figures 4C,D with each reward magnitude and probability condition highlighted. Similar to choice, we found that reward magnitude exhibits a strong effect on SRT, regardless of probability (Figures 5A,B). Probability exhibits little, if any, effect, except, perhaps, when reward magnitude was less biased between the two-target locations (Figure 5C; cyan lines, R = −0.76, p < 0.05; Figure 5D; cyan lines, R = −0.63, p > 0.05).
Figure 5.
Contribution of reward magnitude and probability to SRT. Each point represents 150–225 trials of a specific prospect collapsed across two to three blocks of trials. Same single-target data as Figures 4C,D. (A,B) Contribution of reward magnitude. Each color indicates a group of prospects with the same probability. Within each color, each point represents a different reward magnitude condition. In order, red was the lowest probability, followed by green, blue, cyan, yellow, magenta, and black was the highest. See Table 1 for exact values. (C,D) Contribution of reward probability. Each color indicates a group of prospects with the same reward magnitude and each point within the colored groups represents a different reward probability.
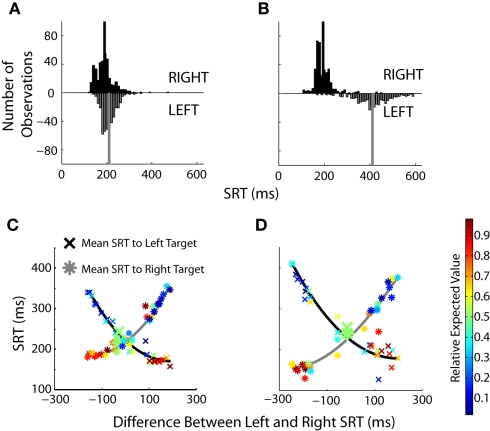
We have previously shown that mean SRTs were modulated by changes in EV in humans (Milstein and Dorris, 2007). Here we examined the relative contribution of increasing and decreasing saccade latencies across prospects by examining SRT distributions in more detail. Similar SRT distributions were observed during an equal value block (Figure 6A) with the majority of saccades centered around 200 ms. These distributions changed when the EV of the two targets was skewed (Figure 6B) with the lengthening of SRTs for the low-valued targets becoming particularly pronounced. The overall effect of value on SRTs was quite powerful when one considers that monkeys were simply required to look to a single-target that suddenly appeared in a darkened room. The SRT differences spanned 348 ms for monkey B and 460 ms in monkey H across prospects. Across all prospects (Figures 6C,D), the differences in SRT were more heavily influenced by lengthening of SRTs to the low value target. Shortening of SRTs to the high-valued target displayed a floor effect.
Figure 6.
The influence of value on SRT distributions. (A,B) Histograms for equal value (50% left probability/50% left reward magnitude) and skewed value (10% left probability/38% left reward magnitude) blocks of trials. Black bars represent SRTs to the right target, gray bars represent SRTs to the left target. The mean of each distribution is indicated by the solid vertical lines. (C,D) Same single-target data set as Figures 4C,D. Each data point represents one of the 49 different prospects, composed of 150–225 individual trials collapsed over two to three blocks of the same prospect. Blocks are not sorted on value, but on the difference in SRTs between the left and right targets. Enlarged points are blocks in which the value was equal to the left and right targets. The relative expected value of each point is indicated by the heat map legend on the right.
Influence of value on oculomotor captures
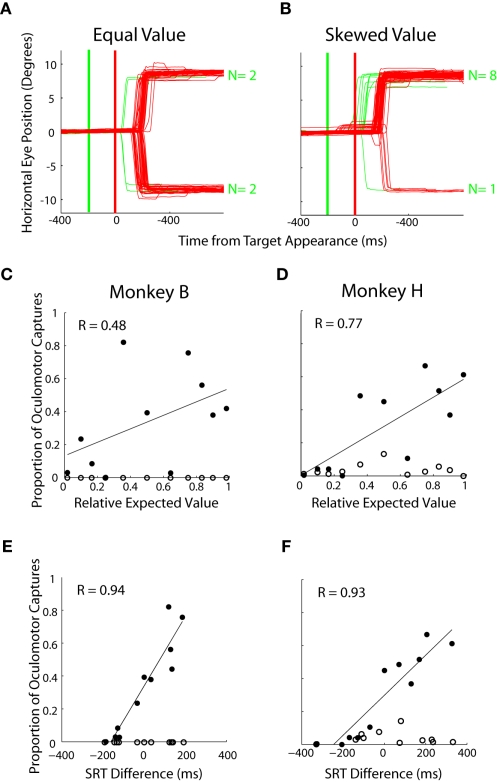
In experiment 2, we probed the spatial allocation of saccade preparation more closely by occasionally presenting a distractor at one of three locations (Figure 1C). Oculomotor captures were directed toward left and right distractors in roughly equal proportion when the targets were of equal value (Figure 7A) but became biased in favor of locations associated with targets of higher value (Figure 7B). Across prospects, there was a positive correlation between the relative EV of the targets and the proportion of oculomotor captures directed to distractors at those locations (Figure 7C – R = 0.48, p < 0.05; Figure 7D – R = 0.77, p < 0.05). Both monkeys rarely, if ever, looked toward distractors presented at the valueless upward location (Figures 7C,D, open circles). Lastly, oculomotor captures were compared with an established measure of saccade preparation, SRT (Figures 4C,D). Strong correlations were found to exist between oculomotor captures and SRT differences across the same prospects (Figure 7E: Monkey B – R = 0.94; p < 0.05; Figure 7F: Monkey H – R = 0.93, p < 0.05).
Figure 7.
Influence of expected value on oculomotor captures. (A,B) Individual eye traces for equal value (50% left probability/50% left reward magnitude) and skewed value (50% left probability/62% left reward magnitude) blocks of trials. Red lines indicate target-directed saccades, green indicate distractor-directed saccades. Thick lines indicate time of distractor (green) and target (red) appearance, respectively. (C,D) Each point is calculated from approximately 700 trials with data collapsed for left and right oculomotor captures for the same prospects. Filled circles represent oculomotor captures to distractors that appeared at potential target locations. Unfilled circles represent oculomotor captures to vertical distractors where no target was ever presented. (E,F) Relationship between relative SRT and proportion of oculomotor captures on each block. Same data as in (C,D).
Relationship between SRTs and choices across prospects
We capitalized on the interleaved two-target (Figure 1A; 25% of trials) and single-target trial (Figure 1B; 75% of trials) structure of experiment 1 to examine the relationship between SRTs and choice preference across prospects. We hypothesized that revealed choice preferences from two-target trials, an established index of relative subjective value (Gonzalez and Wu, 1999; Trepel et al., 2005; Paulus and Frank, 2006; Hsu et al., 2009; Glimcher, 2011), would correlate with SRTs from single-target trials. The differences in single-target SRTs lawfully reflected choice preferences during two-target trials (Figures 8A,B). Both of these metrics are influenced by relative EV, in that overall, there is a gradual transition from blue to red points on this graph along both the abscissa and ordinate. More likely, however, the relationship between choice and SRT is shaped by subjective value as evident by certain prospects whose ordering does not follow a smooth transition from blue to red. Putatively, the majority of this subjectivity arises because reward magnitude is over weighted relative to probability in our task (see Figures 2–5).
Figure 8.
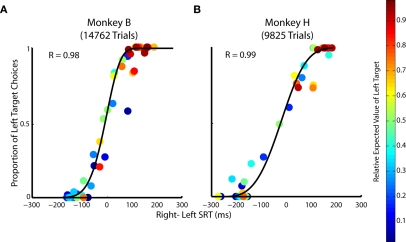
The relationship between saccadic choices and reaction times when target value is manipulated. (A,B) Relative SRT from single-target trials is plotted against the proportion of choice from two-target trials across all 49 prospects. Each point represents ∼300 trials in Monkey B and ∼200 trials in Monkey H of a specific prospect whose relative expected value is indicated by the heat map legend on the right.
The relationship between SRT difference and choice was well described by a logistic function (Figure 8A; R = 0.98 Monkey B and Figure 8B; R = 0.99 Monkey H, p < 0.05, respectively). This logistic function reflects how subjective value influences the selection and preparation of saccades. Importantly, the correlation between SRT and choice allocation across prospects is significantly stronger than the correlation observed with choice or SRT with any other decision factor (i.e., probability, reward magnitude, relative EV). This suggests that both choices and SRTs are influenced by subjective value more than any objective decision factor alone (p < 0.01, Fisher r-to-z transformation).
Saccade preparation is influenced by the relative, not absolute, value of targets
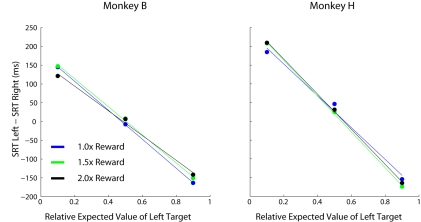
Up to this point, it is unclear whether the modulations in SRT are caused by changes in the absolute value of reward magnitude available on each trial, or by changes in the value of one target relative to the other. This confound arises because blocks with highly skewed relative values also tend to be blocks in which monkeys receives higher overall rates of reward (see Eq. 1). Here we consider absolute value to be similar to previous definitions of motivation (Stellar and Stellar, 1985) defined as the average reward harvested per trial during a given prospect. To distinguish between these two possibilities we multiplied the reward magnitudes at both target locations, which had the effect of increasing the absolute EV of each target while leaving the relative EV of each target unchanged. SRTs were influenced by changes in relative EV across blocks (p < 0.001, 1 way RM ANOVA) but not absolute changes in reward magnitude values (Figures 9; p > 0.05 for both monkeys, 1 way RM ANOVA).
Figure 9.
Comparative effects of relative and absolute expected value on SRT. Each data point represents 200–300 individual trials of a separate task comprised of 100% single-target trials. Three conditions were performed that had the same relative expected values (indicated by the bold cells in Table 1), however, all reward magnitudes were increased by the stated multiples between conditions (i.e., different absolute expected value at each location).
Discussion
Our findings suggest that the selection and preparation of saccadic eye movements are strongly influenced by the relative expected subjective value (RESV; Glimcher, 2011) of targets under conditions of uncertainty. To establish the EV component of RESV, we allowed monkeys to freely choose between prospects, in addition to recording two other behavioral measures; SRT and oculomotor captures. When monkeys were allowed to choose between prospects, they tended to choose the prospect of higher EV (Figure 2). Furthermore, the time to initiate saccades (Figure 4), as well as the spatial allocation of oculomotor captures (Figure 7), were influenced by EV. To establish the subjectivity (S) component of RESV we examined interleaved single-target and two-target trials. SRTs from single-target trials were correlated with the revealed preferences from the two-target trials (Figure 8), suggesting a relationship between subjective preferences and the allocation of saccade preparation under conditions of uncertainty. In additional support of this subjectivity, reward magnitude was more heavily weighted than probability when monkeys were choosing where to look (Figures 2 and 3) and when preparing saccades (Figures 4 and 5). To establish the relativity (R) component of RESV, reward magnitudes for all targets were increased by multiples. SRTs were influenced by changing relative value of the two targets between prospects but not changes in absolute value that accompanied multiples of reward magnitude (Figure 9).
Relative contribution of reward magnitude and probability
Previous research has shown that saccade generation is influenced by probability and reward magnitude (Basso and Wurtz, 1998; Dorris and Munoz, 1998; Leon and Shadlen, 1999; Platt and Glimcher, 1999; Lauwereyns et al., 2002; Takikawa et al., 2002; Ikeda and Hikosaka, 2003; Ding and Hikosaka, 2007; Milstein and Dorris, 2007). In those studies, one decision factor was held constant while the other was manipulated. However, the current results, and our previous work in humans (Milstein and Dorris, 2007), suggest that some weighted combination of these two factors influences saccade generation rather than either factor alone.
Reward magnitude exerted a stronger effect than reward probability in influencing choice in both monkeys (Figures 2 and 3) to the extent that probability only had a modest influence when rewards were nearly equal. Our findings are consistent with previous research in monkeys showing an effect of reward probability under equal reward magnitude conditions (Basso and Wurtz, 1998; Dorris and Munoz, 1998). Our findings provide an important extension to this previous work by demonstrating that reward magnitude dominates reward probability across a wide range of saccade target values.
This seemingly “risk seeking” behavior has been demonstrated in monkeys in other contexts (Baum, 1979; Anderson et al., 2002; Davison and Baum, 2003; Lau and Glimcher, 2005; McCoy and Platt, 2005; So and Stuphorn, 2010). Evidence from other animal models has shown that animals may behave differently based on their physiological state (Caraco, 1981). In the case of these animals, their powerful thirst may drive them to seek the risky option in the chance that it will satiate them more rapidly, rather than the more probable, but smaller reward. An additional factor is the time in between each trial. Monkeys only had to wait 1 s for the next trial to begin, and thus, may be more willing to gamble for the larger reward, knowing that they will get to have another chance right after. Previous work has shown that if monkeys are forced to wait for longer periods of time in between trials, they tend to choose the less risky option (Hayden and Platt, 2007). The immediacy of reward is clearly an important factor in the valuation of choice for monkeys (Mazur, 1987; Frederick et al., 2002; Green and Myerson, 2004; Kalenscher and Pennartz, 2008; Hwang et al., 2009; Cai et al., 2011), and the task in this study may not adequately tease apart risk from the temporal discounting of rewards. Another potential reason for a larger reward magnitude contribution is that thirsty monkeys were given reward immediately upon successful completion of a trial rather than abstract feedback to be delivered later in the experiment as is typical of human economic experiments. Potentially contributing to this, probability had to be updated slowly through experience over many trials whereas reward magnitude was sensed immediately on the tongue. However, we did not notice any appreciable changes in the influence of probability on choices throughout as trial blocks progressed (t-test comparing choice allocation at beginning and end of blocks, p > 0.10).
Establishing the expected value (EV) component of RESV
Throughout these experiments, EV was correlated to several behavioral measures. First, EV influenced the allocation of choices between targets (Figures 2C,D). This is an important first step because revealed preference is a classic behavioral measure of subjective value (Samuelson, 1938). However, simply relying on choice allocation has limitations. Choice is a discrete measure and thus better suited for assessing which option is more valuable or preferred rather than the degree to which an option is more valuable than another as reflected in the maximizing of choices at highly skewed values (Figures 2C,D). EV also influenced the continuous measure of SRTs during single-target trials (Figures 4C,D). The difference in SRTs across prospects was 348 ms in monkey B and 460 ms in monkey H, effects that greatly exceed other well-studied SRT phenomena (e.g., repetition effects = 7 ms, Dorris et al., 2000; attention = 30 ms, Fecteau et al., 2004; motivation = 3 ms, Roesch and Olson, 2004; inhibition of return = 20 ms, Dorris et al., 2002; Pro- versus anti-saccades = 41 ms, Everling and Munoz, 2000).
The influence of EV on saccade preparation resulted in an asymmetric distribution of SRTs (Figure 5). These were characterized by relatively narrow SRTs distributions toward high-valued targets and broad SRT distributions toward low-valued targets. Overall, the majority of the SRT differences were the result of lengthening to low-valued targets rather than shortening toward high-valued targets. Presumably the floor effect for speeding of SRTs is dictated by physiological limits of conduction within visuosaccadic circuits (i.e., express saccades – Munoz et al., 2000).
Although EV exerted an influence on single-target trials, this effect was both slowed and attenuated in two-target trials (Figures 4C,D, blue points). This is likely caused by competitive inhibition between the two targets, which appear in opposite hemifields of visual space (Koch and Ullman, 1985; Munoz and Istvan, 1998). Furthermore, the SRTs in two-target trials were uncorrelated to the difficulty of the selection process (i.e., how close the two prospects on a given trial were in value), which would be characterized by an inverted “U” shaped function centered on equally valued targets (p > 0.05). These results show that SRT may not be an accurate behavioral measure of value in tasks that are not speeded or allow the subjects to choose between multiple prospects.
The proportion of oculomotor captures correlated with the EV of targets at particular locations (Figure 7). Importantly, very few oculomotor captures were directed to the valueless distractors presented at a location orthogonal to the valued targets. These results mirror human work demonstrating that saccade preparation is spatially allocated based on the relative value of potential targets (Milstein and Dorris, 2007).
In summary, we established the EV of RESV in three steps. First, discreet choice preferences correlated with the relative EV of the two targets. Second, continuous SRTs were correlated with the EV of single targets. Third, the pattern of oculomotor captures demonstrated that saccade preparation is spatially allocated based on the EV of saccadic targets.
Establishing the subjective (S) component of RESV
We examined the subjective component of the value process outlined by behavioral economics (Kahneman and Tversky, 1979; Tversky and Kahneman, 1992; Gonzalez and Wu, 1999; Trepel et al., 2005; Paulus and Frank, 2006; Hsu et al., 2009) by relating SRTs to free choices during interleaved single and two-target trials. There was a lawful relationship between SRTs and preferences (Figure 8). More specifically, the logistic function that describes this relationship is important because it suggests that the process that transforms value into action follows a “soft-max” decision rule. The soft-max rule transforms the difference in value distributions between available options into a probability of choosing an action (Daw et al., 2006). This contrasts with a step-function, that characterizes an ε-greedy decision rule, in which the higher valued target is always selected or, in our case, to which all saccade preparation is allocated. Moreover, our data suggest that SRTs capture the subjectivity associated with estimating value because they more strongly reflect choice preferences (Figure 8) compared to EV, as well as account for blocks in which the monkeys chose the target of lower EV (Figures 2C,D). Interestingly, this soft-max decision rule has been seen in other studies that use choice instead of SRT as a measure of value (McCoy and Platt, 2005; So and Stuphorn, 2010). Our choice results were in between a soft-max and ε-greedy function relative to these previous studies. Perhaps this reflects a difference in using abstract symbols to represent prospects on each trial, whereas our prospects were learned by experience over a block of trials.
In other contexts, subjective value has been measured from maps of indifference curves constructed across a range of prospects (Gonzalez and Wu, 1999; Kording et al., 2004; Padoa-Schioppa and Assad, 2006; Paulus and Frank, 2006). An added benefit of SRTs is that, in addition to providing an aggregate measure of value for a given prospect, their variability may provide insight into how subjective value is dynamically updated with trial by trial experience (Thevarajah et al., 2010). Indeed our preliminary analyses suggest trial by trial SRTs in single-target trials closely track trial by trial estimates of action value derived from reinforcement learning models (Milstein et al., 2010).
Establishing the relative (R) component of RESV
Both relative and absolute value play a role in decision making theories. Economic models of choice, such as prospect theory (Kahneman and Tversky, 1979; Tversky and Kahneman, 1992; Trepel et al., 2005) posit that the value, or utility, of an action can only be determined relative to other available options. Absolute value, however, is thought to influence choice by increasing motivation; the more reward available on a given trial, the more motivated the subject is to respond (Stellar and Stellar, 1985; Roesch and Olson, 2003, 2004; Ravel and Richmond, 2006). In this context, experiment 3 examined how saccade preparation was influenced by the relative and absolute value of available options. We found that motivation, defined as the average reward harvested per trial during a given prospect (Roesch and Olson, 2004; Milstein and Dorris, 2007) had no effect on SRTs whereas RESV had a large effect across prospects (Figure 9). Although the effects of motivation have been observed in other tasks (Roesch and Olson, 2003, 2004; Ravel and Richmond, 2006), it appears to play a small role in tasks such as this, where saccade preparation can be biased across visual space based on the learned value of target locations. Perhaps motivation is more influential to whether the subject decides to complete the task or not. For example, as the animal becomes satiated, he lacks the motivation to participate in the task; however if he does participate, his saccade preparatory processes should follow RESV.
Conclusion
We conclude that RESV is not only an important factor for deliberative decision making in primates, but also for the selection and advanced preparation of simple motor actions, such as saccadic eye movements. RESV is subjective in the sense that it is computed by each subject’s internal weightings of probability and reward magnitude and relative in that behavior was influenced by the difference in value of available actions rather than the absolute value of any action alone.
Conflict of Interest Statement
The authors declare that the research was conducted in the absence of any commercial or financial relationships that could be construed as a potential conflict of interest.
Acknowledgments
This research was supported by the Canadian Institutes of Health Research. D.M. Milstein is supported by a Queen’s University graduate fellowship and an Ontario Graduate Scholarship. M.C. Dorris is supported by the Canadian Research Chairs program. We thank S. Hickman, M. Lewis for technical assistance and E. Ryklin for the customization of the data acquisition program. We thank J. Green for animal care, training, and help with the collection of behavioral data.
References
- Akaike H. (1973). “Information theory and an extension of the maximum likelihood principle,” Second International Symposium of Information Theory, eds Petrof B. N., Csazi F. (Budapest: Akademiai Kiado), 199–214 [Google Scholar]
- Anderson K. G., Velkey A. J., Woolverton W. L. (2002). The generalized matching law as a predictor of choice between cocaine and food in rhesus monkeys. Psychopharmacology (Berl.) 163, 319–326 10.1007/s00213-002-1012-7 [DOI] [PubMed] [Google Scholar]
- Basso M. A., Wurtz R. H. (1998). Modulation of neuronal activity in superior colliculus by changes in target probability. J. Neurosci. 18, 7519–7534 [DOI] [PMC free article] [PubMed] [Google Scholar]
- Baum W. M. (1979). Matching, undermatching, and overmatching in studies of choice. J. Exp. Anal. Behav. 32, 269–281 10.1901/jeab.1979.32-269 [DOI] [PMC free article] [PubMed] [Google Scholar]
- Cai X., Kim S., Lee D. (2011). Heterogeneous coding of temporally discounted values in the dorsal and ventral striatum during intertemporal choice. Neuron 69, 170–182 10.1016/j.neuron.2010.11.041 [DOI] [PMC free article] [PubMed] [Google Scholar]
- Caraco T. (1981). Energy budgets, risk and foraging preferences in dark-eyed juncos (Junco hyemalis). Behav. Ecol. Sociobiol. (Print) 8, 213–217 10.1007/BF00299833 [DOI] [Google Scholar]
- Davison M., Baum W. M. (2003). Every reinforcer counts: reinforcer magnitude and local preference. J. Exp. Anal. Behav. 80, 95–129 10.1901/jeab.2003.80-95 [DOI] [PMC free article] [PubMed] [Google Scholar]
- Daw N. D., O’Doherty J. P., Dayan P., Seymour B., Dolan R. J. (2006). Cortical substrates for exploratory decisions in humans. Nature 441, 876–879 10.1038/nature04766 [DOI] [PMC free article] [PubMed] [Google Scholar]
- Dayan P., Abbott L. (2001). Theoretical Neuroscience. Cambridge: MIT Press [Google Scholar]
- Ding L., Hikosaka O. (2007). Temporal development of asymmetric reward-induced bias in macaques. J. Neurophysiol. 97, 57–61 10.1152/jn.00902.2006 [DOI] [PubMed] [Google Scholar]
- Dorris M. C., Klein R. M., Everling S., Munoz D. P. (2002). Contribution of the primate superior colliculus to inhibition of return. J. Cogn. Neurosci. 14, 1256–1263 10.1162/089892902760807249 [DOI] [PubMed] [Google Scholar]
- Dorris M. C., Munoz D. P. (1998). Saccadic probability influences motor preparation signals and time to saccadic initiation. J. Neurosci. 18, 7015–7026 [DOI] [PMC free article] [PubMed] [Google Scholar]
- Dorris M. C., Pare M., Munoz D. P. (1997). Neuronal activity in monkey superior colliculus related to the initiation of saccadic eye movements. J. Neurosci. 17, 8566–8579 [DOI] [PMC free article] [PubMed] [Google Scholar]
- Dorris M. C., Pare M., Munoz D. P. (2000). Immediate neural plasticity shapes motor performance. J. Neurosci. 20, RC52. [DOI] [PMC free article] [PubMed] [Google Scholar]
- Everling S., Munoz D. P. (2000). Neuronal correlates for preparatory set associated with pro-saccades and anti-saccades in the primate frontal eye field. J. Neurosci. 20, 387–400 [DOI] [PMC free article] [PubMed] [Google Scholar]
- Fecteau J. H., Bell A. H., Munoz D. P. (2004). Neural correlates of the automatic and goal-driven biases in orienting spatial attention. J. Neurophysiol. 92, 1728–1737 10.1152/jn.00184.2004 [DOI] [PubMed] [Google Scholar]
- Frederick S., Loewenstein G., O’Donoghue T. (2002). Time discounting and time preference: a critical review. J. Econ. Lit. 351–401 10.1152/jn.00184.2004 [DOI] [Google Scholar]
- Glimcher P. W. (2003). The neurobiology of visual-saccadic decision making. Annu. Rev. Neurosci. 26, 133–179 10.1146/annurev.neuro.26.010302.081134 [DOI] [PubMed] [Google Scholar]
- Glimcher P. W. (2011). Foundations of Neuroeconomic Analysis. New York: Oxford University Press [Google Scholar]
- Gonzalez R., Wu G. (1999). On the shape of the probability weighting function. Cogn. Psychol. 38, 129–166 10.1006/cogp.1998.0710 [DOI] [PubMed] [Google Scholar]
- Green L., Myerson J. (2004). A discounting framework for choice with delayed and probabilistic rewards. Psychol. Bull. 130, 769–792 10.1037/0033-2909.130.5.769 [DOI] [PMC free article] [PubMed] [Google Scholar]
- Hayden B. Y., Platt M. L. (2007). Temporal discounting predicts risk sensitivity in rhesus macaques. Curr. Biol. 17, 49–53 10.1016/j.cub.2007.08.061 [DOI] [PMC free article] [PubMed] [Google Scholar]
- Hsu M., Krajbich I., Zhao C., Camerer C. F. (2009). Neural response to reward anticipation under risk is nonlinear in probabilities. J. Neurosci. 29, 2231–2237 10.1523/JNEUROSCI.5296-08.2009 [DOI] [PMC free article] [PubMed] [Google Scholar]
- Hwang J., Kim S., Lee D. (2009). Temporal discounting and inter-temporal choice in rhesus monkeys. Front. Behav. Neurosci. 3:9. 10.3389/neuro.08.009.2009 [DOI] [PMC free article] [PubMed] [Google Scholar]
- Ikeda T., Hikosaka O. (2003). Reward-dependent gain and bias of visual responses in primate superior colliculus. Neuron 39, 693–700 10.1016/S0896-6273(03)00464-1 [DOI] [PubMed] [Google Scholar]
- Kahneman D., Tversky A. (1979). Prospect theory: an analysis of decision under risk. Econometrica 47, 263–291 10.2307/1914185 [DOI] [Google Scholar]
- Kalenscher T., Pennartz C. M. (2008). Is a bird in the hand worth two in the future? The neuroeconomics of intertemporal decision-making. Prog. Neurobiol. 84, 284–315 10.1016/j.pneurobio.2007.11.004 [DOI] [PubMed] [Google Scholar]
- Koch C., Ullman S. (1985). Shifts in selective visual attention: towards the underlying neural circuitry. Hum. Neurobiol. 4, 219–227 [PubMed] [Google Scholar]
- Kording K. P., Fukunaga I., Howard I. S., Ingram J. N., Wolpert D. M. (2004). A neuroeconomics approach to inferring utility functions in sensorimotor control. PLoS Biol. 2, e330. 10.1371/journal.pbio.0020330 [DOI] [PMC free article] [PubMed] [Google Scholar]
- Lau B., Glimcher P. W. (2005). Dynamic response-by-response models of matching behavior in rhesus monkeys. J. Exp. Anal. Behav. 84, 555–579 10.1901/jeab.2005.110-04 [DOI] [PMC free article] [PubMed] [Google Scholar]
- Lauwereyns J., Watanabe K., Coe B., Hikosaka O. (2002). A neural correlate of response bias in monkey caudate nucleus. Nature 418, 413–417 10.1038/nature00892 [DOI] [PubMed] [Google Scholar]
- Leon M. I., Shadlen M. N. (1999). Effect of expected reward magnitude on the response of neurons in the dorsolateral prefrontal cortex of the macaque. Neuron 24, 415–425 10.1016/S0896-6273(00)80854-5 [DOI] [PubMed] [Google Scholar]
- Mazur J. (1987). “Quantitative analyses of behavior,” The Effect of Delay and of Intervening Events on Reinforcement Value, Vol. 5 (Hillsdale, NJ: Erlbaum; ), 55–73 [Google Scholar]
- McCoy A. N., Platt M. L. (2005). Risk-sensitive neurons in macaque posterior cingulate cortex. Nat. Neurosci. 8, 1220–1227 10.1038/nn1523 [DOI] [PubMed] [Google Scholar]
- Milstein D., Webb R., Dorris M. (2010). Reinforcement learning algorithms predict changes in activity within the superior colliculus in response to changes in saccade value. Soc. Neurosci. [Google Scholar]
- Milstein D. M., Dorris M. C. (2007). The influence of expected value on saccadic preparation. J. Neurosci. 27, 4810–4818 10.1523/JNEUROSCI.0577-07.2007 [DOI] [PMC free article] [PubMed] [Google Scholar]
- Munoz D. P., Dorris M. C., Pare M., Everling S. (2000). On your mark, get set: brainstem circuitry underlying saccadic initiation. Can. J. Physiol. Pharmacol. 78, 934–944 10.1139/y00-062 [DOI] [PubMed] [Google Scholar]
- Munoz D. P., Istvan P. J. (1998). Lateral inhibitory interactions in the intermediate layers of the monkey superior colliculus. J. Neurophysiol. 79, 1193–1209 [DOI] [PubMed] [Google Scholar]
- Padoa-Schioppa C., Assad J. A. (2006). Neurons in the orbitofrontal cortex encode economic value. Nature 441, 223–226 10.1038/nature04676 [DOI] [PMC free article] [PubMed] [Google Scholar]
- Paulus M. P., Frank L. R. (2006). Anterior cingulate activity modulates nonlinear decision weight function of uncertain prospects. Neuroimage 30, 668–677 10.1016/j.neuroimage.2005.09.061 [DOI] [PubMed] [Google Scholar]
- Platt M. L., Glimcher P. W. (1999). Neural correlates of decision variables in parietal cortex. Nature 400, 233–238 10.1038/22268 [DOI] [PubMed] [Google Scholar]
- Ravel S., Richmond B. J. (2006). Dopamine neuronal responses in monkeys performing visually cued reward schedules. Eur. J. Neurosci. 24, 277–290 10.1111/j.1460-9568.2006.04905.x [DOI] [PubMed] [Google Scholar]
- Roesch M. R., Olson C. R. (2003). Impact of expected reward on neuronal activity in prefrontal cortex, frontal and supplementary eye fields and premotor cortex. J. Neurophysiol. 90, 1766–1789 10.1152/jn.00019.2003 [DOI] [PubMed] [Google Scholar]
- Roesch M. R., Olson C. R. (2004). Neuronal activity related to reward value and motivation in primate frontal cortex. Science 304, 307–310 10.1126/science.1093223 [DOI] [PubMed] [Google Scholar]
- Rolls E. (2005). Emotion Explained. Oxford: Oxford University Press [Google Scholar]
- Rolls E. T., McCabe C., Redoute J. (2008). Expected value, reward outcome, and temporal difference error representations in a probabilistic decision task. Cereb. Cortex 18, 652–663 10.1093/cercor/bhm097 [DOI] [PubMed] [Google Scholar]
- Rorie A. E., Gao J., McClelland J. L., Newsome W. T. (2010). Integration of sensory and reward information during perceptual decision-making in lateral intraparietal cortex (LIP) of the macaque monkey. PLoS ONE 5, e9308. 10.1371/journal.pone.0009308 [DOI] [PMC free article] [PubMed] [Google Scholar]
- Sakamoto Y., Ishigura M., Kitagawa G. (1986). Akaike Information Criterion Statistics. Dordrecht: Reidel [Google Scholar]
- Samuelson P. (1938). A note on the pure theory of consumers’ behaviour. Economica 5, 61–71 10.2307/2548634 [DOI] [Google Scholar]
- Saslow M. G. (1967). Latency for saccadic eye movement. J. Opt. Soc. Am. 57, 1030–1033 10.1364/JOSA.57.001024 [DOI] [PubMed] [Google Scholar]
- So N. Y., Stuphorn V. (2010). Supplementary eye field encodes option and action value for saccades with variable reward. J. Neurophysiol. 104, 2634–2653 10.1152/jn.00430.2010 [DOI] [PMC free article] [PubMed] [Google Scholar]
- Stellar J., Stellar E. (1985). The Neurobiology of Motivation and Reward. New York: Springer-Verlag [Google Scholar]
- Takikawa Y., Kawagoe R., Itoh H., Nakahara H., Hikosaka O. (2002). Modulation of saccadic eye movements by predicted reward outcome. Exp. Brain Res. 142, 284–291 10.1007/s00221-001-0928-1 [DOI] [PubMed] [Google Scholar]
- Theeuwes J., Kramer A., Hahn S., Irwin D. (1998). Our eyes do not always go where we want them to go: capture of the eyes by new objects. Psychol. Sci. 9, 379–385 10.1111/1467-9280.00071 [DOI] [Google Scholar]
- Thevarajah D., Webb R., Ferrall C., Dorris M. C. (2010). Modeling the value of strategic actions in the superior colliculus. Front. Behav. Neurosci. 3:57. 10.3389/neuro.08.057.2009 [DOI] [PMC free article] [PubMed] [Google Scholar]
- Trepel C., Fox C. R., Poldrack R. A. (2005). Prospect theory on the brain? Toward a cognitive neuroscience of decision under risk. Brain Res. Cogn. Brain Res. 23, 34–50 10.1016/j.cogbrainres.2005.01.016 [DOI] [PubMed] [Google Scholar]
- Tversky A., Kahneman D. (1992). Advances in prospect theory: cumulative representation of uncertainty. J. Risk Uncertain. 5, 297–323 10.1007/BF00122574 [DOI] [Google Scholar]
- Yang T., Shadlen M. N. (2007). Probabilistic reasoning by neurons. Nature 447, 1075–1080 10.1038/nature05852 [DOI] [PubMed] [Google Scholar]


