

Abstract
Copper(I)-responsive fluorescent probes based on photoinduced electron transfer (PET) switching consistently display incomplete recovery of emission upon Cu(I) binding compared to the corresponding isolated fluorophores, raising the question of whether Cu(I) might engage in adverse quenching pathways. To address this question, we performed detailed photophysical studies on a series of Cu(I)-responsive fluorescent probes that are based on a 16-membered thiazacrown receptor ([16]aneNS3) tethered to 1,3,5-triarylpyrazoline-fluorophores. The fluorescence enhancement upon Cu(I) binding, which is mainly governed by changes in the photoinduced electron transfer (PET) driving force between the ligand and fluorophore, was systematically optimized by increasing the electron withdrawing character of the 1-aryl-ring, yielding a maximum 29-fold fluorescence enhancement upon saturation with Cu(I) in methanol and a greater than 500-fold enhancement upon protonation with trifluoroacetic acid. Time-resolved fluorescence decay data for the Cu(I)-saturated probe indicated the presence of three distinct emissive species in methanol. Contrary to the notion that Cu(I) might engage in reductive electron transfer quenching, femtosecond time-resolved pump-probe experiments provided no evidence for formation of a transient Cu(II) species upon photoexcitation. Variable temperature 1H NMR experiments revealed a dynamic equilibrium between the tetradentate NS3-coordinated Cu(I) complex and a ternary complex involving coordination of a solvent molecule, an observation that was further supported by quantum chemical calculations. The combined photophysical, electrochemical, and solution chemistry experiments demonstrate that electron transfer from Cu(I) does not compete with radiative deactivation of the excited fluorophore, and hence, that the Cu(I)-induced fluorescence switching is kinetically controlled.
Keywords: copper, fluorescent probes, photoinduced intramolecular electron transfer, PET, Marcus theory, pyrazoline fluorophores
Introduction
The development of synthetic fluorescent probes for the detection of transition metal cations represents a very active and steadily growing research field.1 An important class of cation-responsive probes is based on a photoinduced electron transfer (PET) switching mechanism, which translates the metal-binding event into a fluorescence emission increase.2 While numerous PET probes have been reported for the detection of closed-shell metal cations, including Zn(II),3 Cd(II),4 and Hg(II),5,6 the detection of redox-active transition metals such as Cu(I/II)6-8 and Fe(II/III)9 has received less attention. The fluorescence-based detection of these cations is particularly challenging due to interfering metal-mediated quenching pathways, for example through enhanced spin-orbit coupling or competing energy and electron transfer processes. While these undesired quenching pathways can be reduced or in some cases even eliminated through the use of electronically decoupled metal receptor moieties,10 reports on Cu(I)-responsive PET probes consistently showed incomplete recoveries of the fluorescence quantum yields compared to the corresponding isolated fluorophores, thus raising the question of whether Cu(I) might be directly involved in adverse quenching pathways. Here we report on detailed photophysical studies that were aimed at clarifying the role of Cu(I) in mediating fluorescence quenching in PET probes.
The molecular architecture of PET probes is based on a donor-spacer-acceptor (D–A) framework that combines a cation receptor with a suitable fluorophore. In the absence of the analyte, the fluorescence emission is strongly quenched due to a fast intramolecular photoinduced electron transfer reaction from the electron-rich cation receptor (D) to the excited fluorophore (A*) acting as the electron acceptor (Scheme 1, left). The formed radical ion pair (D+–A−) undergoes non-radiative charge recombination back to the initial ground state. Binding of the metal cation to the receptor moiety results in a less favorable donor potential, which slows down the kinetics for PET quenching and thus increases the emission quantum yield. Because redox-active cations such as Cu(I) may also act as electron donors, two additional non-radiative deactivation pathways A and B must be considered (Scheme 1, right). In pathway A, an analogous radical ion pair (D+–A−) is formed first, albeit with a slower rate due to an increase in donor potential in the presence of Cu(I), followed by an electron transfer from Cu(I) to the radical cation (D•+). Back-electron transfer to the intermediately formed Cu(II) species then regenerates the initial ground state. Because electron donation from Cu(I) is preceded by formation of the radical ion pair, only the rate constant ket of the first ET reaction will affect the emission response. Hence, Cu(I) would appear to act as a Lewis acid, and in principle, it should be possible to fully recover the fluorescence emission of the unquenched fluorophore. In contrast, pathway B directly competes with radiative deactivation to form the same Cu(II)-intermediate (Scheme 1, right). Depending on the rate constant k”et, this pathway might severely compromise the fluorescence recovery, even if ket is much slower than kr in the presence of Cu(I).
Scheme 1.

While any Cu(I)-responsive PET probe with D–A architecture would be suitable to explore the importance of these pathways, we decided to take advantage of the synthetic accessibility and photophysical tunability of 1,3,5-triarylpyrazoline-based probes (Chart 1a).11-13 In these fluorophores, two of the key PET parameters, the excited state equilibrium energy ΔE00 and the acceptor potential E(A/A−), can be rationally tuned to adjust the change in free energy of the PET reaction (ΔGet) for a given donor potential E(D+/D) as expressed by the Rehm-Weller equation (1).14
Chart 1.

| (1) |
The term wp refers to the Coulombic stabilization energy of the radical ion pair formed upon PET. In polar solvents, this value is typically small due to dielectric screening.
The fluorophore π-system in 1,3,5-triarylpyrazolines is comprised of the central pyrazoline core and the two aryl rings in the 1- and 3-positions, which are coupled through the sp2-hybridized nitrogen and carbon atoms of the heterocycle. Electron withdrawing substituents R2 on the aryl ring in the 1-position of the pyrazoline system yield a large increase of ΔE00 but only a small change of E(A/A−). Conversely, substituents R1 on the 3-aryl ring influence E(A/A−) more strongly than ΔE00. This property can be exploited to gradually adjust the PET driving force for any given receptor unit and thus to optimize fluorescence enhancement upon analyte binding.12 The aryl ring in the 5-position is electronically decoupled from the fluorophore π-system, thus offering an opportunity to attach a metal-receptor R3 for PET switching.7 To bind Cu(I) with high affinity and sufficient redox stability,15 we chose a 16-membered trithiazacyclohexadecane ([16]aneNS3) macrocycle as the receptor moiety (Chart 1b). Furthermore, previous studies showed that the donor potential of N,N-dialkylanilines is well matched with the acceptor potential of pyrazolines carrying a p-cyano substituent on the 3-aryl ring.12 Based on these considerations, we synthesized a series of pyrazoline derivatives 1a-e with varying PET driving forces and evaluated their photophysical properties. To gauge the degree of fluorescence recovery upon saturation with Cu(I), we also characterized each derivative in acidic solution. Because the protonated anilinium cation is electrochemically inactive, acidic conditions should lead to a full recovery of the fluorescence emission.12 Finally, to elucidate the role of the proposed excited state pathways, we performed detailed time-resolved fluorescence and transient absorption experiments.
Experimental Section
Synthesis
Procedures for the synthesis of derivatives 1a-e and all intermediates are provided in the Supporting Information.
Steady-State Absorption and Fluorescence Spectroscopy
All sample solutions were filtered through 0.2 μm Teflon membrane filters to remove interfering dust particles or fibers. UV-vis absorption spectra were recorded at 25 °C using a Varian Cary Bio50 UV-vis spectrometer with constant-temperature accessory. Steady-state emission and excitation spectra were recorded with a PTI fluorimeter. For all measurements the path length was 1 cm with a cell volume of 3.0 mL. The fluorescence spectra have been corrected for the spectral response of the detection system (emission correction file provided by instrument manufacturer) and for the spectral irradiance of the excitation channel (via a calibrated photodiode). Fluorescence titrations with Cu(I) were carried out at a fluorophore concentration of 2.3 μM in MeOH by adding 0.1 molar equivalents from a 1 mM stock solution of [Cu(I)(CH3CN)4]PF6 in MeOH containing 10% CH3CN (v/v). Because the pKa of trifluoroacetic acid (TFA) is approximately 5 pKa units higher in methanol compared to aqueous solution,16 a large excess of TFA (180 mM) was required to ensure quantitative protonation of the aniline nitrogen as determined by saturation experiments. Quantum yields were determined using quinine sulfate dihydrate in 1.0 N H2SO4 as the fluorescence standard (Φf = 0.54 ± 0.05).17
Picosecond Fluorescence Spectroscopy
Time-resolved fluorescence decay data were acquired at an emission wavelength of 480 nm with a sample concentration of 0.8 μM using a single photon counting spectrometer (Edinburgh Instruments, LifeSpec Series) equipped with a pulsed laser diode as the excitation source (372 nm, FWHM = 80 ps, 10 MHz repetition rate, 1024 channel resolution). Sample solutions of the fluorophore saturated with excess Cu(I) were prepared based on steady-state fluorescence titrations as described above. For measurements under acidic conditions, trifluoroacetic acid was directly added to the sample solution in MeOH (final concentration 180 mM). The time decay data were analyzed by non-linear least squares fitting with deconvolution of the instrumental response function using the FluoFit software package.18
Femtosecond Transient Absorption Spectroscopy
Spectra were acquired using a commercial transient absorption spectroscopy system (Newport, Helios). This system accepts two input laser beams, one of variable wavelength used as the pump beam and one of a fixed wavelength (800 nm) used to generate the probe beam in a proprietary nonlinear optical crystal. For the experimental pump beam, the light source was an ultrafast optical parametric amplifier (Newport, TOPAS) running at a repetition rate of 1 kHz, pumped by a Ti:Sapphire regenerative amplifier (Newport, Spitfire). All experiments were performed using the TOPAS output at 350 nm with a pulse width of approximately 120 fs. Approximately 5% of the Spitfire fundamental at 800 nm was used for white light generation (420 – 800 nm) in the Helios crystal to provide the experimental probe beam. At these specifications, the instrument response function is approximately 200 fs. The time window that can be studied is 3200 picoseconds; the transient spectra were acquired starting at a delay of −1 ps and continued to a delay of 3000 ps. At each time point, data were averaged for 1.5 seconds. The Helios pump beam was chopped at 500 Hz to obtain pumped (signal) and non-pumped (reference) absorption spectra of the sample. A correction factor for chirp in the probe beam was generated using the ultrafast response of CS2, and was applied to all data sets. The data were stored as 3-D Wavelength-Time-Absorbance matrices that were exported for use with the fitting software. The solutions studied had an OD350 in 2 mm path-length cuvettes of 0.07-0.45, and were stirred continually throughout the data acquisition.
Cyclic Voltammetry
The cyclic voltammograms were acquired in methanol or acetonitrile containing 0.1 M Bu4NPF6 as the electrolyte using a CH-Instruments potentiostat (Model 600A). The samples were measured under inert gas at concentrations ranging from 50 μM to 3 mM in a single compartment cell with a glassy carbon working electrode and a Pt counter electrode. An aqueous Ag/AgCl reference electrode (3 M KCl) was used in methanol, and a non-aqueous Ag/AgNO3 (10 mM in 0.1 M Bu4NPF6/CH3CN) reference electrode in acetonitrile. The half-wave potentials were referenced to ferrocene as the internal or external standard as recommended by IUPAC.19 Measurements were typically performed with a scan rate of 100 mVs−1 or as indicated in the text.
Computational Methods
All calculations were carried out with the Q-Chem electronic structure calculation suite of programs.20 Ground state geometries were energy minimized by DFT with the B3LYP hybrid functional21 and Pople’s 6-31G(d) split valence basis set with added polarization functions. The starting geometry for the Cu(I)-complex of ligand 3 (N-phenyl-1,5,9-trithia-13-azacyclohexadecane) was constructed from the crystal structure coordinates of [1,5-dithia-9,13-diazacyclohexadecane-copper(I)]tetrafluoroborate (Cambridge crystallographic database, code VEMWAL).22 To ensure a stationary point on the ground state potential surface, all geometry optimized structures were verified by a vibrational frequency analysis. For the calculation of gas phase reaction enthalpies, single point energies were calculated at the B3LYP/6-31+G(d,p) level of theory and corrected with the respective scaled harmonic zero-point vibrational energies (ZPVE) obtained from the frequency analysis at the B3LYP/6-31G(d) level (scaling factor 0.9806).23 Molecular orbitals were visualized with the software VMD24 using the Q-Chem plot output data. Details of the computational results including the coordinates of the geometry-optimized structures are provided in the Supporting Information.
Results and Discussion
Contrast Optimization
Following the previously delineated strategy,11,12 we optimized the contrast ratio upon Cu(I)-binding by progressively increasing the electron withdrawing ability of the 1-aryl ring through fluoro-substitution. All pertinent photophysical data including estimations of the PET driving force for each derivative are provided in Table 1. With increasing number of fluoro substituents, the absorption and emission spectra shift to higher energies while maintaining a uniform band shape across all derivatives (Figure 1). The resulting increase of the corresponding zero-zero transition energies ΔE00, estimated as the average between the absorption and emission maxima, directly parallels the increase in the PET driving force (–ΔG00), which in turn is responsible for the progressively decreasing quantum yields in neutral MeOH (Table 1). For derivative 1e the emission intensities and the associated signal/noise ratios were too low for accurate quantum yield determinations. Upon addition of excess [Cu(I)(CH3CN)4]PF6, all derivatives exhibited substantial fluorescence emission increases. Following the trend of the previous model study,12 the emission enhancement factors fe, defined as the ratio of the quantum yields in the presence and absence of Cu(I), first increased before decreasing with increasing PET driving force, reaching a maximum of 29-fold enhancement for the difluoro-substituted derivative 1b. In contrast, protonation of the aniline nitrogen under acidic conditions resulted in substantially greater enhancement factors across all derivatives (Table 1), raising the question of whether Cu(I) might be involved in mediating fluorescence quenching. To address this issue, we systematically investigated both the solution chemistry as well as the excited state dynamics of this system.
Table 1.
Photophysical Data of Pyrazoline Derivatives 1a-e in Methanol at 298K.
| compd | abs λmax (nm) |
em λmax (nm) |
Stokes shift (cm−1) |
ΔΕ00a (eV) |
ΔGetb (eV) |
Φ
Fc |
fed |
|||
|---|---|---|---|---|---|---|---|---|---|---|
| neutral e | acidic f | Cu(I) g | acidic f | Cu(I) g | ||||||
| 1a | 394 | 487 | 4850 | 2.85 | −0.22 | 0.0072 | 0.53 | 0.15 | 74 | 21 |
| 1b | 381 | 480 | 5410 | 2.92 | −0.31 | 0.0033 | 0.54 | 0.095 | 164 | 29 |
| 1c | 373 | 464 | 5260 | 3.00 | −0.39 | 0.0024 | 0.60 | 0.048 | 250 | 20 |
| 1d | 356 | 445 | 5620 | 3.13 | −0.47 | 0.0010 | 0.55 | 0.020 | 550 | 20 |
| 1e | 350 | 448 | 6250 | 3.15 | −0.54 | n.d.h | 0.46 | 0.020 | n.d.h | n.d.h |
zero-zero transition energy; estimated based on ΔE00 = (Eabs(max)+Eem(max))/2.
PET free energy change calculated according to equation (1) with wp = −0.045 eV;12 the experimental donor and acceptor potentials are provided with the supporting information.
fluorescence quantum yield; quinine sulfate as reference.
fluorescence enhancement factor fe = ΦF/Φneutral.
methanol.
180 mM TFA in methanol.
10 μM [Cu(I)(CH3CN)4]PF6 in methanol (0.1% acetonitrile).
signal/noise ratio insufficient for accurate determination.
Figure 1.

Normalized absorption and emission spectra of pyrazoline derivatives 1a-e in methanol (298 K). Absorption traces are depicted with dotted lines (left) and emission spectra with solid lines (right). The shaded area indicates the tunable range of the excited-state energy ΔE00 within each compound series.
Solution Equilibrium with [Cu(I)(CH3CN)4]PF6
The presence of multiple coordination equilibria could complicate the fluorescence response of the probes upon addition of Cu(I). Of particular concern was the possibility of Cu(I)-mediated formation of dimers or higher oligomers, which might undergo self-quenching and thus lower the quantum yield and contrast ratio compared with the acidic solution. To investigate the ligand-Cu(I) binding stoichiometry in methanol, we first performed a molar-ratio titration with fluorophore 1a and [Cu(I)(CH3CN)]4PF6. As illustrated in Figure 2, the fluorescence emission of 1a increased linearly and was saturated at 1 molar equivalent. Excess Cu(I) did not lead to further changes of the emission intensity. In agreement with this observation, a 1H NMR titration of the isolated ligand N-phenyl-1,5,9-trithia-13-azacyclohexadecane 3 with [Cu(I)(CH3CN)4]PF6 also indicated saturation at 1 molar equivalent of Cu(I) (Figure S1, Supporting Information). At substoichiometric concentrations of Cu(I), only single resonances for each set of equivalent protons were observed, indicating rapid metal exchange kinetics exceeding the fast exchange limit on the NMR time scale. The solution chemistry studies thus confirmed the presence of a defined 1:1 ligand-Cu(I) equilibrium and provided no evidence for formation of aggregates or oligomeric coordination species that might compromise the quantum yield and lower the fluorescence enhancement factors compared to the acidic solution.
Figure 2.

Fluorescence titration of pyrazoline 1a (2.3 μM) with [Cu(I)(CH3CN)4]PF6 in MeOH (298 K, excitation at 345 nm). Inset: Molar-ratio plot for the fluorescence intensity change at 490 nm.
Copper Redox Chemistry
To study the electrochemical properties of the Cu(II/I) couple coordinated to the thiazacrown receptor without interference from the pyrazoline fluorophore, we utilized the truncated ligand 3 as a model compound. The formal potential of the Cu(II/I) couple coordinated to the ligand can be readily measured by cyclic voltammetry of the Cu(II)-complex.25 To determine the amount of Cu(II) needed to saturate ligand 3, we first performed a mol-ratio titration with Cu(OTf)2 in methanol. Only at a large excess of Cu(II) were we able to discern changes in the UV-vis absorption spectrum, indicating a very low affinity of 3 towards Cu(II). In the presence of 10 mM Cu(OTf)2, we observed formation of a new band with a maximum at 478 nm (Figure S3a, Supporting Information). Unlike the broad shape expected for a charge-transfer band, the absorption trace showed distinct vibronic structure that resembled the spectrum of the N,N,N’,N’-tetramethylbenzidine radical cation,26 apparently indicating oxidative dimerization of the ligand. Treatment of the isolated dimer (6, see Supporting Information) with Cu(OTf)2 yielded the same spectral signature at 478 nm, thus independently confirming the formation of the dimer radical cation (Figure S3b, Supporting Information). In contrast, no changes in the UV-vis spectrum were observed for compound 1a under the same conditions (data not shown), indicating that the pyrazoline substituent in the para position of the aniline ligand inhibited dimerization. While Cu(II)-mediated oxidative coupling of N,N-dialkylanilines has been reported in the literature,27,28 the reaction required acetonitrile, a solvent that greatly favors the Cu(I) state.29 A formal potential of 0.40 V vs. SHE has been reported for the Cu(II/I) couple solvated in methanol.29 To compare this value with the donor potential of ligand 3 measured against Fc+/0 as the reference, the following conversion can be applied. According to the manufacturer, the potential of the aqueous Ag/AgCl (3 M KCl) reference electrode used in our measurements is 0.21 V vs. SHE. Given the half-wave potential of 0.38 V of the Fc+/0 couple under the experimental conditions, we calculated a corrected potential of −0.19 V vs. Fc+/0 for the solvated Cu(II/I) couple in methanol. While there remains some uncertainty in the above conversion due to the exclusion of junction potentials, the solvated Cu(II/I) couple is clearly a much weaker oxidant by approximately 0.58 V compared to the radical cation of ligand 3 (E(D+/D) = 0.39 vs Fc+/0). Because formation of the latter species is a prerequisite for the observed oxidative coupling reaction, we can conclude that the Cu(II) complex of 3 must act as an oxidant. This in turn implies that the reduction potential of this complex is similar or greater than the estimated donor potential of 0.39 V (vs. Fc+/0) of the free ligand 3. Concluding from the electrochemical properties of the Cu(II/I) couple coordinated to the thiazacrown receptor, a competing PET quenching pathway mediated by Cu(I) is thermodynamically feasible.
Fluorescence Decay Kinetics
To gain information about the excited state dynamics and possibly the role of Cu(I) in fluorescence deactivation, we performed time-resolved fluorescence decay measurements with derivative 1a as a representative compound. The compound was excited at 372 nm with a short laser pulse (80 ps FWHM), and the emission decay signal was collected by single photon counting at 480 nm. As illustrated with Figure 3, in neutral methanol the fluorescence emission decayed rapidly involving complex kinetics. The data fit best with a triexponential decay involving two short components with 34 ps and 232 ps lifetimes, and a component with 3.53 ns lifetime (Table 2). Repeated HPLC purification of 1a resulted in a decrease of the long-lifetime component, indicating the presence of a difficult to remove impurity (<0.1%). Despite the small fractional contribution of the long-lifetime component, the tri-exponential fit yielded greatly improved residuals compared to a bi-exponential decay model (χ2 = 2.56).
Figure 3.
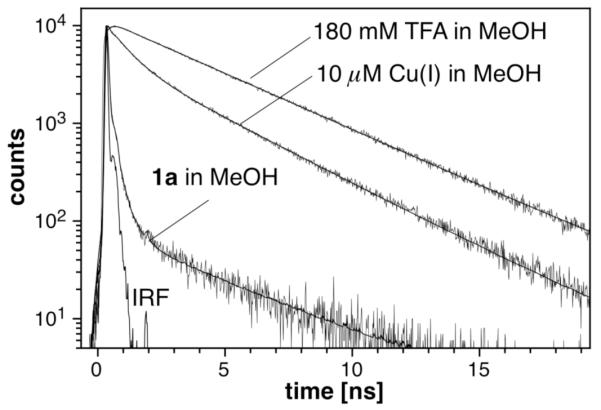
Time-dependent fluorescence decay profile of 1a in methanol, and in the presence of 10 μM [Cu(I)(CH3CN)4]PF6, or 180 mM trifluoroacetic acid (TFA). A 1 μM solution of 1a was excited at 372 nm (80 ps FWHM) and the emission signal was detected by single photon counting at 480 nm. Non-linear least squares fitted profiles are shown as solid lines (see Table 2 for fitting data; IRF = instrument response function).
Table 2.
Time-resolved Fluorescence Decay Data for Compound 1a and 2 in Methanol at 298 K.
| Conditions | τi (ns) a | aib | fic | χ2d | k0 (s−1) e | |
|---|---|---|---|---|---|---|
| 1a | MeOH | 0.0341 ± 0.0001 | 0.967 | 0.740 | 0.851 | 2.9×10¹⁰ |
| 0.232 ± 0.011 | 0.032 | 0.167 | 4.3×10⁹ | |||
| 3.53 ± 0.05 | 0.001 | 0.093 | 2.8×10⁸ | |||
| 1a | TFA (180 mM) in MeOH |
3.76 ± 0.01 | 1.000 | 1.000 | 1.145 | 2.7×10⁸ |
| 1a | [Cu(I)(CH3CN)4]PF6 (10 μM) in MeOH |
0.084 ± 0.03 | 0.347 | 0.023 | 0.970 | 1.2×10¹⁰ |
| 0.774 ± 0.007 | 0.359 | 0.221 | 1.3×10⁹ | |||
| 3.23 ± 0.04 | 0.294 | 0.756 | 3.1×10⁸ | |||
| 2 | MeOH | 3.76 ± 0.01 | 1.000 | 1.000 | 1.380 | 2.7×10⁸ |
Fluorescence lifetime.
Fractional amplitudes with for the multiexponential decay function .
Fractional intensities .
Goodness of fit parameter.
Excited state deactivation rate k0 = 1/τi.
Upon addition of trifluoroacetic acid (TFA), mono-exponential decay kinetics with a lifetime of 3.76 ns were observed. For comparison, we also measured the decay kinetics of compound 2, which contains the same pyrazoline fluorophore but lacks the thiazacrown moiety. In neutral methanol, 2 displayed mono-exponential decay kinetics with a lifetime of 3.76 ns. Consistent with effective inhibition of the PET quenching process, under acidic conditions compound 1a yielded indistinguishable decay kinetics compared with 2 in neutral methanol.
Saturation of 1a with Cu(I) in methanol resulted in surprisingly complex decay kinetics. Non-linear least squares fitting revealed three distinct decay components with similar fractional amplitudes but distinctly different lifetimes of 84 ps, 0.77 ns, and 3.23 ns (Table 2), suggesting the presence of three distinct emissive species emitting with different decay kinetics. It is noteworthy that the long-lifetime component decays with kinetics comparable to the acidic conditions. The species responsible for this component must therefore invoke similar reduction in the PET quenching kinetics compared to the protonated form. In agreement with weak Cu(II)-binding, addition of 10 μM Cu(II)(OTf)2 to a solution of 1a in methanol had no effect on the fluorescence decay kinetics.
Steady-state Fluorescence Emission Profiles
To investigate whether divergent non-equilibrating excited state pathways might be responsible for the complex decay kinetics, we acquired the fluorescence emission spectrum of 1a saturated with Cu(I) and also under acidic conditions over a broad excitation energy range of 22000-33000 cm−1 (Figure 4). Contour plots of the emission spectra revealed symmetrical profiles with a single emission maximum centered at 487 nm (20,530 cm−1) for both conditions. Given the nearly indistinguishable 2D profiles of the protonated vs. Cu(I)-saturated probe, we can conclude that the nature of the emissive state is very similar for both conditions. Excited state processes involving multiple non-equilibrated deactivation pathways can therefore be ruled out in explaining the observed triexponential decay kinetics in the presence of Cu(I).
Figure 4.

Two-dimensional fluorescence excitation-emission contour plots for 1a in methanol containing 10 μM [Cu(I)(CH3CN)4]PF6 (a) or 180 mM trifluoroacetic acid (b).
Transient Absorption Spectroscopy
While picosecond fluorescence decay measurements can provide insights into the excited state dynamics, the method is not suitable to identify the transient reaction products. To gain further information regarding the excited state intermediates formed in the presence of Cu(I) compared to neutral or acidic conditions, we performed a series of ultrafast pump-probe experiments with derivative 1a. Of particular interest was the detection of the charge separated radical ion pair formed through the PET reaction. Transient absorption spectra were recorded at different delay times after photoexcitation at 350 nm with a femtosecond laser pulse (120 fs FWHM). To visualize the evolution of the difference spectra over the entire time course, we constructed a set of color-coded contour plots (Figure 5). Non-linear least squares fitting of the time-dependent absorption traces over the entire spectral range yielded deconvoluted spectra for each transient species (Figure 6). All pertinent numerical data including fitting results are compiled in Table 3.
Figure 5.

Transient absorption spectra of pyrazoline 1a in a) methanol, b) 180 mM TFA in MeOH, and c) 10 μM [Cu(I)(CH3CN)4]PF6 in MeOH. Top row: Color-coded contour plots of the transient difference absorption traces on a logarithmic time scale. Each plot is represented on the absorption scale shown to the right. Bottom row: Transient absorption progression at 480 nm.
Figure 6.

Deconvoluted difference absorption spectra for the transient excited state species of 1a in a) methanol and b) in methanol containing 180 mM TFA. c) Difference absorption spectra for the transient excited state species of 2 lacking the PET donor. Legend: FC = Franck-Condon state (dashed red), 1LE (vibrationally cooled, local excited state (solid yellow, 1ET = non-emissive singlet electron transfer state (solid green), 1CT = emissive singlet charge transfer state (blue).
Table 3.
Pump-probe Transient Absorption Data for Compounds 1a and 2 in Methanol (298 K).
| Conditions | k1 (τ1) | k2 (τ2) | k3 (τ3) | k4 (τ4) | |
|---|---|---|---|---|---|
| 1a | MeOH | 1.6×10¹² (0.6 ps) | 4.2×10¹⁰ (24 ps) | 1.3×10¹⁰ (77 ps) | - |
| 1a | TFA (180 mM) in MeOH |
9.1×10¹¹ (1.1 ps) | 1.4×10¹⁰ (71 ps) | 9.4×10⁹ (0.11 ns) | 2.7×10⁸ (3.7 ns) |
| 1a | [Cu(I)(CH3CN)4]PF6 (10 μM) in MeOH |
1.5×10¹² (0.7 ps) | 1.2×10¹⁰ (83 ps) | 1.9×10¹⁰ (53 ps) | 3.1×10⁸ (3.2 ns) |
| 1.3×10⁹ (0.77 ns) | - | ||||
| 9.4×10⁹ (0.11 ns) | - | - | |||
| 2 | MeOH | 1.3×10¹² (0.8 ps) | 1.5×10¹¹ (6.6 ps) | 1.3×10¹⁰ (77 ps) | 2.6×10⁸ (3.8 ns) |
In methanol alone, two distinct regions at 480 and 630 nm (dashed circles) appeared in the difference spectra after a delay time of approximately 30 ps. The corresponding changes were less pronounced in the presence of Cu(I) and entirely absent under acidic conditions. Given the absorption maximum of 470 nm of the structurally related N,N-dimethylaniline radical cation,28,30 the 480 nm band can be assigned to the thiazacrown substituted 5-aryl radical cation formed during the course of the PET process. The transient absorption progression at 480 nm highlights the differences in evolution of the radical cation in neutral methanol compared to the other two conditions (Figure 5, bottom). The difference spectra fit well with a model composed of a series of four distinct species linked by three consecutive first order rate constants:
| (2) |
The initially formed Franck-Condon (FC) state decayed with a time constant of 0.6 ps to a local excited state (1LE), which was converted to the electron transfer state (1ET) with a time constant of 24 ps. The characteristic 480 and 630 nm bands of the 1ET state rapidly decayed with a 77 ps time constant back to the initial ground state (GS).
Consistent with efficient inhibition of PET, the transient absorption traces of 1a in acidic methanol did not exhibit bands at 480 and 630 nm characteristic of the 1ET state (Figure 5b). The absorption traces were fit again with a model that included five species and four consecutive first order rate constants:
| (3) |
The deconvoluted difference spectra of the first two intermediates strongly resemble the spectra of the Franck-Condon and local excited states under neutral conditions, which indicates formation of qualitatively similar species (Figure 6a and 6b). Vibrational cooling from FC to 1LE again occurred with a fast time constant of 1.1 ps. Interestingly, 1LE did not immediately decay to the ground state S0, but was rapidly converted to two additional intermediate species with qualitatively similar difference absorption spectra (Figure 6b). Using a simplified model composed of a single intermediate species, an average time constant of 90 ps was obtained; however, the fit significantly improved with the expanded model to give two closely spaced time constants of 71 and 110 ps. The latter agreed well with the slightly delayed fluorescence emission already observed in the picosecond lifetime measurements. Given the similarity between the deconvoluted difference spectra, the two intermediate species must have a closely related electronic structure. To explore the potential role of TFA in the delayed fluorescence emission, we also conducted pump probe experiments in neutral methanol with pyrazoline 2 which lacks the thiazacrown receptor. The deconvoluted transient absorption traces agreed well qualitatively with the deconvoluted spectra of 1a under acidic conditions (Figure 6c); however, the data better matched the simpler four species model lacking the second intermediate. While the pump probe experiments indicate that strong acidic conditions impose some effect on the excited state dynamics, there is no substantive evidence for the formation of a structurally different intermediate. Earlier reports on the excited state dynamics of pyrazolines concluded that the emissive state is not identical with the initial photoexcited singlet state.31 Gas phase quantum chemical calculations on a broad range of pyrazoline fluorophores uniformly identified a strongly allowed lowest excited state S1 with π–π* character,13 making the involvement of higher lying excited states along with slow internal conversion processes quite unlikely. Consistent with the broad unstructured emission of 1a reminiscent of a polarized charge-transfer state 1CT, vertical excitation into S1 is presumably followed by substantial structural reorganization combined with solvent relaxation, both of which may contribute to the delayed radiative deactivation.32 The polarized nature of the emissive states is also in agreement with previous solvatochromic studies employing the Lippert-Mataga formalism, which revealed a substantially increased excited state dipole moment compared to the ground state with Δμge ranging between 8-13 D for a broad range of substituted 1,3,5-triarylpyrazolines.13,33 The charge transfer state (1CT ) decayed with a time constant of 3.7 ns, a value that is consistent with the fluorescence lifetime measurements.
At first glance, transient difference spectra in the presence of Cu(I) revealed a similar picture compared to that in methanol alone; however, the bands at 480 and 630 nm characteristic of the 1ET state appeared with substantially reduced intensity (Figure 5c). As illustrated with the transient absorption trace at 480 nm, the 1ET state seems to evolve with similarly rapid kinetics compared to the probe in methanol alone, an observation that contradicts the strong fluorescence enhancement upon Cu(I) coordination. Given the triexponential decay kinetics of the fluorescence emission, it was not surprising that the transient absorption data did not fit to a model solely based on consecutive first order reactions. To account for the multiexponential decay, we assumed a model that involves three coordination species A, B, and C with distinct PET dynamics:
| (4) |
If equilibration of the three species is slow with regard to the nanosecond time scale of the experiment, each deactivation pathway can be modeled with an independent set of differential equations (see Supporting Information). Species A and B undergo PET quenching with rates k2a and k2b, corresponding to the two fast decay components of the fluorescence emission. Both species are assumed to form the vibrationally relaxed excited state 1LE from the Franck Condon state FC with the same rate constant k1. Furthermore, the two charge recombination rate constants k3a and k3b are also assumed to be identical. Species C corresponds to the slow component that involves formation of the radiative charge transfer state 1CT. The vibrational cooling rate constant k1 is again assumed to be identical with the other two species. The rate constant k2c was obtained from the delayed fluorescence emission rate, and k4 from the slow component of the fluorescence decay. Because neither the thiazacrown nor its Cu(I) complex absorb within the wavelength range of the acquired transients, we can assume that the extinction coefficients for the corresponding intermediates for each species remain identical. Furthermore, the triexponential decay profile implies that the three species equilibrate substantially slower than the time scale of radiative deactivation. Therefore, the concentration of the three species at time zero corresponds to the fractional amplitudes obtained from the fluorescence lifetime analysis (Table 2). Because the rate constants k2a, k2b, k2c, and k4 are given by the corresponding inverse lifetimes of the individual components, only k1, k3, and the four molar extinction coefficients were used as variables for non-linear least squares fitting. Despite the considerable constraints imposed by the fixed rate constants, the model fit very well with the data as illustrated with the single time trace at 480 nm (Figure 5c). The inverse rate constant for conversion of FC to LE was found to be 0.7 ps and compared well with the data in neutral and acidic methanol. Similarly, the charge recombination time constant of 56 ps agreed well with the previous fits. The deconvoluted transient absorption traces at 480 nm for each of the three species are shown as dotted lines in Figure 5c. In agreement with the fluorescence lifetime data, the pump probe experiments indicate the presence of three species with distinct PET quenching kinetics. Most importantly, in the presence of Cu(I) we found no evidence for the formation of an additional transient reaction product that was not also formed in methanol alone and under acidic conditions. Consistent with the steady-state fluorescence emission profiles, the nature of all involved transient species remains qualitatively unchanged; only the kinetics of their interconversion differs as a function of Cu(I) or proton concentration.
Variable Temperature 1H NMR Spectra
Although the fluorescence molar-ratio titrations firmly established a 1:1 stoichiometry for the interaction of Cu(I) with 1a or ligand 3, the fluorescence lifetime and pump probe data unequivocally support the presence of three distinct species. Furthermore, given the uniform nature of the observed transient reaction products, we concluded that these three species must somehow differ with regard to their coordination mode only, for example through binding of a counter ion or solvent molecule in the first coordination sphere. To find supporting evidence for this hypothesis, we conducted variable temperature 1H NMR experiments. The initial molar-ratio titration of 3 with Cu(I) at room temperature indicated a fast exchange equilibrium with regard to the NMR time scale. If there are multiple equilibria present involving several distinct coordination species, changes in temperature should give rise to non-uniform chemical shift changes. Figure 7 shows representative traces of the aromatic and aliphatic region of ligand 3 in the presence of 1 molar equivalent Cu(I)(CH3CN)4PF6 in CD3OD at three temperatures. Compared to the uncoordinated ligand, which is shown at the bottom, all resonances are shifted downfield. When decreasing the temperature from 20°C to −20°C, the aromatic resonances of the Ha/Ha’, Hb/Hb’, and Hc protons gradually drift back towards the respective positions of the free ligand (Figure 7a, left). While the chemical shift itself, even in the absence of a dynamic equilibrium, is sensitive to temperature variations, the observed changes are larger than expected. This is in fact directly confirmed by the insignificant shift of the thioether methylene resonances in the aliphatic region (Figure 7a, right). A plot of the chemical shift changes as a function of temperature best illustrates the dramatically different behavior of the two sets of proton resonances (Figure 7b). While the binding affinity of chelate complexes is expected to decrease with decreasing temperature, we would anticipate a gradual shift of all resonances upon decomplexation. The temperature insensitivity of the chemical shift for the thioether methylene protons therefore suggests that Cu(I) remains coordinated. At the same time, weakening of the nitrogen-Cu(I) interaction at lower temperatures is expected to enhance the π-donation ability of the aniline nitrogen due to an increasingly flattened geometry with enhanced sp2 character. As a consequence, the proton resonances are expected to undergo an upfield shift, as was indeed observed. Even at the lowest accessible temperature in CD3OD, the equilibrium system did not approach the slow exchange regime or coalescence point, which indicates a fast dynamic exchange between these species. It is important to note that the time scale of NMR is vastly different compared to fluorescence spectroscopy; therefore, the fast exchange dynamics does not contradict the triexponential decay profile observed in the lifetime measurements. The observed temperature dependence of the chemical shift changes is consistent with an equilibrium that involves at least two types of Cu(I) coordination species. Besides the expected 4-coordinate complex with the thiazamacrocycle, an additional species containing an auxiliary ligand, either a solvent molecule or possibly the counter ion, must be present. As the temperature is lowered, the equilibrium is shifted in favor of the latter species due to the decreasing contribution of the entropy term. This in turn implies that the mixed coordination species is enthalpically more favorable compared to the tetradentate macrocyclic complex.
Figure 7.

Variable temperature 1H NMR experiment of ligand 3 in the presence of 1 molar equivalent [Cu(I)(CH3CN)4]PF6 in CD3OD.
Quantum chemical calculations
Due to the rapid exchange dynamics, the variable temperature NMR experiments prevented us from identifying the individual components of the equilibrium system. To gain further insights into the nature of possible coordination species containing an auxiliary ligand, we therefore performed a series of quantum chemical calculations. To assess the stability of the Cu(I)-complex with ligand 3 coordinated to an additional solvent ligand, we used density functional theory to calculate the gas phase enthalpy ΔHaux of the following equilibrium (5):
| (5) |
Table 4 shows all pertinent data obtained from these calculations. The lowest energy structure of complex [3-Cu(I)]+ assumes an all-trans t,t,t configuration,22,34 in which all of the 6-membered chelate rings adopt a chair conformation (Figure 8, left; see also Supporting Information for more detailed structural data). Replacement of the aniline nitrogen donor with methanol yielded the ternary complex t,t-[3-Cu(I)(MeOH)]+, which revealed a hydrogen bonding interaction between the OH group of methanol and the aniline nitrogen (Figure 8, middle; Supporting Information). The gas phase enthalpy for formation of t,t-[3-Cu(I)(MeOH)]+ as defined by equilibrium (5) is exothermic with ΔHMeOH = −12 kcal/mol (Table 4), a result that is consistent with the proposed coordination of methanol at low temperature in the NMR study. If the configuration of the complex is switched from trans,trans to trans,cis the aniline nitrogen is pushed further away from the copper center and is no longer accessible for H-bonding (Figure 8, right). The geometry optimized structure of this complex c,t-[3-Cu(I)(MeOH)]+ was found to be slightly higher in energy than the H-bonded structure; however, the gas phase association enthalpy remained exothermic with ΔHMeOH = −10 kcal/mol.
Table 4.
Computational Data for the Geometry Optimized Cu(I) Complexes of Ligand 3 Methanol as an Auxiliary Ligand.a
| Species | Σ b | ΔHauxc (kcal/mol) |
HOMO energy (eV) |
donor obital energy d (eV) |
|---|---|---|---|---|
| t,t,t-[3-Cu(I)]+ | 326.7 | 0 | −8.239 | −9.746 |
| t,t-[3-Cu(I)(MeOH)]+ | 336.7 | −12.4 | −8.306 | −9.001 |
| c,t-[3-Cu(I)(MeOH)]+ | 351.0 | −10.2 | −7.824 | −7.824 |
B3LYP/6-31+G(d,p)//B3LYP/6-31G(d) level of theory.
Sum of bond angles at aniline nitrogen N1 (C7-N1-C8, C8-N1-C11, C7-N1-C11, atom numbering scheme provided in Supporting Information).
Association enthalpy as defined by equation 5.
homologous to aniline HOMO with B2 symmetry.
Figure 8.

Effect of solvent coordination on the orbital energy levels of Cu(I) complexes with ligand 3. The depicted orbital diagrams refer to the corresponding energy levels marked in blue.
Coordination of methanol to [3-Cu(I)]+ imposes significant structural changes that directly affect the PET thermodynamics. Judging from the sum of the bond angles at the aniline nitrogen (Σ, Table 4), solvent coordination results in flattening of the macrocycle geometry at this position. In the parent complex [3-Cu(I)]+, the aniline nitrogen is sp3 hybridized and adopts a near ideal trigonal pyramidal geometry with Σ = 331°. While in the H-bonded complex t,t-[3-Cu(I)(MeOH)]+ the aniline nitrogen is still somewhat pyramidalized, the increased Σ of 337° implies some flattening and therefore increased p-character of the nitrogen lone pair. In the cis,trans isomer c,t-[3-Cu(I)(MeOH)]+ the aniline nitrogen is engaged in neither metal coordination nor H-bonding, and assumes a near trigonal planar geometry with Σ = 351°. With the change from a trigonal pyramidal to a trigonal planar geometry, the aniline nitrogen is transformed from a strong σ-acceptor into a π-donor. Previous quantum chemical calculations showed that the aniline molecular orbital with B2 symmetry serves as the electron donor in the PET process.13 As illustrated in Figure 8, the energy of this orbital is strongly affected by the structural changes imposed on the aniline nitrogen. As the aniline nitrogen approaches a more flattened geometry, its π-donor strength increases, which in turn results in an increased MO energy and therefore a more favorable electron transfer thermodynamics. At the same time, the energy of the highest occupied metal-centered d-orbital remains largely unchanged, a result that strongly contrasts the widely different deactivation rates extracted from the fluorescence lifetime data of 1a in the presence of Cu(I) (Table 2). The experimental data are therefore best reconciled with a model that entails three distinct coordination species with varying ability to promote PET from the aniline B2 MO as the electron donor. To further support this hypothesis, we repeated the above time resolved fluorescence decay measurements in dichloromethane, a non-coordinating solvent in which no solvent-associated species should form. The decay profile of 1a saturated with Cu(I) indeed fit best a monoexponential rate law with a long lifetime of τ = 4.03 ns (Figure S4d, Supporting Information), thus confirming the absence of a Cu(I)-promoted quenching channel.
In summary, Figure 9 illustrates the relevant excited state processes and the associated dynamics found for the various solution conditions. In neutral methanol, the initially formed Franck-Condon state (FC) undergoes vibrational cooling to a local excited singlet state 1LE, which is rapidly converted to the electron transfer state 1ET followed by charge recombination back to the initial ground state GS (Figure 9, center). Under strongly acidic conditions, the aniline nitrogen is protonated which effectively inhibits the PET process (Figure 9, left). The initially formed local excited state 1LE is now converted to a more polarized (pyrazoline centered) charge-transfer state, which undergoes radiative deactivation back to the ground state. Finally, saturation of 1a with Cu(I) in neutral methanol leads to the formation of three coordination species with distinct deactivation pathways (Figure 9, right).
Figure 9.

Jablonski diagram for the excited state deactivation pathways of probe 1a in neutral methanol (center), under acidic conditions (left), and in the presence of [Cu(I)(CH3CN)4]PF6 (right). The indicated lifetime data are based on the pump probe experiments (GS = ground state, FC = Franck-Condon excited state, 1LE = local excited state, 1ET = electron transfer state, 1CT = emissive charge transfer excited state.
While according to the derived model all species form a similar local excited state 1LE, the subsequent deactivation pathways differ depending on the energy level of the ligand-centered MO acting as the electron donor in PET. In the NS3-coordinated, all-trans configured complex t,t,t-[1a-Cu(I)]+ (A), the energetics for PET are unfavorable and the initially formed 1LE state decays through 1CT with fluorescence emission back to the ground state. This complex is in equilibrium with two additional solvent coordinated species, assigned as t,t-[1a-Cu(I)(MeOH)]+ (B) and c,t-[1a-Cu(I)(MeOH)]+ (C), which based on the gas phase quantum chemical calculations are expected to have a more favorable PET driving force. Although all three complexes are engaged in a dynamic exchange equilibrium that exceeds the NMR timescale, the fluorescence decay and pump probe data can be modeled as a superimposition of the individual non-equilibrating decay pathways.
Contrary to the notion that Cu(I) might engage in reductive electron transfer quenching, we found no evidence for formation of a transient Cu(II) species upon photoexcitation of Cu(I)-saturated 1a. Such a quenching pathway would require electron transfer kinetics comparable to the observed excited state deactivation rate of k0 = 2.6 × 10⁸ s−1. While many efforts have been made to generate Cu(II/I) complexes with large self-exchange electron transfer rate constants, only a few systems were described that exceeded 105 M−1s−1.35 The structurally related copper complex of 1,5,9,13-tetrathiacyclohexadecane ([16]aneS4), which has the same ring size as ligand 3, exhibited a comparatively slow self-exchange rate with k11 = 3.7 × 10³ M−1s−1.35,36 The reorganizational energy barriers for Cu(II/I) systems are typically high due to large changes brought about the inner-coordination sphere of copper, often involving bond breakage or formation. Furthermore, the large distance between the Cu(I) center and the fluorophore also renders PET from Cu(I) less favorable. As a result, PET quenching is kinetically controlled and determined by the energetics of the aniline donor but not the Cu(I) center. Most importantly, the redox stability of the Cu(II/I) couple is not an impediment for the design of Cu(I)-selective turn-on sensors. If the solution equilibria were devoid of ternary solvent adducts and included only the binary complex t,t,t-[1a-Cu(I)]+ (A), the fluorescence enhancement of 1a would increase from 21 to 90-fold as judged by the ratio of the excited state deactivation rate constants of the free ligand and the slowest component in the presence of Cu(I).
Conclusions
Following the previously reported approach for tuning of the PET thermodynamics in triarylpyrazoline-based probes,12 we successfully optimized the contrast ratio of a Cu(I)-responsive fluorescent probe. While we achieved a strong 29-fold fluorescence enhancement upon saturation with Cu(I) in methanol, the contrast ratio remained significantly lower compared to acidic conditions. Detailed time-resolved spectroscopic studies revealed that the contrast ratio for Cu(I)-binding is not compromised by reductive electron transfer from Cu(I) but by the formation of several ternary coordination species with varying PET driving forces. Most importantly, the combined photophysical, electrochemical, and solution chemistry experiments suggest that electron transfer from Cu(I) does not compete with radiative deactivation of the excited fluorophore, and hence, that the Cu(I)-induced fluorescence switching is kinetically controlled. The results of this study highlight the challenges associated with designing high-contrast ratio probes for Cu(I), which not only require careful tuning of the PET thermodynamics but also careful control of the Cu(I) solution chemistry. The conclusions derived from this study are not limited to pyrazoline based probes but generally applicable to the design of Cu(I)-selective probes composed of a rigid, electronically decoupled receptor unit attached to any other fluorophore platform.
Supplementary Material
Acknowledgment
Financial support from the National Institutes of Health (R01GM067169) is gratefully acknowledged. Computations were supported by the Center for Computational Molecular Science and Technology at the Georgia Institute of Technology and under National Science Foundation CRIF Award CHE-0443564. We thank David Bostwick for mass spectral data.
Footnotes
Supporting Information Available: Synthesis and spectroscopic characterization of derivatives 1-4, and additional information as mentioned in the text are available free of charge via the Internet at http://pubs.acs.org.
References
- (1).Demchenko AP. Introduction to Fluorescence Sensing. Springer; 2008. [Google Scholar]
- (2).de Silva AP, Gunaratne HQN, Gunnlaugsson T, Huxley AJM, McCoy CP, Rademacher JT, Rice TE. Chem. Rev. 1997;97:1515. doi: 10.1021/cr960386p. [DOI] [PubMed] [Google Scholar]; Rurack K. Spectrochim. Acta A. 2001;57:2161. doi: 10.1016/s1386-1425(01)00492-9. [DOI] [PubMed] [Google Scholar]
- (3).Nolan EM, Lippard SJ. Acc. Chem. Res. 2009;42:193. doi: 10.1021/ar8001409. [DOI] [PMC free article] [PubMed] [Google Scholar]; Jiang PJ, Guo ZJ. Coord. Chem. Rev. 2004;248:205. [Google Scholar]; Kikuchi K, Komatsu K, Nagano T. Curr. Opin. Chem. Biol. 2004;8:182. doi: 10.1016/j.cbpa.2004.02.007. [DOI] [PubMed] [Google Scholar]
- (4).Cheng TY, Xu YF, Zhang SY, Zhu WP, Qian XH, Duan LP. J. Am. Chem. Soc. 2008;130:16160. doi: 10.1021/ja806928n. [DOI] [PubMed] [Google Scholar]; Xue L, Liu C, Jiang H. Org. Lett. 2009;11:1655. doi: 10.1021/ol900315r. [DOI] [PubMed] [Google Scholar]
- (5).Prodi L, Bargossi C, Montalti M, Zaccheroni N, Su N, Bradshaw JS, Izatt RM, Savage PB. J. Am. Chem. Soc. 2000;122:6769. Rurack K, Resch-Genger U, Bricks JL, Spieles M. Chem. Comm. 2000:2103. Nolan EM, Lippard SJ. J. Am. Chem. Soc. 2003;125:14270. doi: 10.1021/ja037995g. Yoon S, Albers AE, Wong AP, Chang CJ. J. Am. Chem. Soc. 2005;127:16030. doi: 10.1021/ja0557987. Nolan EM, Racine ME, Lippard SJ. Inorg. Chem. 2006;45:2742. doi: 10.1021/ic052083w. Meng XM, Liu L, Hu HY, Zhu MZ, Wang MX, Shi J, Guo QX. Tetrahedron Lett. 2006;47:7961. Nolan EM, Lippard SJ. J. Am. Chem. Soc. 2007;129:5910. doi: 10.1021/ja068879r. Yoon S, Miller EW, He Q, Do PH, Chang CJ. Angew. Chem. Int. Ed. Engl. 2007;46:6658. doi: 10.1002/anie.200701785. Wang J, Qian X. Org. Lett. 2006;8:3721. doi: 10.1021/ol061297u. for a comprehensive review see also Nolan EM, Lippard SJ. Chem. Rev. 2008;108:3443. doi: 10.1021/cr068000q.
- (6).Rurack K, Kollmannsberger M, Resch-Genger U, Daub J. J. Am. Chem. Soc. 2000;122:968. [Google Scholar]
- (7).Yang L, McRae R, Henary MM, Patel R, Lai B, Vogt S, Fahrni CJ. Proc. Natl. Acad. Sci. USA. 2005;102:11179. doi: 10.1073/pnas.0406547102. [DOI] [PMC free article] [PubMed] [Google Scholar]; Verma M, Chaudhry AF, Morgan MT, Fahrni CJ. Org. Biomol. Chem. 2010;8:363. doi: 10.1039/b918311f. [DOI] [PMC free article] [PubMed] [Google Scholar]
- (8).Cody J, Fahrni CJ. Tetrahedron. 2004;60:11099. [Google Scholar]; Zeng L, Miller EW, Pralle A, Isacoff EY, Chang CJ. J. Am. Chem. Soc. 2006;128:10. doi: 10.1021/ja055064u. [DOI] [PMC free article] [PubMed] [Google Scholar]
- (9).Fakih S, Podinovskaia M, Kong X, Collins HL, Schaible UE, Hider RC. J. Med. Chem. 2008;51:4539. doi: 10.1021/jm8001247. [DOI] [PubMed] [Google Scholar]; Bricks JL, Kovalchuk A, Trieflinger C, Nofz M, Büschel M, Tolmachev AI, Daub J, Rurack K. J. Am. Chem. Soc. 2005;127:13522. doi: 10.1021/ja050652t. [DOI] [PubMed] [Google Scholar]
- (10).Rurack K, Resch-Genger U. Chem. Soc. Rev. 2002;31:116. doi: 10.1039/b100604p. [DOI] [PubMed] [Google Scholar]
- (11).Verma M, Chaudhry AF, Fahrni C. J. Org. Biomol. Chem. 2009;7:1536. doi: 10.1039/b821042j. [DOI] [PMC free article] [PubMed] [Google Scholar]
- (12).Cody J, Mandal S, Yang L, Fahrni CJ. J. Am. Chem. Soc. 2008;130:13023. doi: 10.1021/ja803074y. [DOI] [PMC free article] [PubMed] [Google Scholar]
- (13).Fahrni CJ, Yang LC, VanDerveer DG. J. Am. Chem. Soc. 2003;125:3799. doi: 10.1021/ja028266o. [DOI] [PubMed] [Google Scholar]
- (14).Rehm D, Weller A. Isr. J. Chem. 1970;8:259. [Google Scholar]
- (15).Addison AW. Inorg. Chim. Acta. 1989;162:217. [Google Scholar]
- (16).Rived F, Rosés M, Bosch E. Anal. Chim. Acta. 1998;374:309. [Google Scholar]
- (17).Demas JN, Crosby GA. J. Phys. Chem. 1971;75:991. [Google Scholar]
- (18).Enderlein J, Erdmann R. Optics Commun. 1997;134:371. [Google Scholar]
- (19).Gritzner G, Kuta J. Pure Appl. Chem. 1982;54:1527. [Google Scholar]
- (20).Shao YEA, et al. Phys. Chem. Chem. Phys. 2006;8:3172. doi: 10.1039/b517914a. [DOI] [PubMed] [Google Scholar]
- (21).Becke AD. J. Chem. Phys. 1993;98:5648. [Google Scholar]; Lee CT, Yang WT, Parr RG. Phys. Rev. B. 1988;37:785. doi: 10.1103/physrevb.37.785. [DOI] [PubMed] [Google Scholar]
- (22).Balakrishnan KP, Riesen A, Zuberbühler AD, Kaden TA. Acta Crystallogr. C. 1990;46:1236. [Google Scholar]
- (23).Scott AP, Radom L. J. Phys. Chem. 1996;100:16502. [Google Scholar]
- (24).Humphrey W, Dalke A, Schulten K. J. Mol. Graph. 1996;14:33. doi: 10.1016/0263-7855(96)00018-5. [DOI] [PubMed] [Google Scholar]
- (25).Kakos SH, Dressel LT, Bushendorf JD, Kotarba CP, Wijetunge P, Kulatilleke CP, McGillivary MP, Chaka G, Heeg MJ, Ochrymowycz LA, Rorabacher DB. Inorg. Chem. 2006;45:923. doi: 10.1021/ic051670e. [DOI] [PubMed] [Google Scholar]
- (26).Shida T. Electronic Absorption Spectra of Radical Ions. Elsevier; Amsterdam: 1988. [Google Scholar]
- (27).Kirchgessner M, Sreenath K, Gopidas KR. J. Org. Chem. 2006;71:9849. doi: 10.1021/jo061809i. [DOI] [PubMed] [Google Scholar]
- (28).Sumalekshmy S, Gopidas KR. Chem. Phys. Lett. 2005;413:294. [Google Scholar]
- (29).Milazzo G, Caroli S. Tables of Standard Electrode Potentials. Wiley; New York: 1978. [Google Scholar]
- (30).Maroz A, Hermann R, Naumov S, Brede O. J. Phys. Chem. A. 2005;109:4690. doi: 10.1021/jp0503056. [DOI] [PubMed] [Google Scholar]
- (31).Blair JT, Sahyun MRV, Sharma DK. J. Photochem. Photobiol. A. 1994;77:133. [Google Scholar]
- (32).Yang G, Wu H. J. Photochem. Photobiol. A. 1992;66:69. [Google Scholar]
- (33).Güsten H, Heinrich G, Frühbeis H. Ber. Bunsen Ges. Phys. Chem. 1977;81:810. [Google Scholar]; Yan ZL, Wu SK. J. Luminesc. 1993;54:303. [Google Scholar]; Rurack K, Bricks JL, Schulz B, Maus M, Reck G, Resch-Genger U. J. Phys. Chem. A. 2000;104:6171. [Google Scholar]
- (34).McCrindle R, Ferguson G, McAlees AJ, Parvez M, Ruhl BL, Stephenson DK, Wieckowski T. Dalton Trans. 1986:2351. [Google Scholar]
- (35).Rorabacher DB. Chem. Rev. 2004;104:651. doi: 10.1021/cr020630e. [DOI] [PubMed] [Google Scholar]
- (36).Martin MJ, Endicott JF, Ochrymowycz LA, Rorabacher DB. Inorg. Chem. 1987;26:3012. [Google Scholar]
Associated Data
This section collects any data citations, data availability statements, or supplementary materials included in this article.