

Abstract
A large class of cation-responsive fluorescent sensors utilizes a donor-spacer-acceptor (D-A) molecular framework that can modulate the fluorescence emission intensity through a fast photoinduced intramolecular electron transfer (PET) process. The emission enhancement upon binding of the analyte defines the contrast ratio of the probe, a key property that is particularly relevant in fluorescence microscopy imaging applications. Due to their unusual electronic structure, 1,3,5-triaryl-pyrazoline fluorophores allow for the differential tuning of the excited state energy ΔE00 and the fluorophore acceptor potential E(A/A−), both of which are critical parameters that define the ET thermodynamics and thus the contrast ratio. By systematically varying the number and attachment positions of fluoro-substituents on the fluorophore π-system, ΔE00 can be adjusted over a broad range (0.4 eV) without significantly altering the acceptor potential E(A/A−). Experimentally measured D-A coupling and reorganization energies were used to draw a potential map for identifying the optimal ET driving force that is expected to give a maximum fluorescence enhancement for a given change in donor potential upon binding of the analyte. The rational design strategy was tested by optimizing the fluorescence response of a pH sensitive probe, thus yielding a maximum emission enhancement factor of 400 upon acidification. Furthermore, quantum chemical calculations were used to reproduce the experimental trends of reduction potentials, excited state energies, and ET driving forces within the framework of linear free energy relationships (LFER). Such LFERs should be suitable to semi-empirically predict ET driving forces with an average unsigned error of 0.03 eV, consequently allowing for the computational prescreening of substituent combinations to best match the donor potential of a given cation receptor. Within the scaffold of the triarylpyrazoline platform, the outlined differential tuning of the electron transfer parameters should be applicable to a broad range of cation receptors for designing PET sensors with maximized contrast ratios.
Introduction
Fluorescent probes have found widespread applications in cell biology for visualizing the dynamics of intracellular processes.1 An increasing body of research has been devoted to the development of fluorescent probes for the non-invasive measurement of biologically relevant metal cations, such as calcium, magnesium, zinc, or copper, as well as the detection of hazardous heavy metals, including mercury, lead, and cadmium.2 A large class of these sensors utilizes a donor-spacer-acceptor (D-A) molecular framework that can modulate the fluorescence emission intensity through a fast photoinduced intramolecular electron transfer (PET) process.3 In the absence of the cation, fluorescence emission is quenched through PET from the donor to the fluorophore acting as an electron acceptor. Upon binding of the cation to the donor moiety, the PET process is rendered energetically less favorably resulting in a fluorescence increase. Although the photophysical mechanism that dictates the “switch on” behavior of PET sensors is well understood,4 many successfully developed cation sensors have been made based on empirical principles rather than rational design. More recently, tuning of the frontier orbital energy levels involved in the photoinduced electron transfer process has been used as a key concept for the design of a broad range of PET sensors.5,6,7 The optimization of the fluorescence enhancement upon binding of the analyte is particularly important, because it defines the optical sensitivity and contrast ratio in microscopy imaging applications. The goal of this study was to delineate a generalized rational design approach for finely tuning the fluorophore properties and thus optimizing the contrast ratio for a given cation receptor.
A number of photophysical parameters govern the fluorescence enhancement of a PET sensor upon analyte binding. The fluorescence quantum yield of the fluorophore in absence of a quenching electron donor is determined by the radiative and non-radiative deactivation rate constants kr and knr, respectively:8
| (1) |
In the presence of an electron donor (D), an additional non-radiative deactivation pathway is introduced that competes with excited state deactivation as illustrated with the simplified Jablonski diagram in Scheme 1 (left). The singlet excited state 1(D-A*) can undergo a fast intramolecular electron transfer reaction in which the fluorophore is acting as an electron acceptor (A), yielding a radical ion pair (D•+-A•−). Charge recombination is in most cases a non-radiative process regenerating the original ground state species. Depending on the rate ket of electron transfer (ET), fluorescence emission is quenched and the quantum yield is lowered from to Φf:
| (2) |
Scheme 1.

If a rigid sigma-bond spacer is used to connect the electron donor with the fluorophore π-system, electronic coupling between the two units is expected to be small.9 In this case, the electron transfer kinetics is best described as a reaction in the nonadiabatic regime using semiclassical Marcus theory.10 Within this framework, the electron transfer rate constant ket depends on the thermodynamic driving force −ΔGet of the ET reaction, the associated reorganization energy λ, and the electronic coupling HDA between the excited precursor state (1D-A*) and the successor radical ion pair (D•+-A•−):
| (3) |
with kb = Boltzmann constant, T = temperature, and h = Planck constant.
The driving force of the ET process (−ΔGet) in turn can be experimentally estimated by the Rehm-Weller equation (4),11 which relates the free energy change ΔGet with the donor and acceptor ground state potentials E(D+/D) and E(A/A−), respectively, the zero-zero transition energy ΔE00 of the fluorophore, as well as a work term wp corresponding to the Coulomb stabilization energy of the formed radical ion pair in the respective solvent.
| (4) |
Coordination of a cation to the electron-donating moiety of the PET sensor results in an increase of the donor potential E(D+/D) and reorganization energy λ. As a consequence, the ET driving force −ΔGet is lowered (eq 4), the electron transfer rate reduced (eq 3), and the fluorescence quantum yield increased (eq 2). Denoting the new quantum yield and ET rate constant as and , respectively, the observed fluorescence enhancement fe or contrast ratio can be expressed as
| (5) |
Hence, to maximize fe, the difference of the ET rates in the presence and absence of the analyte must be optimized. This can be principally accomplished by adjusting the driving force −ΔGet through changes in E(A/A−) and ΔE00 of the fluorophore or E(D+/D) of the cation receptor acting as the electron donor. Because the cation binding site is electronically decoupled from the fluorophore π-system, the latter parameter can be varied without significantly affecting E(A/A−) and ΔE00. In many cases, however, the cation binding site has been purposefully designed to achieve high selectivity towards a particular analyte, and therefore, adjusting the donor potential E(D+/D) without changing the binding affinity and selectivity of the receptor site is a nontrivial task. For this reason, tuning of either the acceptor potential E(A/A−) or ΔE00 would be more desirable. However, this approach is equally challenging, because both parameters are defined by the fluorophore structure and attempts to tuning of a single parameter are expected to inevitably affect the other. Recent studies demonstrated that these two parameters can be independently adjusted in 1,3,5-triarylpyrazoline-based fluorophores.7 As shown in Scheme 1 (right), two of the aryl rings in this fluorophore communicate electronically through the pyrazoline π-system, whereas the third ring in the 5-position is electronically decoupled and can be utilized as electron donating cation receptor.6,12 Substituents attached to the phenyl-ring in the 1-position have a strong effect on the excited state energy but only a small influence on the reduction potential of the fluorophore. This observation prompted us to investigate whether 1,3,5-triarylpyrazolines could be utilized for optimizing the contrast ratio of PET sensors in a systematic and predictable manner.
Experimental Section
Synthesis
All compounds were prepared following protocols from the literature.7,13 The crude products were purified by flash chromatography and the purity of the final products were confirmed by reversed-phase HPLC (Varian ProStar system with UV detector, acetonitrile-water, gradient 20% –> 2% water.) The chemical structures of the synthesized compounds were confirmed by 1H-NMR, 13C-NMR, MS and high resolution mass spectrometry. Description of the syntheses and detailed analytical data are provided with the Supporting Information.
Absorption and Fluorescence Spectroscopy
All sample solutions were filtered through 0.45 μm Teflon membrane filters to remove interfering dust particles or fibers. UV-vis absorption spectra were recorded at 25 °C using a Varian Cary Bio50 UV-vis spectrometer with constant-temperature accessory. Steady-state emission and excitation spectra were recorded with a PTI fluorimeter. For all measurements the path length was 1 cm with a cell volume of 3.0 mL. The fluorescence spectra have been corrected for the spectral response of the detection system (emission correction file provided by instrument manufacturer) and for the spectral irradiance of the excitation channel (via calibrated photodiode). Quantum yields were determined using quinine sulfate dihydrate in 1.0 N H2SO4 as fluorescence standard (Φf = 0.54 ± 0.05).14 Time-resolved fluorescence decay data were acquired with a single photon counting spectrometer (Edinburgh Instruments, LifeSpec Series, pulsed laser diode excitation at 370 nm, FWHM = 80 ps).
Cyclic Voltammetry
The cyclic voltammograms were acquired in acetonitrile (freshly distilled from calcium hydride) containing 0.1M Bu4NPF6 as electrolyte using a CH-Instruments potentiostat (Model 600A). The samples were measured under inert gas at a concentration of 3 mM in a single compartment cell with a glassy carbon working electrode, a Pt counter electrode, and a Ag/AgNO3 (10 mM in CH3CN) non-aqueous reference electrode. The half-wave potentials were referenced to ferrocene as internal standard. All measurements were performed with a scan rate of 100 mVs−1.
Computational Methods
All calculations were carried out with the Q-Chem electronic structure calculation suite of programs.15 Ground state geometries were energy minimized by DFT with the B3LYP hybrid functional16 and Pople's 6-31+G(d) split valence basis set with added diffuse and polarization functions. The starting geometry for each optimization was constructed from the X-ray coordinates of unsubstituted 1,3,5-triphenyl-pyrazoline.17 To ensure a stationary point on the ground state potential surface, all geometry optimized structures were verified by a vibrational frequency analysis, which at the same time provided also zero point vibrational energy (ZPVE) corrections. Adiabatic gas phase EAs were calculated as the difference between the total energies of the geometry optimized anionic and charge-neutral fluorophores. The electronic energies were corrected with the respective scaled harmonic zero-point vibrational energies (scaling factor 0.9806).18 To obtain estimates of the vertical electronic excitation energies which include some account of electron correlation, time-dependent density functional theory (TD-DFT) calculations19 with the B3LYP functional and the 6-31+G(d) or 6-311+G(2d,2p) basis set were performed. Molecular orbitals were visualized with the software VMD20 using the Q-Chem plot output data. Details of the computational results including the coordinates of the geometry-optimized structures are provided in the Supporting Information.
Results and Discussion
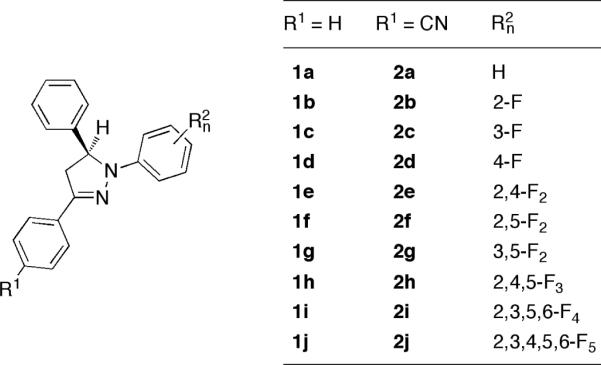
To systematically explore the tunability of the photophysical properties of 1,3,5-triaryl pyrazolines in the absence of a quenching electron donor (D), we first synthesized a small compound library composed of derivatives with increasing number of fluorine substituents attached to various positions of the N-aryl ring (Chart 1). The effect of substituents on the 3-aryl ring was probed by comparing the parent compound series 1a-j with the cyano-substituted compounds 2a-j. All derivatives were synthesized in two steps as previously published.7 Aldol-condensation of benzaldehyde with the acetyl derivative yielded a chalcone intermediate, which was converted to the desired racemic pyrazolines by cyclization with the corresponding fluoro-substituted phenylhydrazine derivative.
Chart 1.
Steady State Absorption and Emission Spectroscopy
A compilation of the photophysical properties for compounds 1a–1j and 2a–2j is given in Table 1. All data were measured at 298K in acetonitrile as solvent. Within the applied concentration range, normalized absorption spectra were superimposable and scaled linearly, indicating no detectable aggregation. Collectively, the two series cover a broad range in absorption (Δλmax = 82 nm) and emission (Δλmax = 105 nm) maxima (Figure 1). With increasing number of fluoro-substituents the absorption and emission maxima were shifted to higher energy. This trend correlates well with the anticipated degree of electron withdrawing character imposed by the fluoro-substituents, which gradually reduce charge delocalization from the 1-N-pyrazoline nitrogen lone pair towards the 3-aryl ring in the ground and excited state.7 The zero-zero transition energy ΔE00, one of the key parameters for tuning the ET thermodynamics (eq 4), varies over nearly 6,000 cm−1 or 0.73 eV. Within each compound series 1 and 2, the tunable range covers more than 3,000 cm−1 or 0.4 eV. A comparison of the Stokes shift revealed only small variations for both series with an average of approximately 6,100 ±500 cm−1, thus indicating similar degrees of exited state geometrical relaxation and solvent stabilization. The rather uniform half width of the normalized absorption and emission spectra further supports similar shapes for the ground and excited state potential energy surfaces across all fluorophores (Figure 1). With the exception of 1i and 1j, all compounds fluoresce brightly with an average quantum yield Φf of 0.6 ± 0.1.
Table 1.
Photophysical Data of Pyrazoline Derivatives 1a–1j and 2a–2j in Acetonitrile at 298K.
| abs λmax[nm] | em λmax[nm] | Stokes shift [cm−1] | ΔE00[a] [cm−1] | Φ F[b] | abs λmax[nm] | em λmax[nm] | Stokes shift [cm−1] | ΔE00 [cm−1] | Φ F[b] | ||
|---|---|---|---|---|---|---|---|---|---|---|---|
| 1a | 356 | 459 | 6,300 | 24.940 | 0.65 | 2a | 396 | 508 | 5,560 | 22,470 | 0.30 |
| 1h | 344 | 445 | 6,580 | 25,770 | 0.64 | 2b | 378 | 496 | 6,280 | 23,310 | 0.58 |
| 1c | 352 | 440 | 5,700 | 25,560 | 0.65 | 2c | 388 | 492 | 5,430 | 23,060 | 0.63 |
| 1d | 357 | 457 | 6,110 | 24,960 | 0.60 | 2d | 393 | 512 | 5,890 | 22,500 | 0.50 |
| 1e | 342 | 447 | 6,880 | 25,800 | 0.55 | 2e | 374 | 496 | 6,580 | 23,450 | 0.59 |
| 1f | 345 | 434 | 5,930 | 26,020 | 0.68 | 2f | 376 | 485 | 5,970 | 23,600 | 0.63 |
| 1g | 347 | 427 | 5,410 | 26,120 | 0.70 | 2g | 381 | 476 | 5,240 | 23,630 | 0.68 |
| 1h | 344 | 437 | 6,220 | 25,960 | 0.64 | 2h | 371 | 488 | 6.460 | 23,720 | 0.62 |
| 1i | 324 | 401 | 5,910 | 27,920 | 0.04 | 2i | 351 | 447 | 6,110 | 25,420 | 0.79 |
| 1j | 314 | 403 | 7,070 | 28.320 | <0.01 | 2j | 343 | 449 | 6,900 | 25,700 | 0.71 |
zero-zero transition energy; estimated based on ΔE00 = ((Eabs(max)+Eem(max))/2.
fluorescence quantum yield; quinine sulfate as reference.
Figure 1.

Comparison of the normalized absorption and emission spectra of compounds 1a–j (top) and 2a–j (bottom) in acetonitrile. Absorption spectra are reproduced with dotted lines, emission spectra are shown in solid traces. The shaded areas indicate the tunable range of the excited state energy ΔE00 for each compound series.
Electrochemistry
To evaluate changes in the acceptor potential E(A/A−) of the fluorophore, the second key parameter governing the ET thermodynamics according to eq 4, we determined the half wave potentials for each compound by cyclic voltammetry in acetonitrile and 0.1 M Bu4NPF6 as the electrolyte. As evident from the compilation in Table 2, the acceptor potentials differed significantly between the two series 1 and 2 but showed surprisingly little variation within each series. More specifically, for compounds 1a-j, the average reduction potential was centered around −2.74 ± 0.05 V, while for 2a-j which contain the strongly electron withdrawing cyano group, a less negative potential of −2.21 ± 0.03 V was measured. In both series, the fluoro substituents exerted only a small influence on the reduction potential, an observation that is routed in the special topology of the HOMO and LUMO in this class of fluorophores.7 In contrast, the excited state energy ΔE00 is strongly influenced by the number of fluoro-substituents, making it possible to tune ΔE00 over 0.4 eV while locking in the reduction potential within a narrow range. It is noteworthy that this property allows for the design of two fluorophores with essentially identical excited state energies but with reduction potentials that differ by more than 0.5 V as illustrated with 1b and 2j. Hence, by varying the number and positions of fluoro-substituents, the excited state energy ΔE00 can be gradually adjusted over a broad range without significantly altering the acceptor potential E(A/A−), a remarkable characteristics that might be exploited for the systematic tuning of the ET driving force −ΔGet according to eq 4.
Table 2.
Acceptor Half Wave Reduction Potentials for Pyrazoline Derivatives 1a–1j and 2a–2j in Acetonitrile/0.1 M Bu4NPF6 vs Fc+/0 at 298K.
| compd | E1/2(A/A−) [V] | compd | E1/2(A/A−) [V] |
|---|---|---|---|
| 1a | −2.79 | 2a | −2.26 |
| 1b | −2.78 | 2b | −2.20 |
| 1c | −2.76 | 2c | −2.21 |
| 1d | −2.77 | 2d | −2.24 |
| 1e | −2.75 | 2e | −2.21 |
| 1f | −2.70 | 2f | −2.18 |
| 1g | −2.71 | 2g | −2.16 |
| 1h | −2.69 | 2h | −2.17 |
| 1i | −2.72 | 2i | −2.21 |
| lj | −2.66 | 2j | −2.22 |
Optimizing the Fluorescence Enhancement in PET Sensors
As outlined above, tuning of the ET driving force −ΔGet is pivotal for optimizing the contrast ratio of PET sensors. To explore whether the differential tuning strategy can be used for the latter purpose, we next synthesized a compound series containing a dimethylamino group which serves as the quenching electron donor (Chart 2).21 Protonation of the amino-nitrogen lone pair is expected to sharply increase the donor potential, which in turn should result in a quantum yield increase. Thus, the dimethylamino-substituted compound series serves as a simple pH-responsive PET model system to test the rational design approach. The compound numbering scheme of this series was kept consistent with the first library (Chart 1), although a significantly smaller number of fluoro derivatives were included.
Chart 2.

As evident from the compilation in Table 3, compared to the unsubstituted parent compounds of series 1 and 2, the absorption and emission maxima are not significantly altered by attachment of the dimethylamino group. However, a comparison of the quantum yields in neutral solution revealed significant changes. Notably, the fluorescence of the cyano-substituted compounds 4a-j is almost entirely quenched in the presence of the dimethylamino group. Upon acidification with 10 mM trifluoroacetic acid in acetonitrile, the quantum yields Φf' sharply increased for compounds 4a-j yielding fluorescence enhancement factors of up to 400. Interestingly, the quantum yields of the 3-phenyl substituted derivatives 3a–3e were consistently lower in acidic compared to neutral medium. This unexpected observation might be a result of the strongly electron withdrawing character of the protonated aniline, which may act as an electron acceptor in its protonated form (vide infra).
Table 3.
Photophysical Data of Pyrazoline Derivatives 3 and 4 in Acetonitrile at 298K
| abs λmax[nm] | em λmax[nm] | Stokes shift [cm−1] | ΔE00a [cm−1] | Φ fb | Φ f,c | fed | |
|---|---|---|---|---|---|---|---|
| 3a | 357 | 455 | 6,030 | 24,990 | 0.44 | 0.29 | 0.66 |
| 3b | 344 | 448 | 6,750 | 25,700 | 0.37 | 0.25 | 0.68 |
| 3d | 358 | 458 | 6,100 | 24,880 | 0.45 | 0.22 | 0.49 |
| 3e | 343 | 450 | 6,930 | 25,690 | 0.29 | <0.01 | n.d. |
| 4a | 400 | 508 | 5,320 | 22,340 | 0.014 | 0.49 | 35 |
| 4c | 392 | 488 | 5,020 | 23,000 | 0.0076 | 0.61 | 80 |
| 4d | 396 | 512 | 5,720 | 22,390 | 0.016 | 0.51 | 33 |
| 4f | 379 | 481 | 5,600 | 23,590 | 0.0038 | 0.63 | 166 |
| 4i | 356 | 445 | 5,620 | 25,280 | 0.0033 | 0.71 | 215 |
| 4j | 349 | 446 | 6,230 | 25,540 | 0.0017 | 0.68 | 400 |
Zero-zero transition energy; estimated based on ΔE00 = ((Eabs(max)+Eem(max))/2.
Fluorescence quantum yield in acetonitrile;
Fluorescence quantum yield in 10 mM trifluoroacetic acid in acetonitrile quinine sulfate as reference.
Fluorescence enhancement upon acidification fe = Φf/Φf,.
Electron Transfer Driving Force and Kinetics
Assuming that the reduced quantum yield Φf of the dimethylamino-substituted fluorophores relative to their unsubstituted parent compounds is entirely a consequence of the ET reaction, the ET rate constant ket can be estimated based on eq 2. This approximation implies that the kinetics of all other decay pathways (radiative deactivation, internal conversion, intersystem crossing) remains unchanged upon substitution with the donor group. Solving eq 2 for ket gives then
| (6) |
The excited state deactivation rate constant k0 can be directly obtained from the fluorescence lifetime data τf of the parent compound. Additionally, to estimate the electron transfer driving force −ΔGet according to eq 4, the donor and acceptor half wave potentials ΔE(D+/D) and ΔE(A/A−) as well as the excited state energy ΔE00 for each compound 3–4 were experimentally determined in acetonitrile as the solvent. The Coulomb stabilization energy of the radical ion pair was estimated according to the following equation:
| (7) |
where e stands for the elemental charge, εs for the static dielectric constant, and dDA for the separation between the ion pair. In a polar environment such as acetonitrile, this contribution is relatively small compared to the other parameters. Using an average D-A separation of 8.6 Å for the two compound series 3 and 4, a Coulomb stabilization energy of −0.045 eV was included in estimating ΔGet. Because all photophysical and electrochemical data were acquired in the same solvent, the electrochemical potentials were used without additional solvent stabilization energy corrections. A compilation of all relevant data is provided in Table 4.
Table 4.
Donor and acceptor reduction potentials and electron transfer parameters of compounds 3–4 in acetonitrile at 298K.
| E1/2(D+/D)a [V] | E1/2(A/A−)a [V] | τF [ns]b | k0 [108 s−1]c | E00 [eV]d | ΔGet [eV]e | ket [s−1]f | |
|---|---|---|---|---|---|---|---|
| 3a | 0.38 | −2.89 | 4.29 | 2.33 | 3.09 | 0.13 | 1.1 ×10⁸ |
| 3b | 0.42 | −2.86 | 4.24 | 2.36 | 3.19 | 0.05 | 1.7 ×10⁸ |
| 3d | 0.38 | −2.87 | 4.52 | 2.21 | 3.09 | 0.12 | 7.4 ×10⁷ |
| 3e | 0.43 | −2.82 | 4.43 | 2.26 | 3.20 | 0.02 | 2.0 ×10⁸ |
| 4a | 0.43 | −2.26 | 3.82 | 2.62 | 2.79 | −0.13 | 5.3 ×10⁹ |
| 4c | 0.44 | −2.23 | 3.98 | 2.51 | 2.86 | −0.23 | 2.0 ×10¹⁰ |
| 4d | 0.44 | −2.26 | 3.97 | 2.52 | 2.79 | −0.12 | 7.8 ×10⁹ |
| 4f | 0.45 | −2.21 | 3.99 | 2.51 | 2.93 | −0.31 | 4.1 ×10¹⁰ |
| 4i | 0.49 | −2.23 | 3.09 | 3.24 | 3.15 | −0.46 | 7.7 ×10¹⁰ |
| 4j | 0.47 | −2.18 | 3.03 | 3.30 | 3.19 | −0.56 | 1.4 ×10¹¹ |
Halfwave potential in acetonitrile/0.1 M Bu4NPF6 vs Fc+/0 at 298K.
Fluorescence lifetime of the corresponding reference compound 2 and 3 having the same fluoro-substitution pattern but lacking the dimethylamino donor group. All decay profiles fitted well with a monoexponential kinetics (χ2 < 1.3).
Excited state deactivation rate constant k0 = l/τF.
Zero-zero transition energy; estimated based on ΔE00 = ((Eabs(max)+Eem(max))/2.
Calculated based on Rehm-Weller equation (4) with wp = −0.045 eV.
Electron transfer rate constant calculated based on eq 6.
Given the large difference in reduction potentials, −ΔGet is considerably more favorable for the cyano-substituted compound series 4 compared to series 3. Furthermore, within a series −ΔGet steadily increases with increasing number of fluoro-substituents, thus confirming the ability to tune −ΔGet in a predictable manner by altering the number of fluoro-substituents. The observed trend in −ΔGet directly parallels the electron withdrawing character of the N-aryl ring. For example, due to effective resonance delocalization, a fluoro-substituent in the para-position as in compound 4d is less electron withdrawing compared to the meta-position as in compound 4c, rendering −ΔGet for 4c more favorable compared to 4d. The donor potentials are centered at 0.43 ± 0.03 V and vary only to a small degree across both compound series, an observation that is consistent with preferential oxidation of the electronically decoupled aniline moiety rather than the fluorophore π-system. Additionally, time-resolved fluorescence data in acetonitrile revealed a monoexponential decay kinetics for all reference compounds 2 and 3 with lifetimes ranging between 3 to 4.5 ns (Table 4).
A plot of log ket vs −ΔGet from Table 4 reveals a parabolic relationship with a more than three orders of magnitude increase in the ET rate as a function of the driving force (Figure 2). Nonlinear least-squares fitting of the experimental data with the semiclassical Marcus equation (3) provided the reorganization energy λ = 0.54±0.04 eV and the electronic coupling element HDA = 18 ± 3 cm−1 for the triaryl-substituted pyrazolines. The small values for the reorganization energy and electronic coupling are expected for a D-A system with a rigid spacer and compare well with the ET parameters recently estimated for fluorescein.9
Figure 2.
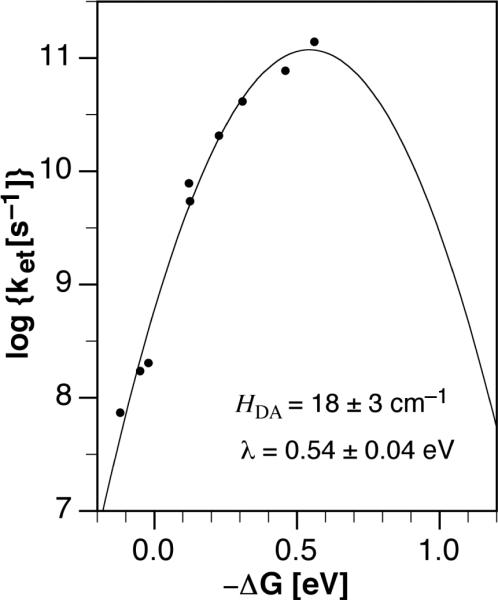
Dependence of the electron transfer rate constant on the driving force −ΔGet in dimethylamino-substituted pyrazolines 3–4. The parabolic curve was obtained through nonlinear least squares fitting of the data according to Marcus equation (3).
Figure 2 indicates that all ET quenching rate constants are located within the normal region of the Marcus parabola for which the driving force −ΔGet is smaller than the reorganization energy λ. The driving force −ΔGet is greatest for 4j which contains a fully fluorinated 1-aryl ring. Because none of the compounds offers a driving force beyond the parabola peak, it remains open whether the Marcus inverted region could be accessed within the framework of donor-substituted triaryl-pyrazolines. Due to the lack of kinetic data with larger driving forces, the ET parameters derived from above curve fit should be considered as estimates with potentially larger uncertainties than implied by the mathematical fit. Nevertheless, the extracted parameters offer still an opportunity to explore some of the boundary conditions for this system. Based on the estimated reorganization energy and electronic coupling matrix element, the maximum ET rate constant ket can be calculated as
| (8) |
The maximum fluorescence enhancement is reached when the ET rate of the protonated form is insignificant compared to the deactivation rate k0. Thus, substituting eq 5 with the maximum fluorescence enhancement can be estimated by
| (9) |
Assuming an average deactivation rate constant of k0 = 2.8 × 10⁸ s−1 and ket = 1.2 × 10¹¹ s−1, the maximum fluorescence enhancement for this class of pyrazoline derivatives is expected to reside around 400.
Despite the fact that the increase in donor potential E(D+/D) upon protonation of the dimethylamino group is expected to be similar for all compounds, the fluorescence enhancement varies widely within the two compound series and strongly depends on the ET driving force. For smaller −ΔGet values, the quenching efficiency is lower which results in an increased quantum yield of the PET sensor and therefore a smaller fluorescence enhancement under neutral conditions. The experimental data imply that for a given change in donor potential ΔE(D+/D) upon binding of the analyte, in this case a simple protonation, the optimal fluorescence enhancement requires a matching ET driving force −ΔGet. Assuming that the change in ET rate is predominantly caused by an increase in donor potential (ΔE(D+/D)), thus neglecting differences in reorganization energy λ and electronic coupling HDA, the relationship between ΔE(D+/D) and the ET driving force −ΔGet in the absence of an analyte can be expressed through eq 3 and 5, yielding
| (10) |
Rewriting eq 10 allows for the expression of ΔE(D+/D) as a function of the fluorescence enhancement fe and the ET driving force −ΔGet of the analyte-free PET sensor:
| (11) |
Thus, eq 11 shows the specific change in donor potential ΔE(D+/D) required to achieve a certain fluorescence enhancement fe based on the ET driving force −ΔGet of the quenched sensor in the absence of an analyte. Conversely, if ΔE(D+/D) is known, the relationship indicates what ET driving force would offer an optimal fluorescence enhancement. A contourplot of the function in eq 11 for various enhancement factors fe using the previously estimated experimental ET parameters graphically illustrates this relationship (Figure 3). Because potentially significant changes in the solvent reorganization energy were not taken into account, the following interpretations should be viewed as estimates within the simplified framework of eq 11. With small potential changes (< 0.1 V), a relatively broad range of ET driving forces leads already to a 2–5 fold fluorescence enhancement. Larger fluorescence enhancements require not only a greater change in donor potential, but gradually decrease the range of tolerated ET driving forces. For practical purposes, a fluorescence enhancement factor of at least 50 is desirable. To achieve this enhancement, a change of approximately 0.3 V in the donor potential would be required upon binding of the analyte as indicated by Figure 3. Furthermore, a comparison with the experimental data of the cyano-substituted compounds series listed in Table 3 and 4 shows that the fluorescence enhancement factor steadily increases with increasing ET driving force as also implied by Figure 3. Despite the fact that protonation of the aniline nitrogen is expected to yield a similarly large ΔE(D+/D) for all compounds, the fluorescence enhancement factors vary over more than two orders of magnitude, underscoring the importance of tuning the ET driving force. To achieve the optimal fluorescence enhancement, the ET driving force must be adjusted within a narrow range centered around 0.55±0.06 eV. In summary, the contourplot of Figure 3 outlines a generalized strategy for optimizing the fluorescence enhancement of triarylpyrazoline-based PET sensors. By systematically increasing the number of fluoro-substituents attached to the 1-aryl ring, the ET driving force can be gradually increased until the maximum contrast enhancement is achieved. Driving forces beyond the optimal point should be avoided as they would lead to a reduced contrast ratio and quantum yield.
Figure 3.
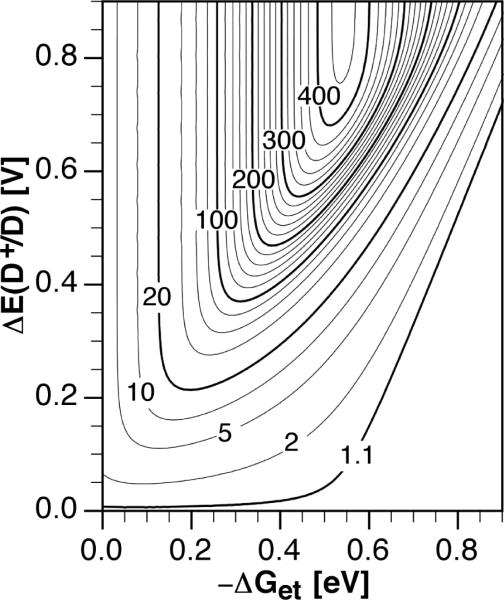
Contourplot of the fluorescence enhancement factor fe as a function of the ET driving force and change in donor potential ΔE(D+/D) calculated according to eq 11. For fe between 20 and 420 contourlines are drawn in intervals of 20. Variables: k0 = 2.8 × 10⁸ s−1, HDA = 18 cm−1, λ = 0.54 eV, T = 298 K.
Quantum Chemical Calculations
The impetus for performing computational studies was two-fold: the experimental data of the compound series 1 and 2 offered a valuable framework to gauge the ability of quantum chemical methods for predicting two of the ET key parameters, the acceptor potential E(A/A−) and the excited state energy ΔE00, by means of linear free energy relationships (LFER). In addition, we hoped to gain insights into the unexpected reduction of the quantum yield upon protonation of derivatives 3.
Reduction Potentials
The half wave acceptor potential E(A/A−) for the one-electron reduction of the fluorophore is related to its gas phase adiabatic electron affinity AEA according to the following relationship:
| (12) |
where ΔΔGsol is the energy difference between the neutral and reduced molecule in the gas phase and in solution, and Eref is the potential of the reference electrode.22 The implicit prediction of standard reduction potentials is in principle possible on the basis of ab initio molecular orbital theory or density functional theory to calculate AEA in combination with a solvation model that accounts for ΔΔGsol.23 Because the latter is expected to vary within a narrow range for molecules with a similar degree of charge delocalization,24 solution reduction potentials can be directly correlated with gas phase electron affinities through a simple LFER.25 Given the uniform molecular architecture of the triaryl-pyrazoline compound library, we deemed that this approach should be well suited for correlating the experimental redox potentials with computational data. Using density functional theory, adiabatic gas phase EAs were calculated as the difference between the total energies of the geometry optimized anionic and charge-neutral fluorophores. We are aware that DFT typically yields positive anion HOMO energies, thereby implying instability towards electron detachment;26 however, numerous detailed studies have concluded that despite the presence of positive HOMO energies of the anion, DFT can indeed provide reasonable estimates of molecular EAs.27 The electronic energies were corrected with the respective scaled harmonic zero-point vibrational energies (ZPVE).18 To evaluate effects of the basis set size on the linear regression, the total energies were computed at the B3LYP/6-31+G(d) and B3LYP/6-311+G(2d,2p) levels of theory. In all cases, ZPVE corrections were obtained from frequency calculations of geometries optimized at the B3LYP/6-31+G(d) level. A list of the relevant computational results is given in Table 5, and selected regression analyses are shown in Figure 4.
Table 5.
Computed gas phase LUMO energies, adiabatic electron affinities, reduction potentials, and excited state energies for pyrazoline fluorophores 1a–j and 2a–j.
| LUMO Energy [eV]a | Adiabatic EA [eV]a | Reduction Potential [V] | S1 Energy [eV] | ||||||
|---|---|---|---|---|---|---|---|---|---|
| compd | HF/6-311+G(2d,2p) | B3LYP/6-31+G(d) | B3LYP/6-311+G(2d,2p) | B3LYP/6-31+G(d) | B3LYP/6-311+G(2d,2p) | SM5.42Rb B3LYP/6-311+G(2d,2p) | Exp.c | TD-DFT B3LYP/6-311+G(2d,2p) | Exp.d |
| 1a | 1.47 | −1.47 | −1.50 | 0.45 | 0.49 | −2.79 | −2.79 | 3.41 | 3.09 |
| 1b | 1.54 | −1.51 | −1.61 | 0.51 | 0.55 | −2.76 | −2.78 | 3.50 | 3.19 |
| 1c | 1.45 | −1.59 | −1.66 | 0.58 | 0.61 | −2.78 | −2.76 | 3.46 | 3.17 |
| 1d | 1.42 | −1.55 | −1.63 | 0.53 | 0.57 | −2.81 | −2.77 | 3.43 | 3.09 |
| 1e | 1.48 | −1.60 | −1.69 | 0.59 | 0.61 | −2.80 | −2.75 | 3.49 | 3.20 |
| 1f | 1.49 | −1.66 | −1.74 | 0.65 | 0.67 | −2.71 | −2.70 | 3.52 | 3.23 |
| 1g | 1.38 | −1.71 | −1.80 | 0.69 | 0.71 | −2.75 | −2.71 | 3.54 | 3.24 |
| 1h | 1.43 | −1.73 | −1.80 | 0.72 | 0.74 | −2.76 | −2.69 | 3.49 | 3.22 |
| 1i | 1.46 | −1.64 | −1.71 | 0.65 | 0.67 | −2.83 | −2.72 | 3.77 | 3.46 |
| 1j | 1.39 | −1.68 | −1.74 | 0.73 | 0.70 | - | −2.66 | 3.79 | 3.51 |
| 2a | 1.02 | −2.26 | −2.34 | 1.19 | 1.23 | −2.34 | −2.26 | 3.11 | 2.79 |
| 2b | 1.02 | −2.28 | −2.37 | 1.24 | 1.28 | −2.34 | −2.20 | 3.23 | 2.89 |
| 2c | 0.91 | −2.37 | −2.45 | 1.30 | 1.34 | −2.33 | −2.21 | 3.15 | 2.86 |
| 2d | 0.94 | −2.33 | −2.40 | 1.26 | 1.30 | −2.36 | −2.24 | 3.10 | 2.79 |
| 2e | 0.94 | −2.35 | −2.42 | 1.31 | 1.34 | −2.36 | −2.21 | 3.23 | 2.91 |
| 2f | 0.90 | −2.41 | −2.48 | 1.36 | 1.40 | −2.26 | −2.18 | 3.25 | 2.93 |
| 2g | 0.82 | −2.48 | −2.56 | 1.41 | 1.44 | −2.29 | −2.16 | 3.21 | 2.93 |
| 2h | 0.84 | −2.46 | −2.53 | 1.42 | 1.45 | −2.29 | −2.17 | 3.25 | 2.94 |
| 2i | 0.95 | −2.39 | −2.48 | 1.34 | 1.37 | −2.28 | −2.21 | 3.49 | 3.15 |
| 2j | 0.91 | −2.43 | −2.50 | 1.39 | 1.41 | −2.34 | −2.22 | 3.51 | 3.19 |
| linear regressione | |||||||||
| slopee | −0.977 | −0.681 | −0.677 | 0.723 | 0.717 | 1.15 | 1.022 | ||
| intercepte | −1.309 | −3.827 | −3.870 | −3.168 | −3.182 | 0.469 | −0.382 | ||
| Re | 0.987 | 0.988 | 0.993 | 0.993 | 0.995 | 0.992 | 0.995 | ||
| MUEf | 0.034 | 0.022 | 0.024 | 0.026 | 0.021 | 0.029 | 0.026 | ||
at B3LYP/6-31+G(d) geometry.
according to eq 12. ΔΔG calculated based on SM5.42R/AM1 solvent model;28 adiabatic EA at B3LYP/6-311+G(2d,2p)//B3LYP/6-31+G(d) level of theory.
E1/2 reduction potentials vs Fc/Fc+ in CH3CN, 0.1 M Bu4NPF6, 298 K.
excited state energy ΔE00 (Table 1).
regression analysis of computed vs. experimental data.
mean unsigned error.
Figure 4.

Linear free energy relationships (LFER) between selected computational and experimental data for compounds 1–2. a) Correlation of the gas phase adiabatic electron affinity with experimental solution phase reduction potentials. b) Correlation of the vertical excitation energy of the lowest excited singlet state S1 based on TD-DFT with the experimental excited state energies. c) Correlation between computed data according to the LFER of eq 13 and the experimental data. The computational data were calculated at the B3LYP/6-311+G(2d,2p)//B3LYP/6-31+G(d) level of theory. Slope, intercept, and MUE for all correlations are listed in Table 5.
As illustrated with Figure 4a, the adiabatic EAs computed with the larger basis set at the B3LYP/6-311+G(2d,2p) level correlated well with the experimental reduction potentials. Linear regression analysis yielded a mean unsigned error (MUE) of 0.02 eV and a good correlation coefficient of 0.995. Using the less expensive basis set 6-31+G(d), the EAs were estimated to be slightly smaller across all compounds; however, the linear regression yielded a similarly good fit with a correlation coefficient of 0.993 and MUE of 0.03 eV. In both cases, however, the slope deviated considerably from unity, which may reflect either poor performance of DFT for modeling the AEAs, or perhaps differences in solvation energies that are not captured by this approach. To further explore the latter possibility, we estimated the differential solvent stabilization energy ΔΔG based on the semi-empirical solvation model SM5.42R/AM1 developed by Cramer, Truhlar, and coworkers.28 This model was parameterized to yield accurate solvation free energies at DFT gas-phase solute geometries. The values listed in Table 5 were thus computed from geometries optimized at the B3LYP/6-311+G(2d,2p) level of theory. The reduction potentials were calculated relative to the potential Eref(Fc+/0) of the ferrocenium cation in acetonitrile according to eq 12. To obtain Eref(Fc+/0) in acetonitrile, we selected a value of 4.52 V for SHE as recommended by Cramer and Truhlar for nonaqueous solution29 and added 0.624 V for conversion to the Fc+/0 reference,30 which gives a reference potential of 5.14 V. The reduction potentials computed by this approach agreed well with the experimental values, yielding a MUE of 0.029 V, a good correlation coefficient of 0.992, and a slope that is closer to unity compared to the previous AEA gas-phase correlation. Inspection of the computed differential solvent stabilization energies reveals a steady decrease across both compound series by approximately 0.2 eV (Supporting Information), which is presumably due to the poorer solvation of the anion with an increasing degree of fluorine substitution.
In principle, the LUMO energies of the neutral species should also reflect differences in electron affinities, thus offering a simple approach for correlating the experimental reduction potentials with computational data. Linear regression analysis indeed yielded surprisingly good correlations for both basis sets with MUEs at 0.024 V and 0.026V and a correlation coefficient of 0.993.
Excited State Energies
The second key parameter that governs the photoinduced electron transfer thermodynamics is the excited state energy ΔE00, which corresponds to the energy difference between the geometry-optimized ground and lowest excited states corrected by the corresponding ZPVEs. While the computation of vertical excited state energies is possible within 0.1–0.2 eV accuracy using time-dependent density functional theory (TD-DFT), the estimation of ΔE00 relies on excited state geometries which are difficult to obtain with reliable accuracy. Given this limitation, we again applied a simple LFER for correlating the experimental ΔE00 energies with the TD-DFT vertical excitation energies based on ground-state geometries. As shown in Figure 4b, linear regression analysis between the experimental and computational data yielded a slope close to unity with a good correlation coefficient of 0.989 and MUE of 0.026 eV.
Finally, to estimate the electron transfer driving force for a given donor potential E(D+/D), the empirical LFER for the reduction potential and excited state energy can be also combined in a single correlation, giving the empirical relationship
| (13) |
where AEA is the adiabatic electron affinity computed at the B3LYP/6-311+G(2d,2p)// B3LYP/6-31+G(d) level, and S1 is the vertical excitation energy obtained from TD-DFT at the same level of theory.
A plot of the computed LFER data against the experimental values yielded an overall good correlation with r = 0.991 and MUE = 0.023 eV (Figure 4c). While we have not tested the accuracy of the correlation with compounds that were not used in the LFER, the computational data closely reflect the experimental trends over the entire set of 20 fluorophores. Hence, on the basis of computed AEA and S1, it should be possible to prescreen pyrazoline fluorophores with various substituent combinations and ultimately identify those candidates whose electron transfer parameters would match best a given donor potential for an optimal contrast enhancement.
Oxidative Electron Transfer
As previously mentioned, compounds 3a, 3b and 3d do not exhibit an increase but rather a decrease in quantum yield upon acidification. Protonation mutates the aniline functionality into a strong σ-acceptor that might potentially trigger an oxidative rather reductive electron transfer from the fluorophore. To explore this hypothesis, we performed gas-phase TD-DFT calculations of fluorophores 3a and 4a in the neutral and protonated state. Figure 5 illustrates the energy ordering of the three lowest excited states for each species.
Figure 5.

Gas-phase excited state manifold of pyrazoline fluorophore 3a (a) and 4a (b) under neutral conditions (left) and upon protonation with trifluoroacetic acid (right) (TD-DFT calculations at B3LYP/6-311+G(2d,2p)//B3LYP(6-31+(d) level of theory). Detachment (blue) and attachment (red) density plots are shown next to the energy level of each state. States with significant oscillator strength are marked with bold lines.
To visualize the nature of each state, electron detachment and attachment densities31 were plotted next to the corresponding energy levels. In case of neutral fluorophore 3a, an emissive state with charge transfer character resides at the lowest level followed by an ET state involving the aniline moiety as the electron donor (Figure 5a). In agreement with the measured quantum yield of 0.44 (Table 3), the energetically higher lying ET state is poorly accessible for non-radiative deactivation. For neutral fluorophore 4a the energy ordering is reversed (Figure 5b). Consistent with the measured quantum yield of 0.014 (Table 3), the ET state lies below the charge transfer state, thus offering an energetically accessible non-radiative deactivation channel. Upon protonation of the aniline nitrogen, two states with ET character appear now also below the charge transfer state of fluorophore 3a but not of 4a. The detachment/attachment densities indicate that both of these states involve an oxidative electron transfer from the fluorophore to the aniline moiety, which now acts as an electron acceptor rather than a donor. Whereas two states with analogous character are also observed for fluorophore 4a, both of them reside at significantly higher energy compared to the lowest emissive charge transfer state and therefore are not expected to contribute significantly to non-radiative deactivation. Consistent with this model, fluorescence emission is switched on upon protonation of 4a, but reduced in case of 3a. While the gas-phase calculations are not expected to quantitatively model the excited state levels in solution, the results qualitatively support an oxidative electron transfer from the fluorophore π-system to the aniline cation upon protonation of 3a.
Conclusions
Owing to their unusual electronic structure, 1,3,5-triaryl-pyrazolines offer the opportunity to differentially tune two of the key parameters that govern the PET thermodynamics, the excited state energy ΔE00 and the acceptor potential E(A/A−). By varying the number and attachment positions of fluoro-substituents, ΔE00 can be adjusted over a broad range without significantly altering the acceptor potential E(A/A−). Based on this strategy, the ET driving force can be predictably tuned to match the donor potential E(D+/D) of a given cation receptor, and thus employed to optimize the contrast ratio of the sensor response. The experimentally measured D-A coupling and reorganization energy may be used to define an approximate potential map for finding the optimal ET driving force. Furthermore, semi-empirical LFER correlations offer a useful tool to estimate the acceptor potential, excited state energy, and ET driving force with a mean unsigned error of 0.03 eV, and thus to computationally prescreen substituent patterns for their suitability prior to actually synthesizing the corresponding fluorophores. The current LFER training set has been calibrated in acetonitrile and is limited in size; however, it could be certainly expanded to different solvent systems including a broader substituent coverage. The differential tuning ability of the ET parameters in triaryl-pyrazoline fluorophores is a direct consequence of the spatial separation of the HOMO and LUMO densities while still providing sufficient overlap and therefore a substantial absorption cross section. It is conceivable that the outlined rational design strategy could be applied to other fluorophore platforms that exhibit similar spatial separations of the HOMO and LUMO densities.32
Supplementary Material
Acknowledgment
This paper is dedicated to Prof. Andreas Pfaltz on the occasion of his 60th birthday. Financial support from the National Institutes of Health (R01GM067169) is gratefully acknowledged. Computations were supported by the Center for Computational Molecular Science and Technology at the Georgia Institute of Technology and under National Science Foundation CRIF Award CHE-0443564. We thank David Bostwick for mass spectral data, and Reagan McRae for a critical review of the manuscript.
Footnotes
Supporting Information Available: Synthesis and characterization of derivatives 1–4, complete reference 15, and additional information as mentioned in the text are available free of charge via the Internet at http://pubs.acs.org.
References
- (1).Lavis LD, Raines RT. ACS Chem. Biol. 2008;3:142–155. doi: 10.1021/cb700248m. [DOI] [PMC free article] [PubMed] [Google Scholar]
- (2).Domaille DW, Que EL, Chang CJ. Nat. Chem. Biol. 2008;4:168–175. doi: 10.1038/nchembio.69. [DOI] [PubMed] [Google Scholar]
- (3).Rurack K. Spectrochim. Acta A. 2001;57:2161–2195. doi: 10.1016/s1386-1425(01)00492-9. [DOI] [PubMed] [Google Scholar]
- (4).Kavarnos S. In: Topics in Current Chemistry: Photoinduced Electron Transfer I. Mattay J, editor. Vol. 156. Springer-Verlag; Berlin Heidelberg: 1990. pp. 21–58. [Google Scholar]
- (5).Kollmannsberger M, Rurack K, Resch-Genger U, Rettig W, Daub J. Chem. Phys. Lett. 2000;329:363–369. [Google Scholar]; Tanaka K. J. Am. Chem. Soc. 2001;123:2530–2536. doi: 10.1021/ja0035708. [DOI] [PubMed] [Google Scholar]; Hirano T, Kikuchi K, Urano Y, Nagano T. J. Am. Chem. Soc. 2002;124:6555–6562. doi: 10.1021/ja025567p. [DOI] [PubMed] [Google Scholar]; Onoda M, Uchiyama S, Santa T, Imai K. Anal. Chem. 2002;74:4089–4096. doi: 10.1021/ac0201225. [DOI] [PubMed] [Google Scholar]; Gabe Y, Urano Y, Kikuchi K, Kojima H, Nagano T. J. Am. Chem. Soc. 2004;126:3357–3367. doi: 10.1021/ja037944j. [DOI] [PubMed] [Google Scholar]; Ueno T, Urano Y, Setsukinai K, Takakusa H, Kojima H, Kikuchi K, Ohkubo K, Fukuzumi S, Nagano T. J. Am. Chem. Soc. 2004;126:14079–14085. doi: 10.1021/ja048241k. [DOI] [PubMed] [Google Scholar]; Urano Y, Kamiya M, Kanda K, Ueno T, Hirose K, Nagano T. J. Am. Chem. Soc. 2005;127:4888–4894. doi: 10.1021/ja043919h. [DOI] [PubMed] [Google Scholar]; Mottram LF, Boonyarattanakalin S, Kovel RE, Peterson BR. Org. Lett. 2006;8:581–584. doi: 10.1021/ol052655g. [DOI] [PMC free article] [PubMed] [Google Scholar]; Gabe Y, Ueno T, Urano Y, Kojima H, Nagano T. Anal. Bioanal. Chem. 2006;386:621–626. doi: 10.1007/s00216-006-0587-y. [DOI] [PubMed] [Google Scholar]; Terai T, Kikuchi K, Iwasawa SY, Kawabe T, Hirata Y, Urano Y, Nagano T. J. Am. Chem. Soc. 2006;128:6938–6946. doi: 10.1021/ja060729t. [DOI] [PubMed] [Google Scholar]; Ueno T, Urano Y, Kojima H, Nagano T. J. Am. Chem. Soc. 2006;128:10640–10641. doi: 10.1021/ja061972v. [DOI] [PubMed] [Google Scholar]; Kobayashi T, Urano Y, Kamiya M, Ueno T, Kojima H, Nagano T. J. Am. Chem. Soc. 2007;129:6696–6697. doi: 10.1021/ja070376d. [DOI] [PubMed] [Google Scholar]; Sunahara H, Urano Y, Kojima H, Nagano T. J. Am. Chem. Soc. 2007;129:5597–5604. doi: 10.1021/ja068551y. [DOI] [PubMed] [Google Scholar]; Yogo T, Urano Y, Mizushima A, Sunahara H, Inoue T, Hirose K, Iino M, Kikuchi K, Nagano T. Proc. Natl. Acad. Sci. U.S.A. 2008;105:28–32. doi: 10.1073/pnas.0611717105. [DOI] [PMC free article] [PubMed] [Google Scholar]
- (6).Rurack K, Bricks JL, Schulz B, Maus M, Reck G, Resch-Genger U. J. Phys. Chem. A. 2000;104:6171–6188. [Google Scholar]
- (7).Fahrni CJ, Yang LC, VanDerveer DG. J. Am. Chem. Soc. 2003;125:3799–3812. doi: 10.1021/ja028266o. [DOI] [PubMed] [Google Scholar]
- (8).Valeur B. Molecular Fluorescence. Wiley-VCH; Weinheim: 2006. [Google Scholar]
- (9).Miura T, Urano Y, Tanaka K, Nagano T, Ohkubo K, Fukuzumi S. J. Am. Chem. Soc. 2003;125:8666–8671. doi: 10.1021/ja035282s. [DOI] [PubMed] [Google Scholar]
- (10).Closs GL, Miller JR. Science. 1988;240:440–447. doi: 10.1126/science.240.4851.440. [DOI] [PubMed] [Google Scholar]; Marcus RA, Sutin N. Biochim. Biophys. Acta. 1985;811:265–322. [Google Scholar]
- (11).Rehm D, Weller A. Isr. J. Chem. 1970;8:259–71. [Google Scholar]
- (12).Rurack K, Bricks JL, Kachkovski A, Resch U. J. Fluoresc. 1997;7:63S–66S. [Google Scholar]; Rurack K, Resch-Genger U, Bricks JL, Spieles M. Chem. Commun. 2000:2103–2104. [Google Scholar]; Yang LC, McRae R, Henary MM, Patel R, Lai B, Vogt S, Fahrni CJ. Proc. Natl. Acad. Sci. U.S.A. 2005;102:11179–11184. doi: 10.1073/pnas.0406547102. [DOI] [PMC free article] [PubMed] [Google Scholar]; de Silva AP, Nimal Gunaratne HQ. Chem. Commun. 1990:186–8. [Google Scholar]; de Silva AP, Gunaratne HQN, Maguire GEM. Chem. Commun. 1994:1213–14. [Google Scholar]
- (13).Rivett DE, Rosevear J, J.F.K. Aust. J. Chem. 1983;36:1649. [Google Scholar]
- (14).Demas JN, Crosby GA. J. Phys. Chem. 1971;75:991–1024. [Google Scholar]
- (15).Shao Y, et al. Phys. Chem. Chem. Phys. 2006;8:3172–3191. doi: 10.1039/b517914a. [DOI] [PubMed] [Google Scholar]
- (16).Becke AD. J. Chem. Phys. 1993;98:5648–5652. [Google Scholar]; Lee CT, Yang WT, Parr RG. Phys. Rev. B. 1988;37:785–789. doi: 10.1103/physrevb.37.785. [DOI] [PubMed] [Google Scholar]
- (17).Foces-Foces C, Jagerovic N, Elguero J. Z. Kristallogr. 2001;216:240–244. [Google Scholar]
- (18).Scott AP, Radom L. J. Phys. Chem. 1996;100:16502–16513. [Google Scholar]
- (19).Stratmann RE, Scuseria GE, Frisch MJ. J. Chem. Phys. 1998;109:8218–8224. [Google Scholar]
- (20).Humphrey W, Dalke A, Schulten K. J. Mol. Graph. 1996;14:33–&. doi: 10.1016/0263-7855(96)00018-5. [DOI] [PubMed] [Google Scholar]
- (21).Rurack K, Bricks JL. ARKIVOC (Gainesville, FL, U. S.) 2001:31–40. [Google Scholar]
- (22).Shalev H, Evans DH. J. Am. Chem. Soc. 1989;111:2667–2674. [Google Scholar]
- (23).Namazian M, Coote ML. J. Phys. Chem. A. 2007;111:7227–7232. doi: 10.1021/jp0725883. [DOI] [PubMed] [Google Scholar]
- (24).Ruoff RS, Kadish KM, Boulas P, Chen ECM. J. Phys. Chem. 1995;99:8843–8850. [Google Scholar]
- (25).Winget P, Cramer CJ, Truhlar DG. Theor. Chem. Acc. 2004;112:217–227. [Google Scholar]; Winget P, Weber EJ, Cramer CJ, Truhlar DG. Phys. Chem. Chem. Phys. 2000;2:1231–1239. [Google Scholar]
- (26).Rienstra-Kiracofe JC, Tschumper GS, Schaefer HF, Nandi S, Ellison GB. Chem. Rev. 2002;102:231–282. doi: 10.1021/cr990044u. [DOI] [PubMed] [Google Scholar]; Galbraith JM, Schaefer HF. J. Chem. Phys. 1996;105:862–864. [Google Scholar]
- (27).Rosch N, Trickey SB. J. Chem. Phys. 1997;106:8940–8941. [Google Scholar]
- (28).Li JB, Zhu TH, Hawkins GD, Winget P, Liotard DA, Cramer CJ, Truhlar DG. Theor. Chem. Acc. 1999;103:9–63. [Google Scholar]
- (29).Kelly CP, Cramer CJ, Truhlar DG. J. Phys. Chem. B. 2007;111:408–422. doi: 10.1021/jp065403l. [DOI] [PMC free article] [PubMed] [Google Scholar]
- (30).Pavlishchuk VV, Addison AW. Inorg. Chim. Acta. 2000;298:97–102. [Google Scholar]
- (31).Head-Gordon M, Grana AM, Maurice D, White CA. J. Phys. Chem. 1995;99:14261–14270. [Google Scholar]
- (32).Zucchero AJ, Wilson JN, Bunz UHF. J. Am. Chem. Soc. 2006;128:11872–11881. doi: 10.1021/ja061112e. [DOI] [PubMed] [Google Scholar]
Associated Data
This section collects any data citations, data availability statements, or supplementary materials included in this article.