Abstract
A full-bandwidth k-domain linearization method for spectral-domain optical coherence tomography (SD-OCT) is demonstrated. The method uses information of the wavenumber–pixel-position provided by a translating-slit-based wavelength filter. For calibration purposes, the filter is placed either after a broadband source or at the end of the sample path, and the filtered spectrum with a narrowed line width (~0.5 nm) is incident on a line-scan camera in the detection path. The wavelength-swept spectra are co-registered with the pixel positions according to their central wavelengths, which can be automatically measured with an optical spectrum analyzer. For imaging, the method does not require a filter or a software recalibration algorithm; it simply resamples the OCT signal from the detector array without employing rescaling or interpolation methods. The accuracy of k-linearization is maximized by increasing the k-linearization order, which is known to be a crucial parameter for maintaining a narrow point-spread function (PSF) width at increasing depths. The broadening effect is studied by changing the k-linearization order by undersampling to search for the optimal value. The system provides more position information, surpassing the optimum without compromising the imaging speed. The proposed full-range k-domain linearization method can be applied to SD-OCT systems to simplify their hardware/software, increase their speed, and improve the axial image resolution. The experimentally measured width of PSF in air has an FWHM of 8 μm at the edge of the axial measurement range. At an imaging depth of 2.5 mm, the sensitivity of the full-range calibration case drops less than 10 dB compared with the uncompensated case.
1. Introduction
Optical coherence tomography (OCT) is a noncontact and noninvasive high-resolution technique for imaging [1–3]. It has a wide range of applications in biomedical imaging [4,5]. The earliest implementations of OCT used low-coherence interferometry with time-domain (TD) detection in which the echo delay of backscattered light was measured by mechanically sweeping a mirror in a reference arm. However, the imaging speeds for OCT achieved by standard TD detection techniques are very limited [6,7]. In spectral-domain OCT (SD-OCT), depth-resolved information is encoded in the cross-spectral density function, as measured by the detection arm of an interferometer. The mechanical A-scan has been eliminated by employing a wavelength-resolving detection scheme using a high-speed spectrometer. SD-OCT detects the wavelength-resolved interference signal using a spectrometer consisting of a diffraction grating, a focusing lens, and a detector array or a line-scan camera [8].
One of the drawbacks of SD-OCT is the broadening of the point-spread function (PSF) with increasing imaging depth. If the linear relationship between the wavenumber and the pixel position is not maintained, the PSF becomes distorted and broadened, and this has a negative effect on the resolution of the system as a whole. The other drawback of nonlinearity is caused by the limited spectral resolution compromising the effective field of view in the axial direction and may induce artifacts to complicate diagnostic sensitivity and specificity. Therefore, accurate spectral calibration is one of the key elements for obtaining accurate biological tissue cross-sectional images using SD-OCT.
Numerous calibration methods for SD-OCT have been reported [9–13]. The characteristic wavelength method and spectral interferogram mapping method are commonly used [9,10]. The first method provides insufficiently sampled wavelength information. The second one also has some drawbacks, such as requiring an additional Fabry–Perot interferometer and additional signal processing to compensate for nonlinearity [11]. Another possible method is to place a customized prism in the spectrometer [12,13]. This method, however, requires careful design of the prism, which is often costly. The degree of linearity is also limited by the perfection of the prism design, manufacturing, and optical alignment.
In this paper, we describe what is, to our knowledge, a novel and fast spectral calibration and rescaling method that uses information from all the pixels in the array. We describe the experimental setup for a full-range calibration method for SD-OCT and demonstrate the enhanced signal-to-noise ratio (SNR) and constant PSF width with increasing depth. This paper also addresses the minimum pixel-position–wavenumber information required for reasonable PSF enhancement.
2. Experiment Setup and Principle
Figure 1 is a schematic diagram of SD-OCT using the full-range calibration method. The SD-OCT system is based on a Michelson interferometer using fiber optics. The light emitted by a superluminescent diode (SLD) (λc = 830 nm, Δλ = 70 nm, Superlum, Ireland) is split by a 50:50 fiber coupler into reference and sample arms. The detection arm consists of a spectrometer containing a collimator, a volume holographic diffraction grating (1800 lines/mm, Wasatch Photonics, USA), and an achromatic doublet lens. The spectral interference fringes are captured by a 12 bit line-scan CMOS camera with 2048 pixels (Sprint spL2048-140k; Basler Vision Technologies, Germany) and a frame grabber (PCIe-1429; National Instruments, USA). Transverse scanning is achieved by two galvanometer-based optical scanners (Cambridge Technology, USA). The scanners are driven by an analog input/output card (PCI-6731; National Instruments, USA). The imaging depth was found to be 4.0 mm in air using a mirror in the sample arm.
Fig. 1.
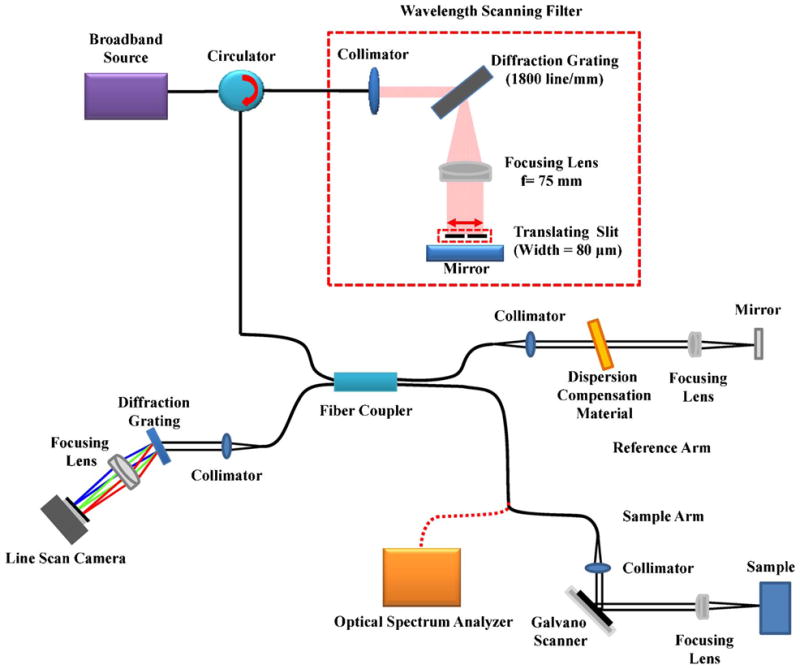
(Color online) Experimental setup for SD-OCT using the full-range calibration method.
The wavelength-scanning filter selects narrow-bandwidth light from the broadband spectrum using a slit. By translating the slit, the central wavelength of the filtered light can be scanned over the entire spectral range. After the filter, light passes to a spectrometer and an optical spectrum analyzer (OSA) though a fiber coupler. The filtered light activates a specific pixel owing to the limited bandwidth and the OSA provides the wavelength information of the spectrum. The wavelength filter consists of a collimator, a transmission-type diffraction grating (1800 lines/mm), a focusing lens (f = 75 mm), a movable optical slit (width = 80 μm) mounted on a translation stage, and a reflective mirror.
Wavelength selection is performed in the following manner. When the light is generated by the broadband source, it enters the first of three connection ports of the optical circulator. The light exits the circulator at the second port and enters the open-air wavelength filter. When the light is collimated by a lens, it strikes the transmission grating, which angularly separates the light in space. As a result, light diffracts at an angle depending on the wavelength. Another focusing lens is inserted after the transmission grating and placed at the back focal plane of the lens. After passing through the focusing lens, the light is spectrally collimated in the horizontal direction but converges vertically. Note that the direction of the grooves in the grating is vertical so that the grating diffracts the incident light horizontally and the light remains collimated vertically. A slit and a mirror are inserted at the focal plane of the focusing lens. The slit and mirror are positioned as close as the geometry permits. When the spectrally dispersed, horizontally distributed light reaches the slit, only a small spectral band of the light can pass through the slit. The wavelength of the transmitting light is dependent on the horizontal position of the slit. As the slit translates along the horizontal direction, a specific wavelength can be scanned for the entire spectral range. It should be noted that the slit and mirror consistently remain on the focal plane of the focusing lens during the scan. While the wavelength selection is performed in the horizontal direction, the light passing through the slit vertically focuses at the mirror so that the coupling ratio of the power back to the interferometer is maximized. After reflecting from the mirror, the light in the vertical view collimates again after the focusing lens and converges in the horizontal view.
Finally, after the transmission grating, the light in both views is collimated and coupled back to the optical fiber through the collimator. As mentioned above, the optical fiber is connected to the second port of the optical circulator. Now the light exits the circulator at the third port instead of passing to the first port. The third port is connected to one arm of a 50:50 optical fiber coupler. The wavelength-scanning filter is located either after a broadband source or at the end of the sample path, and returns a filtered spectrum with a narrowed line-width (~0.5 nm) to the line-scanning camera in the detection path. The wavelength-scanning spectra are coregistered with the pixel positions according to their central wavelengths, which can be automatically measured with an OSA. The k-linear pattern is generated using the start and end wavelengths of the spectrum. By finding the pixel positions from the measured spectrum that match the k-linearized pixels, a lookup table can be generated that is later used to linearize the measured spectrum in the k-domain. Therefore, no additional fitting algorithm is necessary during image acquisition and display, resulting in a higher image display speed.
3. Experiment Results
Figure 2 shows the wavenumber distributions on the line-scan camera. Figure 2A shows the relationship between the measured wavenumber and the pixel position. Figure 2B shows a magnified plot of the dotted box. The blue curve shows the measured wavenumber–pixel-position information using a wavelength scanning filter and the red curve shows the k-domain linear curve fitting using the start and end wavenumbers. From the results, it is seen that the practical wavenumber spacing between the pixel positions is no longer linear owing to the diffraction grating. We used the closest method for a k-linear pattern by selecting the closest value between the measured wavenumber and the k-linear wavenumber.
Fig. 2.
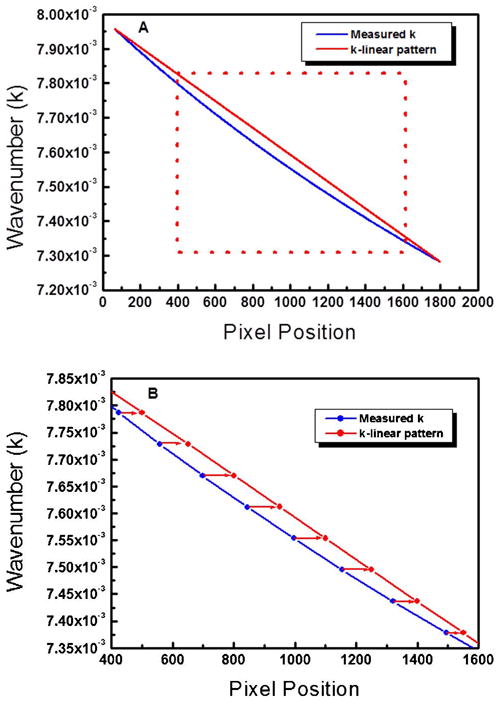
(Color online) A, wavenumber graph of the measured spectrum compared with the k-linear pattern. B, magnified plot of the dotted box.
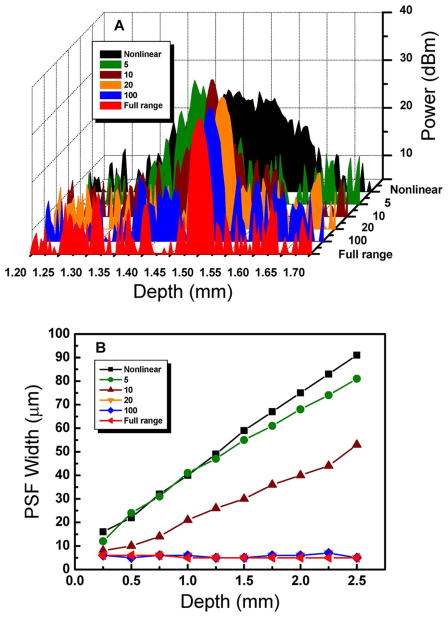
According to Fig. 3A, the width of the PSF is inversely proportional to the k-linearization order at a given depth. The k-linearization order is the number of pixels with known wavenumbers to be used in calibration of the k-linearization. Figure 3B suggests the trend of the PSF change at different depths and with the k-linearization order, as well. The width of the PSF is significantly less when more than 20 pixel positions are obtained. The missing pixel positions are reconstructed using the linear fitting algorithm. Note that this linear fitting algorithm is used only to evaluate the effect of the quantity of pixel–wavenumber information (k-linearization order).
Fig. 3.
(Color online) A, comparison of PSF widths for increasing k-linearization order. B, dependences of PSF width versus depth for increasing k-linearization order.
In order to find an optimized k-linearization order, we plot the change of the PSF width over the k-linearization order in Fig. 4. The width of the PSF reaches the ideal resolution at a k-linearization order of 100, which means there is no further benefit in terms of resolution by further increasing the k-linearization order. However, the k-linearization order of 20 is sufficient for practical PSF narrowing if the increase of k-linearization order requires further resources, such as a fiber-Bragg-grating-based calibration or other wavelength-filter-based component. With the full-range calibration that utilized all the pixels with known wavenumbers in the process, an increment of image display speed can be expected. As mentioned above, speed enhancement is achieved by avoiding the use of any software fitting algorithm.
Fig. 4.
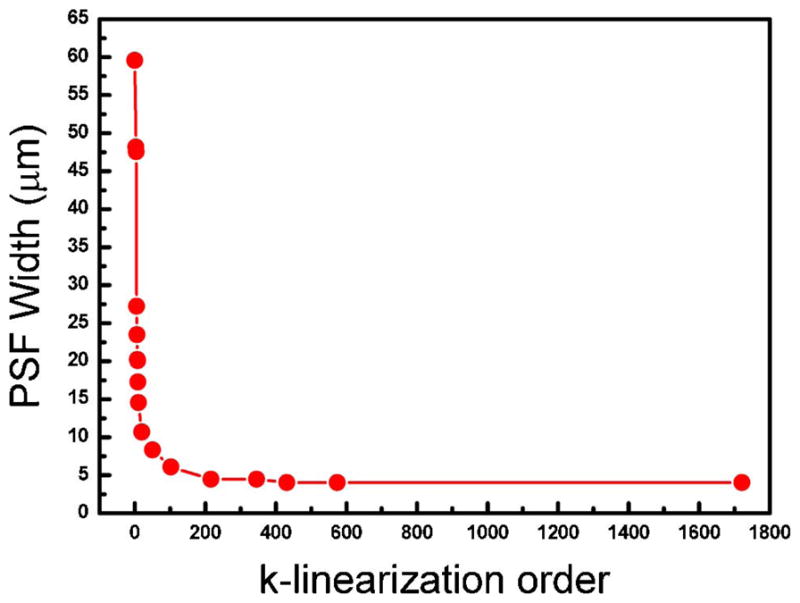
(Color online) PSF bandwidth at a sample depth of 2 mm for increasing k-linearization order.
Figure 5 shows the results of the measured depth-dependent sensitivity with and without spectral calibration. The solid and dotted curves represent the PSFs with and without spectral calibration, respectively. The width of the PSF remains constant with depth in the case of full-range calibration. There is a 25 dB drop at a depth of 2.5 mm, which reflects the reduction in imaging quality with increasing depth. This falloff is consistent with or without the full-range calibration.
Fig. 5.
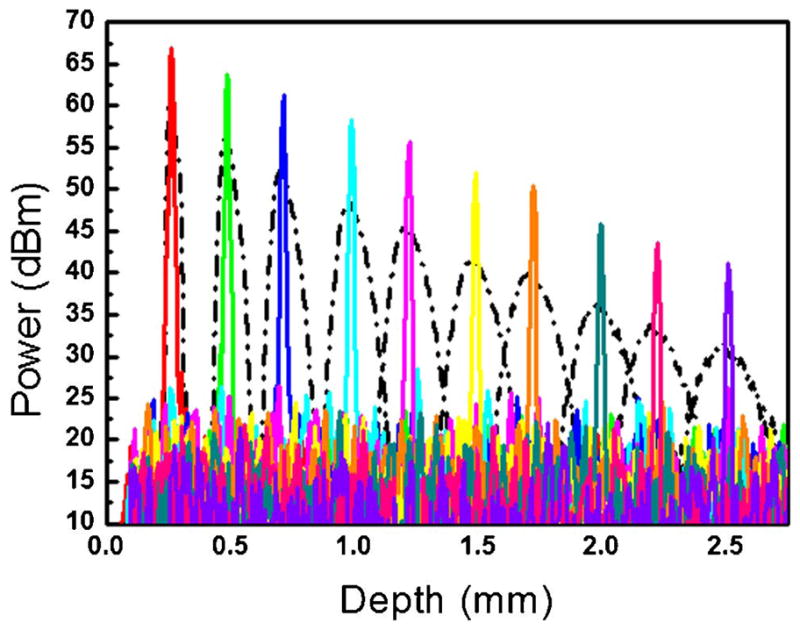
(Color online) PSFs at different depths before (dotted curves) and after (solid curves) full-range calibration.
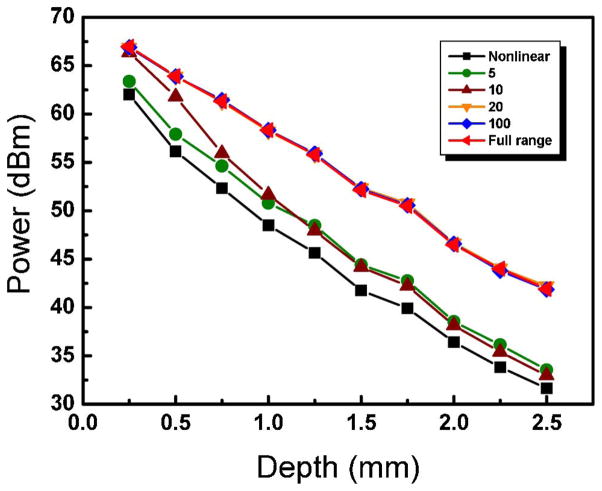
Figure 6 measures the sensitivity drop-off with depth for different k-linearization orders. At an imaging depth of 2.5 mm, the sensitivity of the full-range calibration case drops less than 10 dB compared with the uncompensated case.
Fig. 6.
(Color online) Dependence of signal power versus depth for different k-linearization orders.
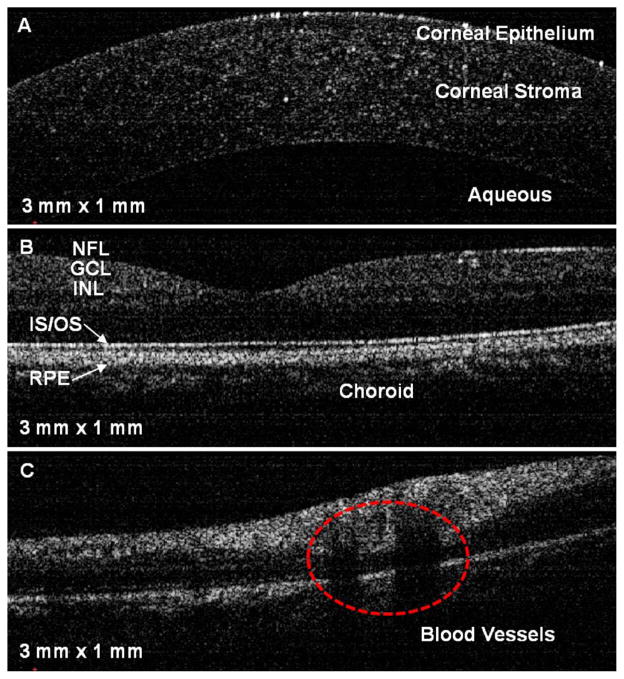
Under a protocol approved by the Institutional Review Board of the University of Illinois at Urbana-Champaign, human retinal OCT images were acquired with and without full-range calibration, and are compared in Fig. 7. It can be seen that the inner structure of the human retinal layers is clear after spectral calibration. Furthermore, deeper structures are visible owing to the increased SNR. Figure 8 shows OCT images of various locations in a human eye using the full-range calibration. Figure 8A shows structural details of the cornea. Several features of the in vivo human retina near the foveal region are visible in Fig. 8B. Figure 8C shows retinal blood vessels within a retinal nerve fiber layer near the optic disk. In order to compensate for dispersion, a 3 mm thick glass plate was inserted in the reference arm. The optical path length through the glass plate was changed by varying the angle of the plate relative to the optical beam in order to compensate for different amounts of dispersion.
Fig. 7.
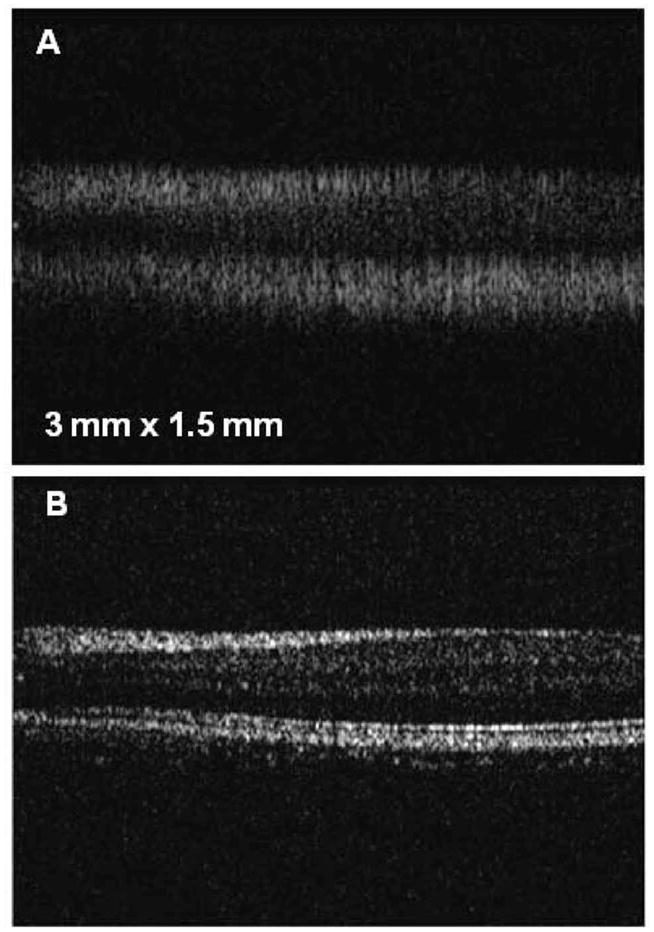
Cross-sectional images of in vivo human retina obtained A, without and B, with full-range calibration.
Fig. 8.
(Color online) In vivo cross-sectional images of the human eye: A, cornea; B, foveal region of the retina; C, retinal blood vessels near the optic disk. NFL, nerve fiber layer; GCL, ganglion cell layer; INL, inner nuclear layer; IS/OS, junction between the inner and outer segment of the photoreceptors; RPE, retinal pigment epithelium.
4. Conclusions
A new full-range k-domain linearization method has been developed and demonstrated. This method enables an optimized signal measurement over increasing imaging depth without the need for introducing significant changes in the SD-OCT instrument. Additionally, samples of interference signal extracted by a wavelength-scanning filter spectrum are equi-distantly distributed in optical frequencies, thus completely avoiding the necessity of wavelength-to-frequency rescaling. This can, therefore, be applied directly to acquired data.
This simple and robust k-linearization method uses the full range of spectral–pixel information. The full-range information was acquired using a wavelength-scanning filter based on a diffraction grating and a translating slit. A lookup table was generated from the calibration process, and during real-time imaging, the k-linearization was achieved by simply resampling the acquired camera output according to the lookup table. The proposed calibration method removes the need of any software fitting algorithm in the real-time acquisition and display of data, and subsequently increases the acquisition and display rates. Once the SD-OCT detection path design is finalized and calibrated, this one-time calibration process was sufficient to provide consistent and improved image quality.
With the increasing use of SD-OCT for biomedical imaging applications, advancements such as this k-linearization method will optimize system sensitivity and signal quality for obtaining diagnostically useful image information.
Acknowledgments
This study was supported by a grant from the Korea Healthcare Technology R&D Project (A102024-1011-0000200), the Oriental Medicine R&D Project (B080033), the National Research Foundation of Korea (200-0014461), the BK 21 Project, and the DAE-GU Metropolitan City R&D Project. This study was also supported in part by a grant from the National Institutes of Health, NIBIB R01EB012479 (S.A.B), and the Samsung Global Research Outreach Program.
References
- 1.Huang D, Swanson EA, Lin CP, Schuman JS, Stinson WG, Chang W, Hee MR, Flotte T, Gregory K, Puliafito CA, Fujimoto JG. Optical coherence tomography. Science. 1991;254:1178–1181. doi: 10.1126/science.1957169. [DOI] [PMC free article] [PubMed] [Google Scholar]
- 2.Drexler W, Morgner U, Kartner FX, Pitris C, Boppart SA, Li XD, Ippen EP, Fujimoto JG. In vivo ultrahigh-resolution optical coherence tomography. Opt Lett. 1999;24:1221–1223. doi: 10.1364/ol.24.001221. [DOI] [PubMed] [Google Scholar]
- 3.Povazay B, Bizheva K, Unterhuber A, Hermann B, Sattmann H, Fercher AF, Drexler W, Apolonski A, Wadsworth WJ, Knight JC, St P, Russell J, Vetterlein M, Scherzer E. Submicrometer axial resolution optical coherence tomography. Opt Lett. 2002;27:1800–1802. doi: 10.1364/ol.27.001800. [DOI] [PubMed] [Google Scholar]
- 4.Swanson EA, Izatt JA, Hee MR, Huang D, Lin CP, Schuman JS, Puliafito CA, Fujimoto JG. In vivo retinal imaging by optical coherence tomography. Opt Lett. 1993;18:1864–1866. doi: 10.1364/ol.18.001864. [DOI] [PubMed] [Google Scholar]
- 5.Hausler G, Lindner MW. Coherence radar and spectral radar—new tools for dermatological diagnosis. J Biomed Opt. 1998;3:21–31. doi: 10.1117/1.429899. [DOI] [PubMed] [Google Scholar]
- 6.Cense B, Nassif NA, Chen TC, Pierce MC, Yun SH, Park BH, Bouma BE, Tearney GJ, de Boer JF. Ultrahigh-resolution high-speed retinal imaging using spectral-domain optical coherence tomography. Opt Express. 2004;12:2435–2447. doi: 10.1364/opex.12.002435. [DOI] [PubMed] [Google Scholar]
- 7.de Boer JF, Cense B, Park BH, Pierce MC, Tearney GJ, Bouma BE. Improved signal-to-noise ratio in spectral-domain compared with time-domain optical coherence tomography. Opt Lett. 2003;28:2067–2069. doi: 10.1364/ol.28.002067. [DOI] [PubMed] [Google Scholar]
- 8.Fercher AF, Hitzenberger CK, Kamp G, Elzaiat SY. Measurement of intraocular distances by backscattering spectral interferometry. Opt Commun. 1995;117:43–48. [Google Scholar]
- 9.Mujat M, Park BH, Cense B, Chen TC, de Boer JF. Autocalibration of spectral-domain optical coherence tomography spectrometers for in vivo quantitative retinal nerve fiber layer birefringence determination. J Biomed Opt. 2007;12:041205. doi: 10.1117/1.2764460. [DOI] [PubMed] [Google Scholar]
- 10.Wang Z, Yuan Z, Wang H, Pan Y. Increasing the imaging depth of spectral-domain OCT by using interpixel shift technique. Opt Express. 2006;14:7014–7023. doi: 10.1364/oe.14.007014. [DOI] [PubMed] [Google Scholar]
- 11.Bajraszewski T, Wojtkowski M, Szkulmowski M, Szkulmowska A, Huber R, Kowalczyk A. Improved spectral optical coherence tomography using optical frequency comb. Opt Express. 2008;16:4163–4176. doi: 10.1364/oe.16.004163. [DOI] [PubMed] [Google Scholar]
- 12.Gelikonov VM, Gelikonov GV, Shilyagin PA. Linear-wavenumber spectrometer for high-speed spectral-domain optical coherence tomography. Opt Spectrosc. 2009;106:459–465. [Google Scholar]
- 13.Hu Z, Rollins AM. Fourier domain optical coherence tomography with a linear-in-wavenumber spectrometer. Opt Lett. 2007;32:3525–3527. doi: 10.1364/ol.32.003525. [DOI] [PubMed] [Google Scholar]


