Abstract
NADPH-dependent dual-flavin enzymes provide electrons in many redox reactions, but what regulates their electron flux is unclear. We recently proposed a four-state kinetic model that links the electron flux through a dual-flavin enzyme to its rates of interflavin electron transfer and FMN domain conformational motion (Stuehr D.J. et al, 2009 FEBS J 276: 3959-3974). Here, we ran computer simulations of the kinetic model to determine if it could fit the experimentally-determined, pre-steady state and steady state traces of electron flux through the neuronal and endothelial NO synthase flavoproteins (nNOSr and eNOSr) to cytochrome c. We found the kinetic model accurately fit the experimental data. The simulations gave estimates for the ensemble rates of interflavin electron transfer and FMN domain conformational motion in nNOSr and eNOSr, provided the minimum rate boundary values, and predicted concentrations of the four enzyme species that cycle during catalysis. Our findings suggest that the rates of interflavin electron transfer and FMN domain conformational motion are counterbalanced so that both processes may limit electron flux through the enzymes. Such counterbalancing would allow a robust electron flux while keeping the rates of interflavin electron transfer and FMN domain conformational motion set at relatively slow levels.
Keywords: flavoprotein, electron transfer, conformational equilibrium, kinetic model, nitric oxide, simulation, redox enzymes
Introduction
A family of structurally-related dual-flavin reductases are widely expressed in animals and include cytochrome P450 reductase (CPR), methionine synthase reductase (MSR), the novel reductase 1 (NR1), and nitric oxide synthase (NOS) [1;2]. Dual-flavin reductases comprise a domain that binds nicotinamide adenine dinucleotide phosphate (NADPH) and flavin adenine dinucleotide (FAD) and that is ancestrally related to ferredoxin/flavodoxin reductases (the FNR domain), and a domain that binds flavin mononucleotide (FMN) and is related ancestrally to flavodoxins (the FMN domain) [3].
Dual-flavin reductases typically transfer electrons from NADPH to various metalloprotein acceptors [1;2]. The FAD receives two electrons from NADPH through a hydride transfer reaction that occurs within the FNR domain. Single electrons are then passed to the FMN domain via inter-flavin electron transfer. The reduced FMN can then transfer an electron to other protein acceptors. During this process the FMN cofactor cycles between its 1- and 2- electron reduced states, namely the FMN semiquinone (FMNsq) which accepts an electron from FAD and the FMN hydroquinone (FMNhq), which donates an electron to the acceptor. The FMN domain is thought to undergo relatively large conformational motion to shuttle electrons between the FNR and the protein acceptors [4-7]. A three-state, two equilibrium model can describe FMN domain function within dual-flavin enzymes (Fig. 1) [6]. In equilibrium A the FMN domain alternates between an “FMN-shielded” or “closed” conformation that allows it to receive an electron from the FNR domain, and an “FMN deshielded” or “open” conformation where the FMN domain has moved away and can transfer an electron to a metalloprotein acceptor. Once in an open conformation the FMN domain is subject to equilibrium B, which involves its interaction with a metalloprotein acceptor (NOSoxy domain, cytochrome P450, heme oxygenase, methionine synthase, cytochrome c). During steady-state catalysis the FMN domain shuttles back and forth between the three conformational states, as dictated by equilibriums A & B, to deliver electrons required for catalysis. Thus, control of electron import into the FMN domain, and its conformational motions, are central to catalysis by dual-flavin enzymes.
Fig 1. Three-state model of NOS FMN domain function in electron transfer and heme reduction.

The FMN domain is attached in NOS by two hinge elements (H1 & H2). Equilibrium A defines a shielded (closed) conformation which has the FMN and FNR domains interacting (left) and a deshielded (open) non-interacting conformation (center) that allows the FMN domain to interact with electron acceptors such as cytochrome c. Equilibrium B defines the FMN–NOSoxy domain interaction required for heme reduction and NO synthesis. Complementary electrostatic interactions (blue, red) are thought to aid both FMN domain interactions in NOS.
To understand how protein conformational motions relate to electron flux through a dual-flavin enzyme, a simple kinetic model was proposed (Fig. 2) [6]. The model relies on the cytochrome c reductase activity to assess the electron flux through the flavoprotein. Assuming that the rates of electron transfer to cytochrome c (k4) are very fast and not rate limiting, the electron flux is only dependent on the rates of conformational motion of the FMN domain (k1, k-1, k3, k-3) and the rate of interflavin electron transfer between the FAD and FMN cofactors (k2). The model incorporates the 1-electron redox cycling of the FMNhq and FMNsq that occurs within the dual-flavin enzymes during catalysis, and therefore includes two temporally-separate equilibrium terms (KAsq and KAhq) that differ according to the reduction state of the FMN (FMNhq versus sq). We define KAsq = k-1/k1 and KAhq = k-3/k3 (Fig.2) so higher values of KA indicate a higher tendency towards open conformations. The equilibrium described by KAhq involves a conformational opening step that allows bound FMNhq to reduce an acceptor (cytochrome c in this case) and consequently become oxidized to FMNsq. The equilibrium described by KAsq involves a conformational closing step that allows the FMNsq to receive another electron from the FNR domain, and thus continue the catalytic cycle. For simplicity, the model assumes that the interflavin electron transfer step (k2) is irreversible. Other assumptions are that the reduction of cytochrome c by FMNhq (k4 step) is irreversible and very rapid relative to all the other kinetic parameters, and that the same applies to the reduction of FNR by NADPH. These conditions are met under typical experimental conditions [8;9].
Fig 2. Kinetic model for electron flux through a dual-flavin enzyme.
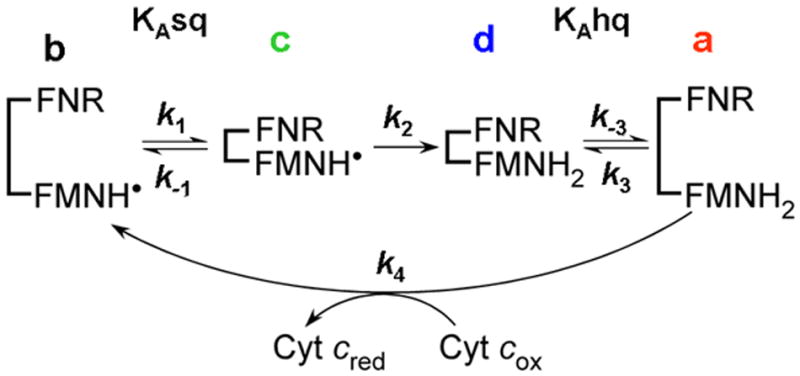
The model uses four kinetic rates: Association (k1 or k3) and dissociation (k-1 or k-3) of the FMN and FNR domains; the FMNH• reduction rate (k2), and the cytochrome c reduction rate (k4). The fully-reduced enzyme in the open conformation (species a) reduces cytochrome c and generates species b, which then undergoes successive conformational closing, interflavin electron transfer, and conformational opening steps to complete the cycle. See text for details.
Recent crystal structures of CPR and the NOS reductase domain (NOSr) help to visualize how dual-flavin reductases may exist in their FMN-shielded and FMN-deshielded conformations [10-13]. These structures make it clear that the FMN domain needs to be in an open conformation to interact with cytochrome c for electron transfer. Recently, Ilagan et al [9] utilized this concept and deployed cytochrome c in stopped-flow spectroscopic experiments to measure the KAhq conformational equilibrium setpoint for the fully-reduced endothelial and neuronal NOSr (nNOSr and eNOSr). This represented the first equilibrium setpoint measures obtained for any member of the dual-flavin reductase family. Two observations from the study were: (i) The eNOSr and nNOSr have markedly different KAhq setpoints, (ii) they likely also have different speeds of conformational motion for their FMN domains. In the current study, we ran computer simulations of the kinetic model presented in Fig. 2, utilizing the measured KAhq values of eNOSr and nNOSr [9], to better understand the factors that control electron flux in these enzymes. The computer simulations of the model were able to fit the experimental data well, and this allowed us to estimate ensemble rates for the conformational motions of the FMN domain and the rate interflavin electron transfer in nNOSr and eNOSr. Other techniques and methods have been unable to estimate these rates, making the model and computer simulations powerful analytic tools. Additionally, the results have interesting mechanistic implications and generally increase our understanding of how domain conformational motions and interflavin electron transfer may combine to govern electron flux through dual-flavin enzymes.
Results
General relationships between KA setpoint, interflavin electron transfer rate, and electron flux
We ran computer simulations of the kinetic model using the computer program Gepasi v.3.30 (see supplementary material for details) under the simplest condition, which is to assume that the KA setpoint stays constant during the catalytic redox cycle of the flavoprotein, and is therefore not influenced by the changes in the FMN redox state (i.e. the value of KAsq is equivalent to KAhq, k1 = k3, and k-1 = k-3; Fig. 2). Fig. 3A shows how electron flux through a dual-flavin enzyme (equivalent to the cytochrome c reductase activity) would vary over a range of KA settings, which we created by varying the rates of conformational change from 0.5 to 9.5 s-1, and over the indicated range of interflavin electron transfer rates (k2). The simulations show that maximal electron flux through the enzyme to cytochrome c is achieved at KA settings near 1, particularly when k2 is relatively fast. This is expected, because at KA = 1 the association and dissociation rates of the FMN-FNR complex are balanced (k1 = k3) (k-1 = k-3). The simulations also show that the maximally-achievable electron flux is always less than the rate of conformational change that represents the opening of the fully-reduced protein (k-3).
Fig 3. Simulations of the kinetic model showing how electron flux through a dual flavin enzyme may relate to the KAhq setting and the rate of interflavin electron transfer.
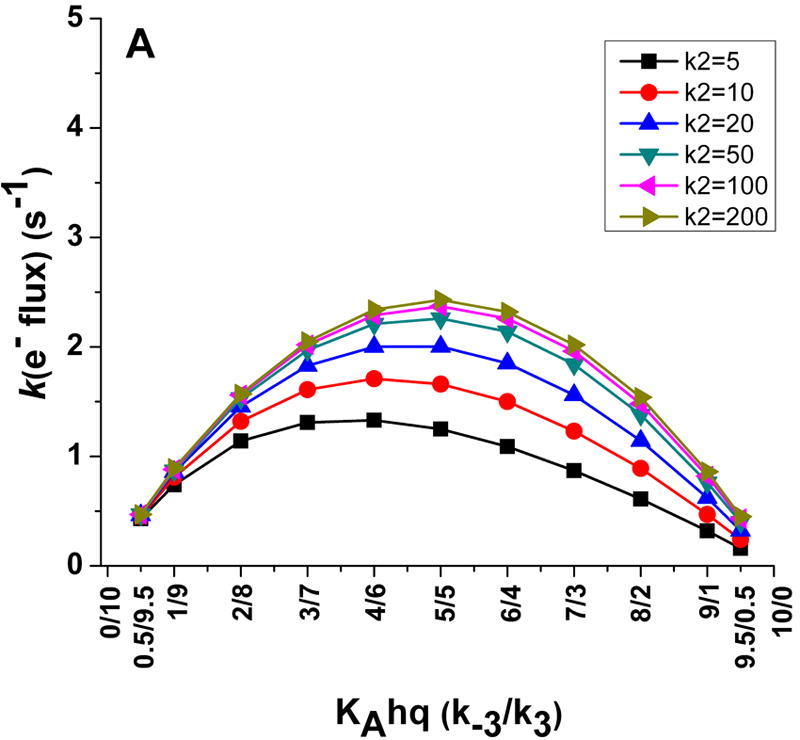
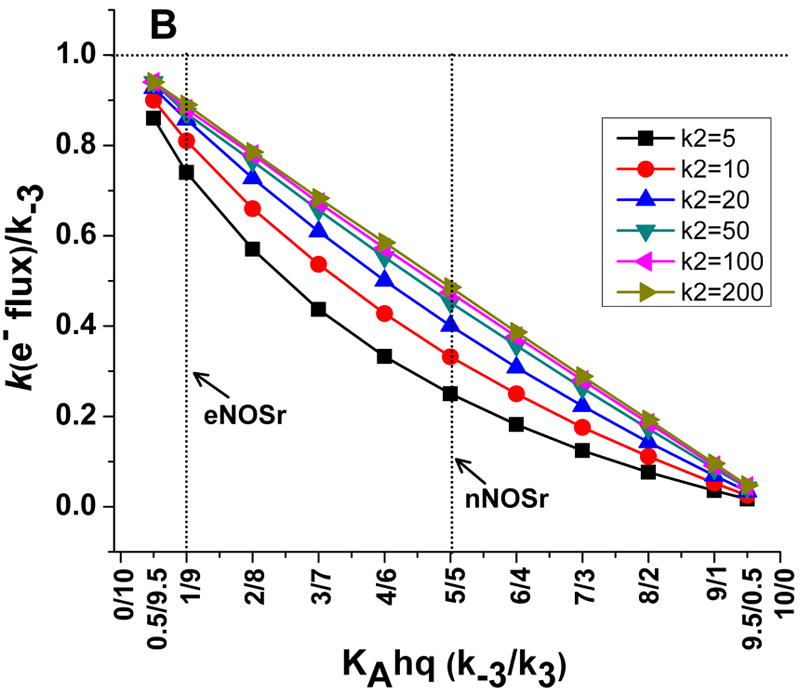
Panel A shows the electron flux as a function of KAhq setting at six different interflavin electron transfer rates, while Panel B shows how the electron flux relates to the rate of conformational change at each KAhq and interflavin electron transfer setting. Values for k2, k3, and k-3 are in (s-1).
A second plot of the simulated data shows these relationships from a different perspective (Figure 3B). Again, it is apparent that the electron flux through the enzyme to cytochrome c never achieves the conformational opening rate k-3 at any KA setting (indicated by the 1.0 value on the Y-axis). The discrepancy is smallest when the KA setting is low (i.e., where the dual-flavin reductase predominantly favours a closed or FMN-shielded conformation), and becomes progressively greater as the KA setting increases (i.e., as the percentage of the reductase favouring an open or FMN-deshielded conformation increases). This is because as the KA setting increases, the association rate of the FMNsq (k1) with the FNR domain gets slower and plays an increasingly larger role in limiting the electron flux through the enzyme. Also indicated in Fig. 3B are the KAhq positions that have been reported for the fully-reduced eNOSr and nNOSr enzymes [9]. The eNOSr has a low KAhq setting and so exists predominantly in an FMN-shielded conformation. Thus, its rate of FMNhq dissociation (k-3) may not be too different from the maximal electron flux that eNOSr could achieve (depending on the speed of k2). In contrast, nNOSr has a KAhq setting close to 1, and so its maximum electron flux should only be 50% or less than the rate of its FMNhq dissociation (k-3), according to the kinetic model.
Summary of the NOSr experimental data
Before describing the simulations we ran for nNOSr and eNOSr in the current study, it is useful to review the experimental results of Ilagan et al [9] that utilized pre-steady state and steady state measures of electron flux to cytochrome c, and from these measures estimated the KAhq positions of the fully-reduced eNOSr and nNOSr. Fig. 4 contains the kinetic traces reproduced from Ilagan et al [9] that follow cytochrome c reduction versus time in reactions where excess cytochrome c was mixed with fully-reduced nNOSr or eNOSr in a stopped flow spectrophotometer at 10 °C. The traces cover a time frame that includes the first catalytic turnover completed by each enzyme (transfer of an electron from the FADhq/FMNhq form of the reductase to one molar equivalent of cytochrome c, as indicated by the the dashed box in the figure), and also includes the subsequent period where the reactions shift into multiple turnover and achieve a steady state. The experimental traces show that both enzymes quickly reduced some cytochrome c within the mixing dead-time of the instrument. This initial reaction is assumed to have been carried out by the fraction of each NOSr enzyme that is in the open or FMN-deshielded conformation; essentially the reaction that involves species a as indicated by the k4 step in the kinetic model (Fig. 2). The extent of cytochrome c reduction that occurs in this phase (moles) relative to the total moles of NOSr enzyme that is present in the reaction is indicated by the brackets on the Y-axis in Fig. 4. This was used by Ilagan et al to calculate the proportion of each NOSr that was in the FMN-deshielded versus FMN-shielded conformation at the time of mixing, and thus to determine the KAhq setting of either fully-reduced NOSr enzyme [9]. After the fast reaction that occurs in the mixing dead-time is finished, the absorbance trace for either enzyme reaction deflects and then continues to increase in a near-linear manner during the rest of the single turnover phase (designated as period p in Fig. 4). The absorbance then continues to increase almost unchanged as each enzyme goes beyond the first turnover equivalent of cytochrome c and enters the multiple turnover, steady-state phase of the reaction. This behavior implies that whatever factors limit the electron flux to cytochrome c during period p in the first turnover continue to do so during the steady state. Reasoning that electron flux to cytochrome c during period p must reflect the conformational opening rate k-3 of the fully-reduced, FMN-shielded NOSr, Ilagan et al concluded that electron flux through NOSr was dependent on this conformational opening step during the steady-state reaction [9].
Fig 4. Reaction of fully-reduced NOSr proteins with excess cytochrome c.
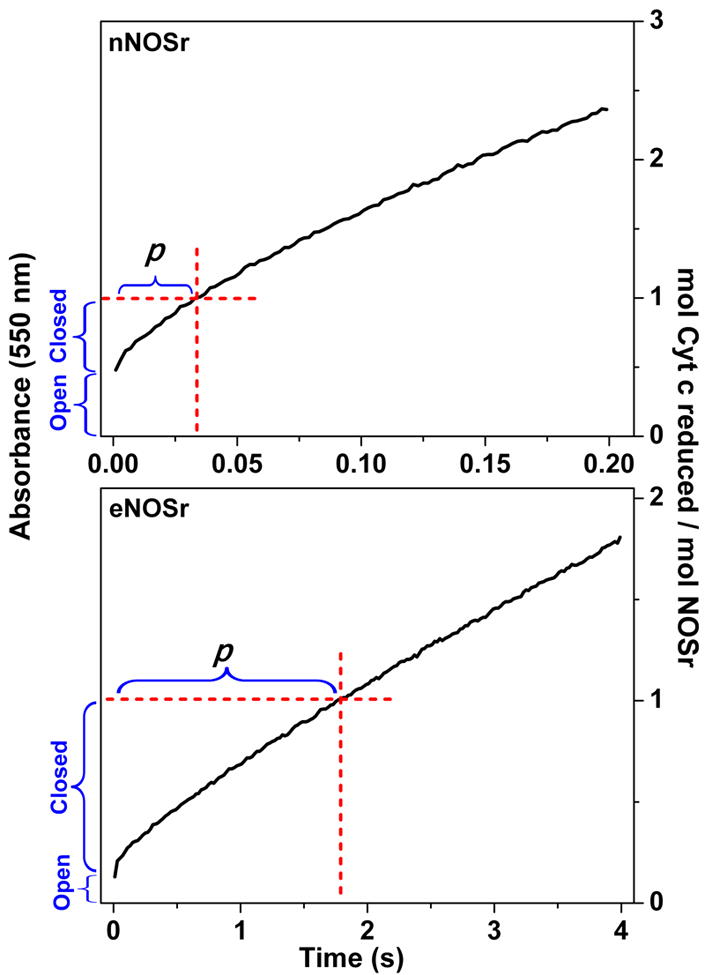
The experimental traces were obtained in stopped-flow reactions that mixed excess cytochrome c with an anaerobic solution containing the fully reduced NOSr and excess NADPH at 10 °C, and are reproduced from Ilagan et al [9]. The dashed red lines show the absorbance change and time associated with the reduction of one equivalent of cytochrome c. The blue vertical brackets indicate the portions of the reaction that are attributed to the open and closed conformational forms of NOSr within this timeframe. p indicates the portion of the reaction that involves the closed conformational form of NOSr within this timeframe. See text for details.
Simulations of nNOSr using the kinetic model
With the above concepts in mind, we ran computer simulations of the kinetic model using the experimentally-determined KAhq setpoints for nNOSr and eNOSr [9], aiming to reproduce the published experimental traces of electron flux to cytochrome c (Fig. 4), and in so doing to obtain rate estimates for conformational change and for interflavin electron transfer from fits of the experimental data.
Fig. 5A shows the absorbance trace generated from a simulated reaction of nNOSr with cytochrome c, using a KAhq setting of 1 and assuming a relatively fast interflavin electron transfer rate (k2) of 200 s-1, which is at least 4 times faster than published estimates of interflavin electron transfer rates [18-20] [28;29]. Using a fast k2 setting assures that the electron flux will be primarily limited by the rate of conformational motion in this particular simulation. We then set the conformational kinetic values to equal the 8 s-1 cytochrome c reduction rate that was observed by Ilagan et al [9] during phase p in the nNOSr experimental data set in Fig. 4. All conformational rates are assumed to be the same in this case, k1 = k-1 = k3 = k-3 = 8 s-1. This simulation generated a reaction trace that qualitatively mimics the experimental data with regard to an initial fast cytochrome c reduction (akin to what occurs during the mixing dead-time) in Fig. 4, followed by a slower and linear absorbance increase at 550 nm that represents the cytochrome c reduction taking place during the remainder of the first turnover and into the steady state phase. However, this simulation does not match the magnitude of electron flux through nNOSr that was observed in the experimental data during phase p or in the steady state. Specifically, in the simulation the electron flux to cytochrome c during these time frames were 3.85 s-1, which is only 48% of the 8 s-1 value that was experimentally-observed for nNOSr at 10 °C. This mismatch is consistent with our simulation results in Fig. 3A, B that indicated the electron flux through nNOSr cannot go beyond 50% of its k-3 rate of conformational opening of the FMN hydroquinone, which we set in this simulation to be 8 s-1.
Fig 5. Simulated reactions of fully-reduced nNOSr with excess cytochrome c.

The traces were obtained by simulating the kinetic model in Fig. 2, using different rates of conformational motion and interflavin electron transfer (k2) for nNOSr. For nNOSr k1 = k-1 = k3 = k-3. Total nNOSr concentration is 1.0, and the concentration of enzyme species d + a was set equal to 1.0 at time = 0 in the simulations. The dashed red lines indicate the absorbance change and time associated with reduction of one equivalent of cytochrome c. Kinetic settings (s-1) were Panel A: k1 = k-1 = k3 = k-3= 8, k2 = 200; Panel B: k1 = k-1 = k3 = k-3= 17.5, k2 = 200; Panel C: k1 = k-1 = k3 = k-3= 34, k2 = 30; Panel D: k1 = k-1 = k3 = k-3= 45, k2 = 25; Panel E: k1 = k-1 = k3 = k-3= 80, k2 = 20.
We next attempted a better fit by increasing the rates of conformational motion in nNOSr while keeping the KAhq and the k2 settings unchanged. Fig. 5B shows that using a faster rate of conformational motion (k1 = k-1 = k3 = k-3 = 17.5 s-1) can more accurately simulate the observed electron flux of 8 s-1 through nNOSr. However, there is still a discrepancy in the simulated trace of Fig. 5B regarding its taking a longer time to complete the first turnover (62 ms) compared to the experimental trace (37 ms) from Ilagan et al [9] (Fig. 4). The simulated trace also shows a sharp break instead of a more rounded transition between the fast and slow phases of the reaction. We next repeated the simulation using a series of slower interflavin electron transfer rates (k2) and selecting corresponding faster rates of conformational change that would still maintain an electron flux through nNOSr at 8 s-1. Fig. 5C-E show the traces we obtained at k2 settings of 30, 25, and 20 s-1, respectively. In general, these traces created at slower k2 settings better match the experimental data. The very best match between the simulated and experimental traces was achieved using a k2 of 25 s-1 and a corresponding rate of conformational change of 45 s-1 (Fig. 5D). This provided a close match regarding the rounded transition between the two phases of cytochrome c reduction, and also accurately matched the time required to reduce one equivalent of cytochrome c (time for 1st catalytic turnover, 37 ms).
In the above simulations, we found that in order to maintain a steady electron flux through nNOSr as we slowed down the rate of interflavin electron transfer (k2), we had to invoke corresponding increases in the rate of conformational motion. Fig. 6 contains results from many simulations, that provide a range of combinations of interflavin electron transfer rate and conformational change rates that fit the experimentally-determined electron flux through nNOSr (8 s-1 at 10 °C). At the highest interflavin electron transfer rate (k2), a horizontal tangent to the graphed line provides the lower boundary rate of conformational change that would be needed to maintain the observed electron flux, which in the case of nNOS is about 17 s-1. Similarly, a vertical tangent to the graphed line indicates the lower boundary value for the interflavin electron transfer rate (k2) of about 20 s-1, because below this value the corresponding rate of conformational motion that would be needed to maintain the observed electron flux becomes prohibitively fast or even unattainable.
Fig 6. Conformational motion and interflavin electron transfer rate settings that support the observed (8 s-1) electron flux through nNOSr.
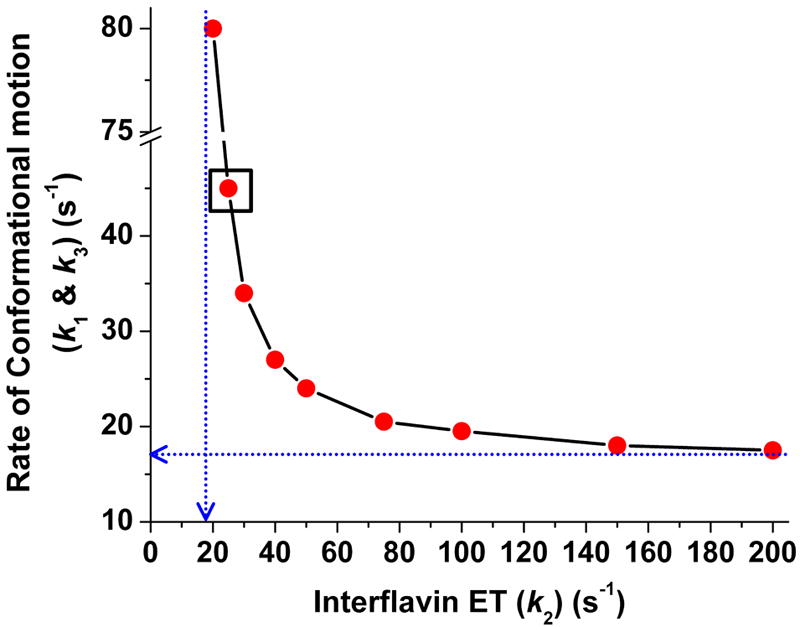
Data were obtained from simulations of the kinetic model in Fig. 2. For a given k2 value, rates of conformational motion were screened for a value that yields an electron flux of 8 s-1. Conformational motion rates were set so KAhq = KAsq = 1 and k1 = k-1 = k3 = k-3. Blue dashed lines indicate the lower boundary values for the rates of conformational motion (Y intercept) and interflavin electron transfer (X intercept). Boxed point is the best-fit rate pair for nNOSr.
Traces in Fig. 7 were derived from the same simulations we ran for Fig. 5B-E, but in this case show how the distributions of the four enzyme species (Fig. 2) change as a function of reaction time under each setting. In the reaction that we simulated using a fast interflavin electron transfer (k2 = 200 s-1) and a correspondingly slow rate of conformational change (17.5 s-1) (Panel A), the steady state enzyme distribution is reached very quickly (within 30 ms) and is characterized by an almost equivalent build up of only two species of nNOSr, namely the deshielded FMNsq form (species b) and the shielded FMNhq form (species d). Together, these two species account for about 90% of the enzyme distribution in the steady state under this condition. Build up of these two species makes sense, because the further transition of either species depends on the relatively slow rate of conformational change. A somewhat different pattern emerges for reactions that were simulated using slower k2 values and correspondingly faster rates of conformational change (Fig. 7, Panels B-D). Under this circumstance it takes longer to reach the steady state, with final enzyme distribution requiring times even beyond the time required for the first turnover (marked by the vertical dashed line). The deshielded FMNsq species (species b) remains predominant in steady state, accounting for 50% of the total enzyme distribution. However, build up of the shielded FMNhq species (species d) becomes compromised, and there is a corresponding increase in build up of the shielded FMNsq species (species c), such that species c overtakes species d when the k2 value falls below 30 s-1. In general, this distribution change is expected to occur as electron flux through nNOSr becomes more and more limited by its interflavin electron transfer rate (k2). How the distribution of the four enzyme species changes as a function of k2 and the conformational rate (both values were balanced in all cases to maintain the observed 8 s-1 electron flux through nNOSr) is shown in Fig. 8. Interestingly, the relative distribution of the total FMNsq and FMNhq enzyme species (the FMN-shielded plus the FMN-unshielded conformations) changes considerably across the range, going from a minimum of 50% total FMNsq species present at the fastest k2 to about 90% total FMNsq species present at the slowest allowable k2. Thus, the simulations predict that nNOSr should contain between 50 to 90% of its FMN in the FMNsq state (with the remainder in the FMNhq state) during steady-state cytochrome c reduction. This range in FMNsq/hq redox distribution arises from the offsetting rise and fall of the two FMN-shielded forms of nNOSr (the FMNsq and FMNhq species, Fig. 8) whose build up depends on whether the electron flux is limited primarily by the rate of interflavin electron transfer (favors build up of the FMNsq species) or by the rate of conformational change (favors build up of the FMNhq species).
Fig 7. Patterns of enzyme distribution versus time for nNOSr reactions that were simulated using different rate pairings.
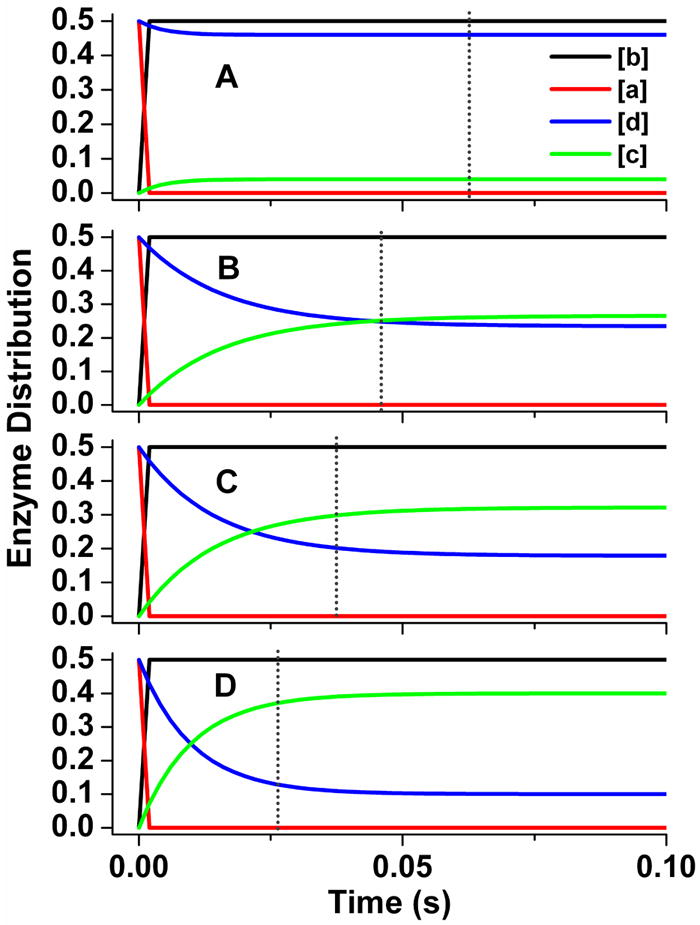
Rate pairs of conformational motion and interflavin electron transfer were chosen in each case to simulate an electron flux of 8 s-1. Lines indicate the relative concentrations of each enzyme species a-d (see Fig. 2), with the total enzyme concentration being 1.0 and the concentration of enzyme species d + a being set equal to 1.0 at time = 0 in the simulations. Dotted line marks the time required for nNOSr to reduce one equivalent of cytochrome c. Kinetic settings (s-1) were Panel A: k1 = k-1 = k3 = k-3= 17.5, k2 = 200; Panel B: k1 = k-1 = k3 = k-3= 34, k2 = 30; Panel C: k1 = k-1 = k3 = k-3= 45, k2 = 25; Panel D: k1 = k-1 = k3 = k-3= 80, k2 = 20.
Fig. 8. Influence of interflavin electron transfer rate on the relative steady-state concentration of nNOSr enzyme species.
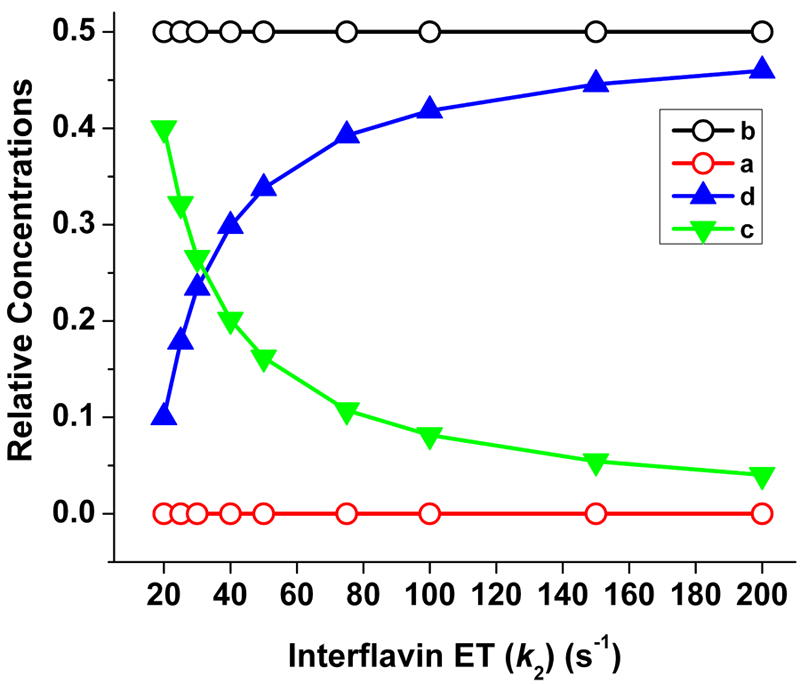
Rate pairs of conformational motion and interflavin electron transfer were chosen in each case to simulate an electron flux of 8 s-1 through nNOSr. Lines indicate the relative steady-state concentrations of each enzyme species a-d (see Fig. 2), with the total enzyme concentration set at 1.0 in the simulations.
Another notable feature is the enzyme re-distribution that occurs during the time required to reduce one molar equivalent of cytochrome c (the area marked within dashed boxes in Figs. 4 and 5). In all reactions, there is an immediate enzyme distribution change that reflects the very fast reaction of cytochrome c with the proportion of the nNOSr FMNhq that is in the open conformation (species a), converting it instantly to the open FMNsq form (species b). In nNOSr, this fast reaction involves about 50% of the total enzyme molecules, as stipulated by the KAhq = 1. As this fast reaction occurs, the nNOSr FMNhq molecules that are in the closed conformation begin to open according to rate k-3 and react with cytochrome c. However, at the same time, the 50% of nNOSr molecules that have already reacted with cytochrome c begin to redistribute to the closed conformation (species c) according to rate k1, and some of these molecules undergo interflavin electron transfer to form the closed form of nNOSr FMNhq (species d). These enzyme “recycling” transitions take place even within the first turnover to ultimately create a relatively steady concentration of species d, which in turn helps determine the observed rate of cytochrome c reduction during phase p and enables this rate to remain relatively unchanged as the reaction proceeds beyond the first turnover.
Simulations of eNOSr using the kinetic model
When compared to nNOSr, the KAhq setting of eNOSr is 8-fold shifted toward the FMN-shielded state and its electron flux to cytochrome c is about 16-times slower [9]. Fig. 9 contains four kinetic traces that we generated by simulating eNOS cytochrome c reduction, using the experimentally-determined KAhq setting of 0.125 [9], and different combinations of interflavin electron transfer rates (k2) and corresponding rates of FMN domain conformational motion that all maintain the experimentally-observed electron flux value of 0.5 s-1 at 10 °C. The simulated traces A-C generally mimic the experimental trace obtained for eNOSr (Fig. 4) with regard to the general line shape and the time required to catalyze a single turnover (1.8 s). These traces cover k2 settings of 100, 10 and 5 s-1, respectively. Only at a very low k2 setting (0.75 s-1, panel D) does the shape of the trace, and the time required to complete the first turnover, deviate significantly from the experimental trace obtained for eNOSr (Fig. 4). Thus, unlike for nNOSr, the electron flux through eNOSr can be accurately simulated over a relatively broad range of conformational motion and interflavin electron transfer rate pairings.
Fig 9. Simulated reactions of fully-reduced eNOSr with excess cytochrome c.
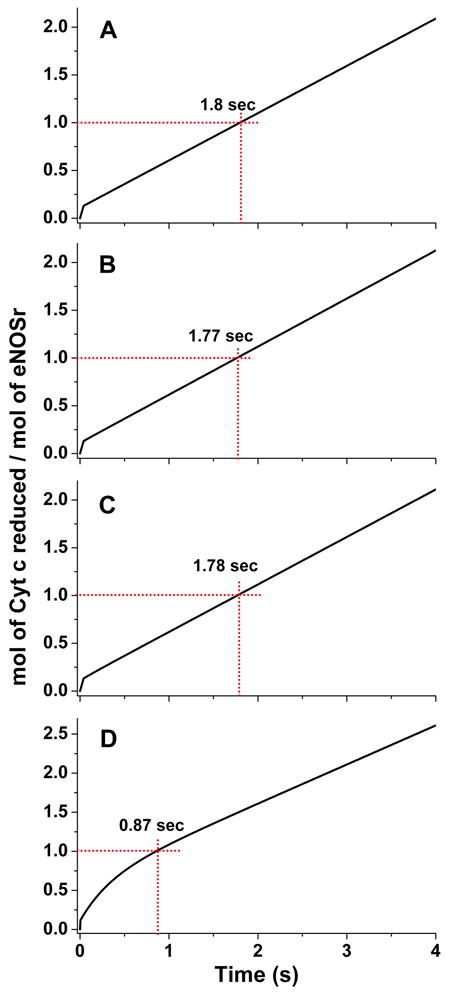
The traces were obtained by simulating the kinetic model in Fig. 2, using different rates of conformational motion and interflavin electron transfer (k2) for eNOSr. For eNOSr k1 = k3; k-1 = k-3 = 0.125×k1. Total eNOSr concentration was 1.0, and the concentration of enzyme species d + a was set equal to 1.0 at time = 0 in the simulations. The dashed red lines indicate the absorbance change and time associated with reduction of one equivalent of cytochrome c. Kinetic settings (s-1) were Panel A: k1 = k3 = 4.48, k-1 = k-3 = 0.56, k2 = 100; Panel B: k1 = k3 = 4.8, k-1 = k-3 = 0.6, k2 = 10; Panel C: k1 = k3 = 5.04, k-1 = k-3 = 0.63, k2 = 5; Panel D: k1 = k3 = 18, k-1 = k-3 = 2.25, k2 = 0.75.
The graphs in Fig. 10 indicate the pairings of conformational motion and interflavin electron transfer rates that would maintain the experimentally-measured electron flux of 0.5 s-1 through eNOSr [9]. These curves give lower boundary values for the rates of conformational change, k1 = k3 ≥ 4.5 s-1 and k-1 = k-3 ≥ 0.56 s-1, and also give a lower boundary value for the rate of interflavin electron transfer, k2 ≥ 0.5 s-1.
Fig 10. Conformational motion and interflavin electron transfer rate settings that support the observed (0.5 s-1) electron flux through eNOSr.
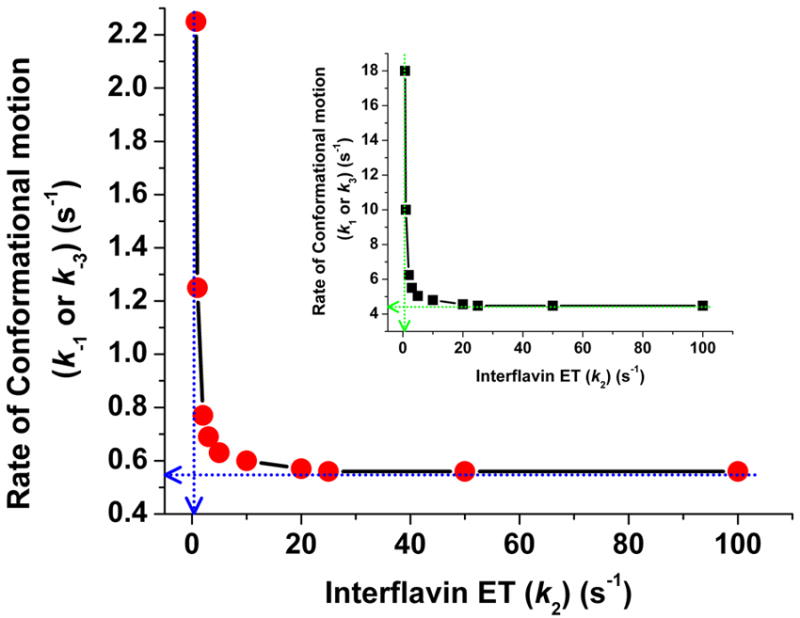
Data were obtained from simulations of the kinetic model in Fig. 2. For a given k2 value, rates of conformational motion were screened for a value that yields an electron flux of 0.5 s-1. Conformational motion rates were set so KAhq = KAsq = 0.125; k1 = k3; k-1 = k-3= 0.125×k1. Blue or green dashed lines indicate the lower boundary values for the rates of conformational motion (Y intercept) and interflavin electron transfer (X intercept). The main panel shows the resulting values in terms of the conformational opening rates (k-1 = k-3). In the inset the same datapoints are plotted now indicating the rates of conformational closing (k1 = k3) in the y axis.
Fig. 11 contains traces derived from the eNOSr reactions simulated in Fig. 9, and show in this case how the distribution of eNOSr species would change as a function of reaction time under the different allowable kinetic settings. In all cases, initiating the reaction causes the 10% of reduced eNOSr that exists in the open conformation (according to the KAhq) to react instantly and convert to the open FMNsq form of eNOSr. In the reaction we simulated with relatively fast interflavin electron transfer (k2 = 100 s-1) (Panel A), the steady state enzyme distribution is reached within 0.5 s, far before the single turnover is finished (1.8 s). During the steady state (panel A) almost all of eNOSr populates only two forms: the closed FMNhq form (species d, 88.5%) and the open FMNsq form (species b, 11%). This distribution pattern is consistent with the relative slowness of the conformational opening step (k-1) in eNOSr, and also reflects the very different rates of conformational opening (k-1 and k-3) and closing (k1 and k3) as dictated by the value of KA. In the reactions we simulated using slower interflavin electron transfer rates (k2 = 10, 5, or 3 s-1; Panels B-D), the steady state enzyme distribution is reached more slowly, but is still achieved well before the single turnover is finished (1.8 s). Thus, under all cases a considerable extent of enzyme recycling occurs to form species d even before the first equivalent of cytochrome c is reduced by eNOSr. However, at slower k2 rates a greater proportion of the closed FMNhq form (species d) gets redistributed once the reaction starts, predominantly distributing into the closed FMNsq form (species c; changing from almost 0% to 5, 10, and 17% in panels A-D, respectively). This shift reflects a growing influence of the FMNsq reduction step in limiting electron flux through eNOSr as the k2 value decreases. But even at a relatively slow interflavin electron transfer rate (k2 = 3 s-1, panel D) the k2 does not become the major factor limiting electron flux, because the KAhq setting of eNOSr still constrains the enzyme to exist predominantly as the closed FMNhq species whose inherent reactivity toward cytochrome c is masked by its very slow rate of conformational opening. Thus, our simulations predict that 70-95% of eNOSr will exist in the FMNhq state during its steady-state cytochrome c reduction. In contrast, only 20-30% of nNOSr is predicted to be in its FMNhq state under identical reaction circumstances (see above). Their different enzyme distributions in the steady state can be primarily attributed to their widely dissimilar KAhq settings, and to their different rates of conformational change.
Fig. 11. Patterns of enzyme distribution versus time for eNOSr reactions that were simulated using different rate settings.
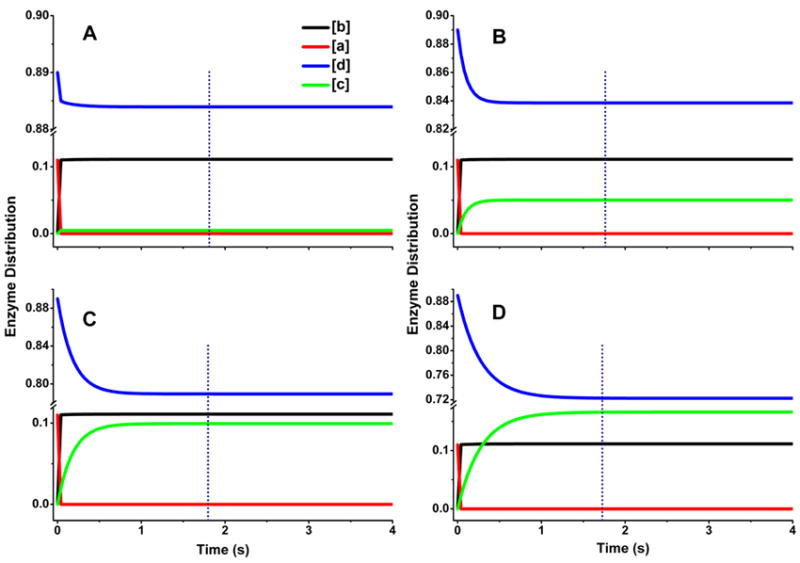
Rates of conformational motion and interflavin electron transfer were chosen in each case to simulate an electron flux of 0.5 s-1. Lines indicate the relative concentrations of each enzyme species a-d (see Fig. 2), with the total enzyme concentration being 1.0 and the concentration of enzyme species d + a was set equal to 1.0 at time = 0 in the simulations. Dotted line marks the time required for eNOSr to reduce one equivalent of cytochrome c. Kinetic settings (s-1) were Panel A: k1 = k3 = 4.48, k-1 = k-3 = 0.56, k2 = 100; Panel B: k1 = k3 = 4.8, k-1 = k-3 = 0.6, k2 = 10; Panel C: k1 = k3 = 5.04, k-1 = k-3 = 0.63, k2 = 5; Panel D: k1 = k3 = 5.5, k-1 = k-3 = 0.69, k2 = 3.
Discussion
Electron flux through the NADPH-dependent dual-flavin enzymes presents several thermodynamic, conformational, and kinetic challenges [1;2;7]. We focused on the challenges inherent to the FMN domain performing electron acceptor and electron donor roles in tandem to shuttle electrons from NADPH to an acceptor protein, which in our study was cytochrome c. Through computer simulations of a simple kinetic model that describes interflavin electron transfer and FMN domain conformational motions in a dual flavin enzyme [6] (Fig. 2), we fit data obtained from previous experimental measures (KAhq, time required to complete a single turnover, and steady-state cytochrome c reductase activity) [9] to obtain predicted rates and lower boundary values for the interflavin electron transfer and the FMN domain conformational opening and closing steps that occur during catalysis by eNOSr and nNOSr. To our knowledge this is the first study to model electron flux through NOS enzymes, or through dual flavin enzymes, in this manner. Practically speaking, the estimated rate values and enzyme distribution patterns that we obtained here will be useful to guide further experiments to probe how electron transfer is linked to the protein conformational equilibrium in NOS enzymes. In addition, the general applicability of our approach makes it useful to study interflavin electron transfer and conformational motion in the other members of the dual-flavin enzyme family.
Relation to protein structural aspects
It is important to consider how the rate measures and estimates we describe here may relate to the molecular-level events that occur in the NOSr proteins or in dual flavin enzymes during electron flux to cytochrome c. Our kinetic model (Fig. 2) assumes that the FMNhq has a binary reactivity (highly reactive versus unreactive) that is linked to two general conformational states of the FMN domain (open versus closed conformations, respectively). Clearly, a binary model is a simplification because there are likely to be many conformational states that the FMN domain can populate during catalysis. Nevertheless, the crystal structures of nNOSr and the related CPR establish what a closed conformational state is likely to look like in a dual flavin enzyme [11;13;14]. In these structures the FMN domain is cradled by the FNR domain, with the FMN cofactor buried near the domain interface and shielded from solvent. In this conformation the bound FMN is closely aligned with the bound FAD cofactor bound in the FNR domain. As discussed previously [13-15], the relatively large size of cytochrome c (minimum 35 Å diameter, similar to that of the FMN domain) constrains its approach and should prevent it from accepting an electron from the FMN cofactor unless the FMN domain moves from its position as seen in these crystal structures. Support for this concept was recently provided in experiments with a CPR mutant whose FMN domain was held in place against the FNR domain by introduction of a disulfide bond [14]. Thus, the rates of conformational motion that we report (k3 & k-3) likely reflect any conformational movements of the FMN domain that would allow its bound FMNhq to transfer an electron to cytochrome c, or prevent it from doing so. Interestingly, recent crystallography and small angle x-ray scattering studies have visualized some of the possible open conformational states of CPR [10;12;16]. These studies suggest that the FMN domain undergoes a twisting motion to free itself from the FNR domain. The FMN domain can also undergo further movement that completely separates it from the FNR domain, and can populate conformations that place its bound FMN as far as 60 Å away from the bound FAD. All open conformational states described for CPR in these studies would be capable of rapid cytochrome c reduction. Which open conformations are populated during catalysis is still unclear, but evidence suggests that the most open conformation seen in these studies may be catalytically detrimental [12]. A recent study that mapped the energy landscape of the conformational equilibrium in CPR also found that discreet conformations become populated during catalysis [17]. A similar array of open complexes are likely to be populated by NOSr enzymes, and their individual formation rates and lifetimes would blend to create the ensemble kinetic values that we report here for FMN domain motion in nNOSr and eNOSr.
Estimating the most probable rate values for nNOSr and eNOSr
Our simulations showed that reasonable fits of nNOSr or eNOSr electron flux to cytochrome c could be achieved over a range of combined interflavin electron transfer and conformational motion rate pairs (represented by the lines in Figs. 6 and 10). Can we further determine which rate pair along these fit lines is the most likely combination for either enzyme? In our current analysis, the KAhq = 1 setting of nNOSr makes two other fitting parameters (the time required for the first turnover, and the curvature of the line, see Fig. 5) sufficiently sensitive to the magnitudes of any given rate pair such that these parameters become useful for estimating the most probable rates of interflavin electron transfer and conformational motion in nNOSr. With this in mind, the kinetic pair that best describes nNOSr electron flux to cytochrome c (at 10 °C) has the rate of interflavin electron transfer set at 25 s-1 and the rate of conformational motion set at 45 s-1 (Trace D in Fig. 5, Trace C in Fig. 7). The position of this kinetic pair on the fit line is circled in Fig. 6. The best fit rate estimate for interflavin electron transfer in nNOSr (25 s-1 at 10 °C) is close to the observed rates measured for nNOSr by T-jump or stopped-flow methods, which ranged from 14 to 55 s-1 [18-20].
For eNOSr, the experimental trace describing electron flux to cytochrome c has almost no curvature (Fig. 4) and the time required for completing the first turnover is relatively insensitive to the magnitude of the kinetic pair values we used in the simulations (see Fig. 9). This prevents us from estimating the most probable kinetic pair rates for eNOSr as we did above for nNOSr. However, if one considers that it is generally easier for enzymes to support slower transitions than faster ones (to a point), this implies that eNOSr, like nNOSr, may operate using a blend of relatively slow rate values that are found near the corners of the fit lines in Fig. 10. Indeed, one could consider that the rate pairs located in the corner positions, which represent the slowest possible pairs, may generally be the most efficient means for a dual flavin enzyme to achieve a given electron flux. For the nNOSr and eNOSr, having slower setpoints for their rates of interflavin electron transfer and conformational motion could help minimize their uncoupled reduction of O2 and would also be consistent with their function, because this circumstance gives either enzyme room to improve their electron flux when calmodulin binds and activates electron transfer [6;21].
Relation to other multi-domain redox enzymes
Domain conformational switching operates during electron transfer in several multi-domain enzymes, including sulfite oxidase, phthalate dioxygenase reductase, cytochrome bc1, and various flavo-heme enzymes [22-27]. Catalysis by these enzymes involves relatively large-scale movements of flavin, iron-sulfur, or even heme-containing domains. The kinetics of the domain conformational motions or electron transfer events has been studied in some of these systems. For example, the rate of conformational shuttling by the FeS subdomain in cytochrome bc1 is thought to be near 300 s-1 [22]. Estimated rates of inter-domain electron transfer range from 50 to 1500 s-1 among flavo-heme enzymes [25;27] and in sulfite oxidase is likely to be ≥ 400 s-1 [24]. In comparison, our estimates for the rates of conformational motion and inter-flavin electron transfer in eNOSr and nNOSr would be in the slower part of the range. However, interdomain electron transfer in the related enzyme CPR is similarly slow, with estimates ranging from 20 to 55 s-1 depending on the measurement method [28;29]. Relatively slow interflavin electron transfer and conformational motions in dual-flavin enzymes may reflect their having evolved to supply electrons to protein domains or partners whose catalytic activities are also relatively slow. In addition, for the NOS enzymes their NO synthesis places a selective pressure to keep heme reduction from becoming too fast, which otherwise can cause problems in catalytic turnover related to heme-NO binding [30]. In the case of nNOS, FMN domain conformational motion appears to be a major factor limiting cytochrome c reduction, but only partially limits heme reduction [31]. In contrast, the very slow rate of FMN conformational opening in eNOS could certainly limit its rate of heme reduction. These concepts may explain earlier work with eNOS-nNOS chimeras that showed the identity of the flavoprotein domain determines the NOS heme reduction rate [32].
Our estimates for interflavin electron transfer rates in eNOSr and nNOSr, as well as the measured estimates for nNOSr and for CPR [18-20;28;29], are much slower than what is predicted based on the close proximity of the FAD and FMN cofactors in the CPR and nNOSr crystal structures [11;13]. As discussed previously [29], this likely indicates that protein conformational factors and an inherently weak thermodynamic driving force combine to limit the interflavin electron transfer in dual-flavin enzymes. The close flavin positioning that is seen in the crystal structures is probably difficult to achieve during catalysis, such that a majority of the interflavin electron transfer may proceed through alternative, less optimally-positioned complexes [14]. The protein conformational motions that help determine inter-flavin electron transfer in semi-closed complexes may be relatively rapid small-scale fluctuations (conformational sampling) [33] that are distinct from the slower, large-scale motions that the FMN domain must undergo to transfer electrons to cytochrome c [14].
Possible mechanistic implications
Our model for electron flux through a dual-flavin enzyme (Fig. 2) is perhaps the simplest model one could conceive, as it involves only four enzyme states. The model has the FNR domain serving as a monophasic source of electrons to reduce the FMNsq. Despite its simplicity, simulations of the model created accurate fits of the experimental traces obtained for cytochrome c reduction by nNOSr and eNOSr [9] during the initial and steady-state phases of the reaction. This outcome is surprising and may have mechanistic implications. Consider the complexity inherent in the system: the two flavin cofactors (FAD + FMN) in dual-flavin enzymes contain a total of 3, 2, and 1 electrons when they cycle during catalysis. This cycling and the known midpoint potentials of the FAD and FMN couples [29] constrain the enzyme to populate five main electron distributions among the flavin cofactors during catalysis, two of which are reactive toward cytochrome c (i.e., that contain FMNhq) (Supplemental Fig. 1). In the FNR domain the FAD cycles between all three of its possible redox states (FADox, FADsq, FADhq) with both the FADsq and FADhq forms being capable of reducing FMNsq during catalysis (Supplemental Fig. 1). On top of this, electron transfer from the FNR domain to FMNsq may be influenced by a number of factors, including NADP(H) binding site occupancy, the redox state of the bound NADP(H) (i.e., NADP+ versus NADPH), and FNR conformational changes [34-36]. In CPR or NOS enzymes, NADP(H) binding site occupancy can also influence the KA setpoint [37-39], and reduction of FAD by NADPH may even be gated by the movement of the FMN domain [40]. Conceivably, such complexity could create a very complicated kinetic model for electron flux where the interflavin electron transfer step is beholden to a multitude of separate FNR species, all subject to multiple equilibrium events. However, we found no need to invoke such complexity in FNR modes to successfully model electron flux through a dual-flavin enzyme like NOS. Indeed, in our simulations we saw that an interflavin electron transfer rate that fit the initial portion of the experimental trace of cytochrome c reduction (in which the reduced NOSr enzyme is undertaking its first interflavin electron transfer during reduction of the first equivalent of cytochrome c), can continue to fit the observed electron flux trace in the multiple-turnover phase of the reaction, where all the aforementioned complexities come into play. This implies that as far as electron flux through nNOSr or eNOSr is concerned, the interflavin electron transfers from FADhq or FADsq are equivalent, and the FNR redox state or NADP(H) occupancy is unimportant. In our simulations we also did not need to include an FMN redox state bias on the conformational equilibrium (i.e., KAsq ≠ KAhq) in order to obtain good fits of the experimental data. On the surface, this suggests that the redox state (FMNsq versus FMNhq) may not significantly impact the conformational equilibrium. However, our model and simulations do not allow a definitive judgment, which will ultimately require making better and more direct measures, as recently discussed [15]. There is indirect evidence that suggests the FMN redox state can influence the conformational equilibrium in CPR under certain circumstances [38]. In any case, we chose here to propose the simplest model that can fit the data. Finally, it is curious that the best fit we obtained for electron flux through nNOSr gave rate values for the interflavin electron transfer (k2) and conformational opening (k-3) steps that were very close in magnitude. Whether this equivalence indicates that the FMNsq reduction step (k2) is gated with the conformational opening step (k-3) is an interesting possibility and remains to be explored.
Methods
The kinetic model describing electron flux through NOSr, as measured by cytochrome c reductase activity (Fig. 2), was simulated using the computer program Gepasi v.3.30 [41]. Cytochrome c was set to be in 100-fold molar excess relative to the flavoprotein. Values for each of the four conformational rates (k1, k-1, k3 and k-3) and the interflavin electron transfer rate (k2) were input into the program. Each simulated reaction began with 100% of the enzyme in the fully reduced state (represented by species d and a in Fig. 2). For simulations of the nNOSr and eNOSr reactions, the initial concentrations of species d and a were determined based on the published KAhq values for nNOSr and eNOSr [9]. In some cases, we used an iterative procedure to obtain best-fit rate values and rate combinations to match a given rate of electron flux through nNOSr or eNOSr.
The “electron flux” is defined as the rate of cytochrome c reduction in the steady-state. This is calculated by fitting the simulated traces for the cytochrome c reduction to a straight line (omitting the initial, non linear portion). Linear fittings were carried out with the Origin Pro 7.5 software (OriginLab, Northampton, MA, USA). The rationale for this calculation is that these traces resemble the experimental results obtained when studying the reactions of NOS reductase domains with cytochrome c. Further details about the simulation procedures are provided in the supplementary material.
Supplementary Material
Acknowledgments
We thank members of the Stuehr laboratory for helpful discussions. This work was supported by National Institutes of Health Grants GM51491 and HL58883 to D. J. S.
Abbreviations
- NOS
nitric oxide synthase
- eNOS
endothelial nitric oxide synthase
- nNOS
neuronal nitric oxide synthase
- NOSoxy
oxygenase domain of NOS
- NOSr
reductase domain of NOS
- CaM
Calmodulin
- CYP
cytochrome P450
- CPR
cytochrome P450 reductase
- FAD
flavin-adenine dinucleotide
- FADsq
one-electron reduced (semiquinone) FAD
- FADhq
two-electron reduced (hydroquinone) FAD
- FMN
flavin mononucleotide
- FMNsq
one-electron reduced (semiquinone) FMN
- FMNhq
two-electron reduced (hydroquinone) FMN
- FNR
Ferredoxin-NADP+-Reductase-like domain
- NADPH
nicotinamide adenine dinucleotide phosphate, reduced form
Footnotes
Supporting Information The following supplementary material is available.
Supplemental Figure 1. Cycling of flavin redox states during cytochrome c reduction by a dual-flavin enzyme.
Supplemental Methods. Simulations of the kinetic model using Gepasi v3.30.
References
- 1.Masters BS. The journey from NADPH-cytochrome P450 oxidoreductase to nitric oxide synthases. Biochem Biophys Res Commun. 2005;338:507–519. doi: 10.1016/j.bbrc.2005.09.165. [DOI] [PubMed] [Google Scholar]
- 2.Murataliev MB, Feyereisen R, Walker FA. Electron transfer by diflavin reductases. Biochim Biophys Acta. 2004;1698:1–26. doi: 10.1016/j.bbapap.2003.10.003. [DOI] [PubMed] [Google Scholar]
- 3.Porter TD, Kasper CB. NADPH-cytochrome P-450 oxidoreductase: flavin mononucleotide and flavin adenine dinucleotide domains evolved from different flavoproteins. Biochemistry. 1986;25:1682–1687. doi: 10.1021/bi00355a036. [DOI] [PubMed] [Google Scholar]
- 4.Finn RD, Basran J, Roitel O, Wolf CR, Munro AW, Paine MJ, Scrutton NS. Determination of the redox potentials and electron transfer properties of the FAD- and FMN-binding domains of the human oxidoreductase NR1. Eur J Biochem. 2003;270:1164–1175. doi: 10.1046/j.1432-1033.2003.03474.x. [DOI] [PubMed] [Google Scholar]
- 5.Ghosh DK, Salerno JC. Nitric oxide synthases: domain structure and alignment in enzyme function and control. Front Biosci. 2003;8:d193–d209. doi: 10.2741/959. [DOI] [PubMed] [Google Scholar]
- 6.Stuehr DJ, Tejero J, Haque MM. Structural and mechanistic aspects of flavoproteins: electron transfer through the nitric oxide synthase flavoprotein domain. FEBS J. 2009;276:3959–3974. doi: 10.1111/j.1742-4658.2009.07120.x. [DOI] [PMC free article] [PubMed] [Google Scholar]
- 7.Wolthers KR, Scrutton NS. Protein interactions in the human methionine synthase-methionine synthase reductase complex and implications for the mechanism of enzyme reactivation. Biochemistry. 2007;46:6696–6709. doi: 10.1021/bi700339v. [DOI] [PubMed] [Google Scholar]
- 8.Craig DH, Chapman SK, Daff S. Calmodulin activates electron transfer through neuronal nitric-oxide synthase reductase domain by releasing an NADPH-dependent conformational lock. J Biol Chem. 2002;277:33987–33994. doi: 10.1074/jbc.M203118200. [DOI] [PubMed] [Google Scholar]
- 9.Ilagan RP, Tiso M, Konas DW, Hemann C, Durra D, Hille R, Stuehr DJ. Differences in a conformational equilibrium distinguish catalysis by the endothelial and neuronal nitric-oxide synthase flavoproteins. J Biol Chem. 2008;283:19603–19615. doi: 10.1074/jbc.M802914200. [DOI] [PMC free article] [PubMed] [Google Scholar]
- 10.Aigrain L, Pompon D, Morera S, Truan G. Structure of the open conformation of a functional chimeric NADPH cytochrome P450 reductase. EMBO Rep. 2009;10:742–747. doi: 10.1038/embor.2009.82. [DOI] [PMC free article] [PubMed] [Google Scholar]
- 11.Garcin ED, Bruns CM, Lloyd SJ, Hosfield DJ, Tiso M, Gachhui R, Stuehr DJ, Tainer JA, Getzoff ED. Structural basis for isozyme-specific regulation of electron transfer in nitric-oxide synthase. J Biol Chem. 2004;279:37918–37927. doi: 10.1074/jbc.M406204200. [DOI] [PubMed] [Google Scholar]
- 12.Hamdane D, Xia C, Im SC, Zhang H, Kim JJ, Waskell L. Structure and function of an NADPH-cytochrome P450 oxidoreductase in an open conformation capable of reducing cytochrome P450. J Biol Chem. 2009;284:11374–11384. doi: 10.1074/jbc.M807868200. [DOI] [PMC free article] [PubMed] [Google Scholar]
- 13.Wang M, Roberts DL, Paschke R, Shea TM, Masters BS, Kim JJ. Three-dimensional structure of NADPH-cytochrome P450 reductase: prototype for FMN- and FAD-containing enzymes. Proc Natl Acad Sci U S A. 1997;94:8411–8416. doi: 10.1073/pnas.94.16.8411. [DOI] [PMC free article] [PubMed] [Google Scholar]
- 14.Xia C, Hamdane D, Shen AL, Choi V, Kasper CB, Pearl NM, Zhang H, Im SC, Waskell L, Kim JJ. Conformational Changes of NADPH-Cytochrome P450 Oxidoreductase Are Essential for Catalysis and Cofactor Binding. J Biol Chem. 2011;286:16246–16260. doi: 10.1074/jbc.M111.230532. [DOI] [PMC free article] [PubMed] [Google Scholar]
- 15.Ilagan RP, Tejero J, Aulak KS, Ray SS, Hemann C, Wang ZQ, Gangoda M, Zweier JL, Stuehr DJ. Regulation of FMN subdomain interactions and function in neuronal nitric oxide synthase. Biochemistry. 2009;48:3864–3876. doi: 10.1021/bi8021087. [DOI] [PMC free article] [PubMed] [Google Scholar]
- 16.Ellis J, Gutierrez A, Barsukov IL, Huang WC, Grossmann JG, Roberts GC. Domain motion in cytochrome P450 reductase: conformational equilibria revealed by NMR and small-angle x-ray scattering. J Biol Chem. 2009;284:36628–36637. doi: 10.1074/jbc.M109.054304. [DOI] [PMC free article] [PubMed] [Google Scholar]
- 17.Hay S, Brenner S, Khara B, Quinn AM, Rigby SE, Scrutton NS. Nature of the energy landscape for gated electron transfer in a dynamic redox protein. J Am Chem Soc. 2010;132:9738–9745. doi: 10.1021/ja1016206. [DOI] [PubMed] [Google Scholar]
- 18.Guan ZW, Kamatani D, Kimura S, Iyanagi T. Mechanistic studies on the intramolecular one-electron transfer between the two flavins in the human neuronal nitric-oxide synthase and inducible nitric-oxide synthase flavin domains. J Biol Chem. 2003;278:30859–30868. doi: 10.1074/jbc.M301929200. [DOI] [PubMed] [Google Scholar]
- 19.Guan ZW, Haque MM, Wei CC, Garcin ED, Getzoff ED, Stuehr DJ. Lys842 in neuronal nitric-oxide synthase enables the autoinhibitory insert to antagonize calmodulin binding, increase FMN shielding, and suppress interflavin electron transfer. J Biol Chem. 2010;285:3064–3075. doi: 10.1074/jbc.M109.000810. [DOI] [PMC free article] [PubMed] [Google Scholar]
- 20.Knight K, Scrutton NS. Stopped-flow kinetic studies of electron transfer in the reductase domain of neuronal nitric oxide synthase: re-evaluation of the kinetic mechanism reveals new enzyme intermediates and variation with cytochrome P450 reductase. Biochem J. 2002;367:19–30. doi: 10.1042/BJ20020667. [DOI] [PMC free article] [PubMed] [Google Scholar]
- 21.Roman LJ, Masters BS. Electron transfer by neuronal nitric oxide synthase is regulated by concerted interaction of calmodulin and two intrinsic regulatory elements. J Biol Chem. 2006;281:23111–23118. doi: 10.1074/jbc.M603671200. [DOI] [PubMed] [Google Scholar]
- 22.Darrouzet E, Moser CC, Dutton PL, Daldal F. Large scale domain movement in cytochrome bc(1): a new device for electron transfer in proteins. Trends Biochem Sci. 2001;26:445–451. doi: 10.1016/s0968-0004(01)01897-7. [DOI] [PubMed] [Google Scholar]
- 23.Gassner GT, Ludwig ML, Gatti DL, Correll CC, Ballou DP. Structure and mechanism of the iron-sulfur flavoprotein phthalate dioxygenase reductase. FASEB J. 1995;9:1411–1418. doi: 10.1096/fasebj.9.14.7589982. [DOI] [PubMed] [Google Scholar]
- 24.Johnson-Winters K, Nordstrom AR, Emesh S, Astashkin AV, Rajapakshe A, Berry RE, Tollin G, Enemark JH. Effects of interdomain tether length and flexibility on the kinetics of intramolecular electron transfer in human sulfite oxidase. Biochemistry. 2010;49:1290–1296. doi: 10.1021/bi9020296. [DOI] [PMC free article] [PubMed] [Google Scholar]
- 25.Mowat CG, Gazur B, Campbell LP, Chapman SK. Flavin-containing heme enzymes. Arch Biochem Biophys. 2010;493:37–52. doi: 10.1016/j.abb.2009.10.005. [DOI] [PubMed] [Google Scholar]
- 26.Pushie MJ, George GN. Active-site dynamics and large-scale domain motions of sulfite oxidase: a molecular dynamics study. J Phys Chem B. 2010;114:3266–3275. doi: 10.1021/jp908731f. [DOI] [PubMed] [Google Scholar]
- 27.Sharp RE, Chapman SK. Mechanisms for regulating electron transfer in multi-centre redox proteins. Biochim Biophys Acta. 1999;1432:143–158. doi: 10.1016/s0167-4838(99)00109-0. [DOI] [PubMed] [Google Scholar]
- 28.Bhattacharyya AK, Hurley JK, Tollin G, Waskell L. Investigation of the rate limiting step for electron transfer from NADPH:cytochrome P450 reductase to cytochrome b5: a laser flash-photolysis study. Arch Biochem Biophys. 1994;310:318–324. doi: 10.1006/abbi.1994.1173. [DOI] [PubMed] [Google Scholar]
- 29.Gutierrez A, Grunau A, Paine M, Munro AW, Wolf CR, Roberts GC, Scrutton NS. Electron transfer in human cytochrome P450 reductase. Biochem Soc Trans. 2003;31:497–501. doi: 10.1042/bst0310497. [DOI] [PubMed] [Google Scholar]
- 30.Stuehr DJ, Santolini J, Wang ZQ, Wei CC, Adak S. Update on mechanism and catalytic regulation in the NO synthases. J Biol Chem. 2004;279:36167–36170. doi: 10.1074/jbc.R400017200. [DOI] [PubMed] [Google Scholar]
- 31.Tejero J, Haque MM, Durra D, Stuehr DJ. A bridging interaction allows calmodulin to activate no synthase through a bi-modal mechanism. J Biol Chem. 2010 doi: 10.1074/jbc.M110.126797. [DOI] [PMC free article] [PubMed] [Google Scholar]
- 32.Adak S, Aulak KS, Stuehr DJ. Chimeras of nitric-oxide synthase types I and III establish fundamental correlates between heme reduction, heme-NO complex formation, and catalytic activity. J Biol Chem. 2001;276:23246–23252. doi: 10.1074/jbc.M102509200. [DOI] [PubMed] [Google Scholar]
- 33.Toogood HS, Leys D, Scrutton NS. Dynamics driving function: new insights from electron transferring flavoproteins and partner complexes. FEBS J. 2007;274:5481–5504. doi: 10.1111/j.1742-4658.2007.06107.x. [DOI] [PubMed] [Google Scholar]
- 34.Aigrain L, Pompon D, Truan G. Role of the interface between the FMN and FAD domains in the control of redox potential and electronic transfer of NADPH-cytochrome P450 reductase. Biochem J. 2011;435:197–206. doi: 10.1042/BJ20101984. [DOI] [PubMed] [Google Scholar]
- 35.Daff S. An appraisal of multiple NADPH binding-site models proposed for cytochrome P450 reductase, NO synthase, and related diflavin reductase systems. Biochemistry. 2004;43:3929–3932. doi: 10.1021/bi0360408. [DOI] [PubMed] [Google Scholar]
- 36.Gutierrez A, Munro AW, Grunau A, Wolf CR, Scrutton NS, Roberts GC. Interflavin electron transfer in human cytochrome P450 reductase is enhanced by coenzyme binding Relaxation kinetic studies with coenzyme analogues. Eur J Biochem. 2003;270:2612–2621. doi: 10.1046/j.1432-1033.2003.03633.x. [DOI] [PubMed] [Google Scholar]
- 37.Daff S. NO synthase: structures and mechanisms. Nitric Oxide. 2010;23:1–11. doi: 10.1016/j.niox.2010.03.001. [DOI] [PubMed] [Google Scholar]
- 38.Grunau A, Paine MJ, Ladbury JE, Gutierrez A. Global effects of the energetics of coenzyme binding: NADPH controls the protein interaction properties of human cytochrome P450 reductase. Biochemistry. 2006;45:1421–1434. doi: 10.1021/bi052115r. [DOI] [PubMed] [Google Scholar]
- 39.Tiso M, Konas DW, Panda K, Garcin ED, Sharma M, Getzoff ED, Stuehr DJ. C-terminal tail residue Arg1400 enables NADPH to regulate electron transfer in neuronal nitric-oxide synthase. J Biol Chem. 2005;280:39208–39219. doi: 10.1074/jbc.M507775200. [DOI] [PubMed] [Google Scholar]
- 40.Welland A, Daff S. Conformation-dependent hydride transfer in neuronal nitric oxide synthase reductase domain. FEBS J. 2010;277:3833–3843. doi: 10.1111/j.1742-4658.2010.07787.x. [DOI] [PubMed] [Google Scholar]
- 41.Mendes P. GEPASI: a software package for modelling the dynamics, steady states and control of biochemical and other systems. Comput Appl Biosci. 1993;9:563–571. doi: 10.1093/bioinformatics/9.5.563. [DOI] [PubMed] [Google Scholar]
Associated Data
This section collects any data citations, data availability statements, or supplementary materials included in this article.


