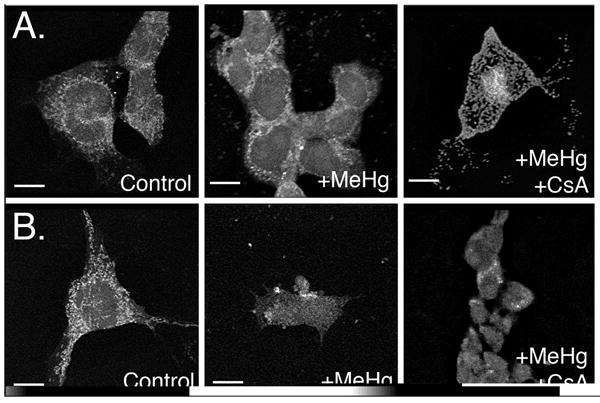
Figure 5.

Representative immunofluorescent confocal images of cytochrome c distribution. Treatment groups are listed on the image. (A) Undifferentiated EC cells exposed to MeHg or MeHg + CsA. (B) Differentiated D5 neurons exposed to MeHg or MeHg and CsA. Scale bars =10 μm.
