

Abstract
The routine workflow for invasive cancer diagnostics includes biopsy processing by formalin fixation and paraffin embedding. It has been shown only recently that this kind of sample can be used for gene expression analysis with microarrays. To support this view, the authors conducted a microarray study using formalin-fixed paraffin-embedded (FFPE) core needle biopsies from breast cancers. Typically, for the 3′-biased chip type that was used, the probe sets interrogate sequences near the poly-A-tail of the transcripts, and this kind of probe turned out to be suitable to measure RNA levels in FFPE biopsies. For ER and HER2, the authors observed strong correlations between RNA levels and protein expression (p = 0.000003 and p = 0.0022). ER and HER2 classification of the biopsies by the RNA levels was feasible with high sensitivity and specificity (AUROC = 0.93 and AUROC = 0.96). Furthermore, a signature of 346 genes was identified that correlated with ER and a signature of 528 genes that correlated with HER2 protein status. Many of these genes (ER: 63%) could be confirmed by analysis of gene expression data from frozen tissues. The findings support the notion that clinically relevant information can be gained from microarray analyses of FFPE cancer biopsies. This opens new opportunities for biomarker detection studies and the integration of microarrays into the workflow of cancer diagnostics.
Keywords: breast cancer, formalin-fixed paraffin-embedded samples, core needle biopsies, gene expression, DNA microarray
Worldwide, the routine diagnostic workflow for the preparation of core needle biopsies of the breast as well as for most other biopsies taken from different organ sites includes immediate formalin fixation and subsequent paraffin embedding. This is because formalin-fixed paraffin-embedded (FFPE) samples are easy to handle, stable, and particularly suitable for diagnostic histology, immunohistochemistry (IHC), and in situ hybridization (ISH). Diagnostic IHC includes staining for the hormone receptors estrogen receptor 1 (ER) and progesterone receptor (PGR), as well as the human epidermal growth factor receptor 2 (HER2). Subsequently, ISH for HER2 gene amplification is performed when needed. Together with clinicopathological parameters such as tumor stage, lymph node status, and tumor grading, the scorings of these biomarkers have strong implications for therapy selection. Lately, it has been suggested that these classic parameters can be complemented by molecular high-throughput methods.
For some of these new methods, including expression profiling with microarrays, it is standard to use fresh or frozen tissues as an RNA source. These samples usually have a high quality of nucleic acid preservation. By contrast, formalin fixation produces significant chemical modifications of the RNA, and these modifications depend on fixation conditions and times (Ribeiro-Silva et al. 2007). Therefore, RNA extracts from FFPE tissues can be of suboptimal quality and difficult to compare between samples. Recent studies have reported that only 25% to 55% of unselected FFPE cancer samples aged 1 to 8 years provided RNA of sufficient quality for successful gene expression analysis with microarrays (Linton et al. 2008; Penland et al. 2007). On the other hand, integration of frozen tissue collection in the diagnostic interdisciplinary workflow is severely hampered by logistic problems (e.g., by the availability of liquid nitrogen as well as transport, slicing, and manufacturing of the frozen tissues). Furthermore, taking core needle biopsies is an invasive procedure that delivers limited amounts of biomaterial that preferably should not be subdivided into frozen and paraffin-embedded tissue parts.
Breast cancer is the most frequent malignant disease of women worldwide (Parkin et al. 2005). Approximately 207,000 new cases leading to nearly 40,000 cancer-related deaths were expected in 2010 in the United States (Jemal et al. 2010). In recent years, gene expression in breast cancers has been studied intensely. Numerous microarray studies have revealed clinically relevant information about tumor biology and correlated gene expression signatures with tumor behavior, such as response to chemotherapy and prognosis of patients (Buyse et al. 2006; Perou et al. 2000; Sørlie et al. 2006). Large prospective studies such as MINDACT and TAILORx are currently being conducted to test whether molecular profiling can contribute to a refined diagnosis of breast cancer and help to stratify breast cancer patients for a more individually tailored, personalized therapy.
Most of the published microarray studies are based on RNA extracts from frozen tissue samples that were collected during breast cancer surgery. In addition, it was shown that microarray-based gene expression profiling of frozen breast cancer biopsies is feasible and helps to uncover important properties of tumor biology (Rody et al. 2006; Rody, Karn, Gätje, et al. 2007; Rody, Karn, Solbach, et al. 2007). Furthermore, several groups recently reported about progress in the adoption of RNA analysis protocols to FFPE specimens (Farragher et al. 2008; Linton et al. 2009). Clinically useful profiles of FFPE samples were obtained using a range of microarray platforms, including custom-made spotted arrays and commercial platforms from Illumina (April et al. 2009; Bibikova et al. 2007; Nakagawa et al. 2008; Ravo et al. 2008), Affymetrix (Frank et al. 2007; Linton et al. 2008; Scicchitano et al. 2006; Srivastava et al. 2008), and Agilent (Coudry et al. 2007; Fedorowicz et al. 2009).
The aim of this study is to support the hypothesis that the combination of histological and immunohistochemical diagnostics with genome-wide expression profiling is feasible using routinely collected FFPE biopsies. To this end, RNA was extracted from two 10-µm sections of breast cancer FFPE core needle biopsies, amplified with PCR, and further processed for hybridization to Affymetrix GeneChip microarrays. To our knowledge, this is the first genome-wide microarray gene expression profiling study using FFPE breast cancer biopsies as an RNA source.
Materials and Methods
Study Population
In this retrospective study, unselected archival core needle biopsy tissue taken from 24 patients for routine diagnostic purposes at the Charité University Hospital between 2003 and 2004 was used. Biopsies were reevaluated by two experienced pathologists (Weichert W, Denkert C) according to histological tumor type, grade, and ER, PGR, and HER2 expression. As an inclusion criterion, biopsies had to consist of at least 40% tumor cells (mean 62.2%, SD 10.4%; range, 40-90%). Fourteen cases were classified as ER positive, and 6 cases were HER2 positive as determined by IHC and silver in situ hybridization (SISH) according to criteria applied in routine diagnostic pathology (Remmele and Stegner 1987; Wolff et al. 2007). IHC and ISH data were not taken from the clinical record, but IHC and ISH experiments were repeated for the purpose of this study. Two tumors (8.3%) were classified as well differentiated (G1), 11 tumors (45.8%) were moderately differentiated (G2), and 11 tumors (45.8%) showed poor tumor differentiation (G3), according to World Health Organization (WHO) grading (Elston and Ellis 2002). Annotations for each of the biopsies are available from the Gene Expression Omnibus (GEO) repository (GSE11001).
Processing of FFPE Biopsies and Expression Profiling
RNA was isolated using the High Pure RNA Paraffin Kit (Roche Diagnostics GmbH, Mannheim, Germany) from two 10-µm sections from each of the 24 FFPE core needle biopsies. After deparaffinization using xylene, the tissue was homogenized by overnight incubation with proteinase K. The nucleic acids were purified via spin columns, and residual DNA was digested by DNAse treatment.
As the biopsy sections yielded not enough RNA for the standard labeling procedure, RNA extracts were amplified using the Microarray Target Amplification Kit (Roche Diagnostics GmbH). In short, 150 ng of total RNA was used for double-stranded cDNA synthesis that was amplified with PCR for 30 to 32 cycles. Then, 200 ng of PCR product was transcribed into biotin-labeled cRNA using the MEGAscript T7 High Yield Transcription Kit (Ambion, Warrington, UK), as well as Biotin-11-CTP and Biotin-16-UTP (PerkinElmer, Rodgau, Germany). After incubation for 5 hr at 37C, the transcription product was column purified with the RNeasy Mini Kit (Qiagen, Valencia, CA). cRNA was precipitated with ethanol, fragmented, and stored at −20C.
Ten µg of biotin-labeled cRNA was hybridized to Affymetrix HG-U133 Plus 2.0 chips in a Hybridization Oven 640 (Affymetrix, Santa Clara, CA). After 16-hr rotation at 45C, arrays were washed and stained with the Affymetrix Fluidics Station FS-450 using the Fluidics Protocol EukGE-WS2v4. The cRNA was stained with streptavidin-phycoerythrin conjugate (SAPE; Invitrogen, Karlsruhe, Germany), incubated with a biotinylated antistreptavidin antibody (Axxora, Lörrach, Germany), and then stained again with SAPE. Chip scanning was done with the laser GeneChip Scanner 3000 7G equipped with an AutoLoader (Affymetrix).
Benchmark Microarray Data of Frozen Tissue Samples
A gene expression data set of frozen breast cancers (GSE5460, 129 samples) was obtained from the GEO repository (http://www.ncbi.nlm.nih.gov). The data set was produced at the Dana-Farber Cancer Institute and well suited for comparison with the Charité data, as it was generated on the same platform, the Affymetrix HG-U133 Plus 2.0 chips. For comparison of Charité and Dana-Farber data, we wanted to work with equal sample sizes. For quality analyses, we subsampled the Dana-Farber data to the first 24 samples (the technical quality of the first 24 samples was comparable to the technical quality of the entire cohort). For comparison of the gene lists, we applied a multiple random subsampling protocol: We randomly drew 10 subsets containing 24 samples from the Dana-Farber data that had the same distribution of ER and HER status as the Charité samples. Results were reported in terms of average value and standard deviation over these 10 subsets.
Processing and Quality Control of the Biopsy Microarray Data
The gene expression profiles of the FFPE biopsies are available from the GEO repository (GSE11001). All data processing was executed under the statistical programming language R (http://www.r-project.org).
A first round of quality control was performed using the raw chip data (*.cel files). The 11 perfect-match (PM) probe measurements of each probe set were extracted and ordered with respect to their distance from transcription start of the gene. Then, the mean expression value over all probe sets (log2 scale) was plotted dependent on the distance of the probes from the transcription start. The corresponding curve is referred to as the RNA fragmentation curve.
Signals and detection calls were calculated with the R package affy according to the standard MAS 5.0 protocol of the chip manufacturer. Data were transformed to the log2 scale. Three standard quality numbers were derived from the 3′/5′ ratio of pairs of probe sets interrogating the genes ACTB, GAPDH, and STAT1.
Three more quality numbers were calculated as follows: Straight lines were fitted to the RNA fragmentation curves, and the slopes were taken as the quality number for the sample RNA. Furthermore, the percentage of present calls and the correlation index were calculated. The latter was defined as the mean value over the Pearson correlations of a considered sample with each sample in the cohort. Intercohort differences of quality numbers were assessed by the Wilcoxon test.
Unsupervised Analysis of the FFPE Biopsy Microarray Data
Principal component analysis (PCA) was performed using the function prcomp() from the R package stats. The 24 principal components were checked for differing between ER+ and ER− tumors, and significance was assessed by Welch’s t-test. Agglomerative hierarchical clustering was performed using the function hcluster() from the R package amap. For clustering, similarity was measured by Pearson correlations, and the average linkage method was applied to measure distances between clusters.
Correlation of ER and HER2 Protein Immunohistochemistry with Microarray-measured Gene Expression
Microarray data of ER and HER2 transcripts were checked for differential expression between immunohistological positive and negative tumors. Significance was assessed by Welch’s t-test. Using the immunohistologically determined status of ER and HER2 as the gold standard, sensitivity and specificity were calculated using varying cut-offs for the microarray data. Receiver operating characteristic (ROC) curves were plotted to assess the feasibility of ER and HER2 status determination from microarray data.
Gene Expression Phenotypes Associated with ER and HER2 Status
Immunohistochemical ER and HER2 positive versus negative biopsies were compared. Each of the 54,675 probe sets on the microarray was assessed for differential expression by Welch’s t-test and included in a list of differentially expressed genes when it passed the threshold p < 0.005. In addition, we used a more stringent threshold, p < 0.00001. A permutation analysis was executed to cope with the multiple testing problem as before (Hlubek et al. 2007). In short, 100 random sample permutations were drawn, and a number nexp was calculated as the mean value of the numbers of detected probe sets in the permutated data sets. The expected number of probe sets nexp was compared to the number of observed sets nobs that were detected by the immunohistochemical grouping of samples. The false discovery rate was estimated as quotient nexp/nobs. Overlaps between gene lists were calculated after projection of the probe sets to gene symbols. Significance assessment for the overlap gene lists was done by comparison with the hypergeometric distribution. Heat maps of gene lists were created using the R function heatmap() from the package stats.
Results
Gene Expression Data
Expression profiles of 24 FFPE breast cancer biopsies were generated by hybridization to Affymetrix GeneChips. We wanted to compare the data generated from FFPE biopsies to expression profiles of frozen tissues that represent a benchmark. For these purposes, we have analysed our data in parallel with a publicly available expression data set (frozen tissue data, Dana-Farber Cancer Institute, Boston, MA) that was generated on the same chip platform.
Technical Quality of the Microarray Data
Figure 1A shows the perfect-match intensities dependent on the distance of a probe from transcription start. In detail, probes were numbered from 1 to 11 inside each probe set, and the average intensity over all probe sets was plotted dependent on the number of each probe. These plots, referred to as RNA fragmentation curves, increase slightly from the 5′ to the 3′ end of the transcripts.
Figure 1.

Technical quality control of the biopsy gene expression data. Comparison of RNA extracts from formalin-fixed paraffin-embedded (FFPE) core biopsies (Charité) and RNA extracts from frozen tissues (Dana-Farber). (A) RNA fragmentation curves showing the dependence of the signal intensity on the distance of the probes from transcription start. The curves are based on the raw data of all 54,130 probe sets that are composed of 11 probe pairs. Each line represents an average over the perfect-match intensities generated by an RNA extract: Charité FFPE biopsies (n = 24, green lines) and Dana-Farber frozen tissues (n = 24, blue lines). Box plots show the distribution of key numbers for quality control: (B-D) 3′/5′ ratio for ACTB, GAPDH, and STAT1 measured as a ratio of probe sets located in the 3′ and 5′ regions of the gene, (E) slope of the RNA degradation curve, (F) number of present calls reported by the Affymetrix detection algorithm (percentage of the total number of probe sets), and (G) correlation index (mean correlation of a sample with each sample in the cohort).
Figure 1B-D shows the distribution of three standard quality numbers, the 3′/5′ ratio calculated from probe sets that interrogate the 3′ and 5′ regions of the genes ACTB, GAPDH, and STAT1. Different from frozen tissues, this ratio was very high in the FFPE biopsy data for ACTB (mean 85.1) and GAPDH (mean 406.8). However, these numbers do not represent a typical situation of transcript interrogation for the used chip type, as the 5′ control probe sets are located far away (more than 1000 bps) from the 3′ ends of the transcripts.
As shown in Figure 1E, RNA fragmentation curves for the FFPE core biopsies (mean slope = 0.036) were steeper than the curves for the frozen tissue samples (mean slope = 0.014). The highest slope of an RNA fragmentation curve of an FFPE core biopsy corresponds to a fold change of 1.47 between the outermost 3′ and the outermost 5′ probe, compared to a fold change of 1.20 for the worst frozen tissue sample.
Furthermore, we looked for the number of probe sets that were detected as present by the Affymetrix algorithm (Fig. 1F). Mean values for the percentages of detected transcripts were 21% (FFPE core biopsies) and 41% (frozen tissue samples). Finally, we have calculated the Pearson correlation between each pair of expression signatures for the FFPE core biopsies and for the frozen tissue samples (Fig. 1G). The mean correlation was 0.56 (FFPE core biopsies) compared to 0.80 (frozen tissue samples).
Unsupervised Analysis of the FFPE Biopsy Microarray Data
PCA of the biopsy data was executed, and the first three principal components (PCs) of each tumor were shown dependent on ER status (Fig. 2A,B). The first PC explained 18.4%, the second PC 5.6%, and the third PC 4.6% of the total variance. The second and third PCs turned out to be significantly changed between ER+ and ER− tumors (p = 0.004 and p = 0.025, Welch’s t-test).
Figure 2.

Unsupervised analysis of the formalin-fixed paraffin-embedded (FFPE) biopsy microarray data. (A, B) Principal component analysis yields significantly different second and third principal components depending on ER status. (C) Unsupervised hierarchical clustering using all 54,675 probe sets on the microarray. (D) Unsupervised hierarchical clustering based on a gene list published by Gruvberger et al. (2001) (81 probe sets).
Unsupervised hierarchical clustering of the biopsy data using all 54,675 probe sets did not result in a good separation between ER+ and ER− tumors (Fig. 2C). However, hierarchical clustering using 81 probe sets that interrogated a list of differentially expressed genes that was published before (Gruvberger et al. 2001) led to an almost perfect separation between ER+ and ER− tumors (Fig. 2D). A homogeneous cluster was formed by the ER+ tumors containing all of them with the exception of two that clustered together with the ER− tumors.
Correlation of ER and HER2 Protein Immunohistochemistry with Microarray-Measured Gene Expression
Using the microarray data, we have looked for differential expression of the ER transcript in ER+ compared to ER− tumors, as classified by immunohistochemistry. Of nine probe sets for the ER gene, a single reporter (205225_at) detected significant differential expression between ER+ and ER− biopsies (p = 0.000003, Welch’s t-test; Fig. 3A). The same kind of analysis was performed for the HER2 transcript. Again, of three probe sets for the HER2 gene, a single reporter (216826_s_at) detected significant differential expression between HER2+ and HER2− biopsies (p = 0.0022, Welch’s t-test; Fig. 3B). In both cases, the differing performance of different probe sets can be explained by the location of their target sequences within the interrogated genes (cf. Discussion section).
Figure 3.

Correlation of formalin-fixed paraffin-embedded (FFPE) biopsy microarray data with protein expression. ER RNA expression is measured by probe set 205225_at and HER2 RNA expression by probe set. ER and HER2 protein status is determined by immunohistochemistry and SISH. (A) Differential ER RNA expression between ER+ and ER− biopsies. (B) Receiver operating characteristic (ROC) curve showing a strong separation between ER+ and ER− biopsies. (C) Differential HER2 RNA expression between HER2+ and HER2− biopsies. (D) ROC curve showing a strong separation between HER2+ and HER2− biopsies.
Furthermore, we analyzed the feasibility of ER and HER2 status determination by the microarray data. To this end, the IHC results were taken as the gold standard, and ROC curves were plotted by varying cut-offs on ER and HER2 expression (Fig. 3C,D). Using a cut-off of 10 for the probe set 205225_at led to a sensitivity of 85.7% and a specificity of 100% for determination of ER status. Using a cut-off of 12 for the probe set 216826_s_at led to a sensitivity of 100% and a specificity of 83.3% for determination of HER2 status.
Gene Expression Phenotypes Associated with ER and HER2 Status
To uncover the gene expression phenotypes connected with the activity of ER (or HER2), we have identified differentially expressed genes between IHC positive and negative tumors. The genes were selected by the threshold p < 0.005 on the p-values from Welch’s t-test. Table 1 gives an overview on the number of transcripts in the gene lists for the Charité data (n = 24), the Dana-Farber data (n = 129), and repeatedly subsampled data sets (n = 24) from the Dana-Farber data. For each of the gene lists, false discovery rates (FDRs) were estimated by a permutation method.
Table 1.
ER and HER2 Gene Expression Phenotypes
| Protein (Positive vs Negative, Charité Data) | Charité (n = 24) | Dana-Farber (Subsampled, n = 24) | Dana-Farber (n = 129) |
|---|---|---|---|
| ER (14 ER+ vs 10 ER−) | 414 (FDR = 53%) | 2482 ± 1483 (FDR = 11 ± 6%) | 9756 (FDR = 1.9%) |
| HER2 (6 HER2+ vs 18 HER2−) | 606 (FDR = 62%) | 441 ± 220 (FDR = 88 ± 14%) | 654 (FDR = 39%) |
The number of differential expressed transcripts between ER+ and ER− as well as HER2+ and HER2− breast cancer samples is presented. The condition p < 0.005 (Welch’s t-test) was used as a threshold for inclusion of a probe set into a gene list. False discovery rates (FDRs) were estimated by a permutation method. Results are shown for the Charité data (n = 24), subsampled Dana-Farber data (n = 24), and the complete Dana-Farber data (n = 129). Subsampling analysis was done by partition of the Dana-Farber cohort in non-overlapping subsets that included the same number of positive and negative tumors as the Charité cohort. Subsequently, mean value and standard deviation over these subsets were calculated and reported.
A more stringent threshold of p < 0.00001 led to the identification of five differentially expressed transcripts between ER+ and ER− biopsies at an estimated FDR of 6%. A heat map of the biopsy data with respect to these genes is shown in Figure 4A. Hierarchical clustering of the samples yielded an almost perfect separation of ER+ and ER− biopsies. Furthermore, at the stringent p-value threshold, three differentially expressed transcripts could be identified between HER+ and HER2− biopsies (Fig. 4B). Hierarchical clustering of the samples with respect to these genes yielded a perfect separation of HER2+ and HER2− biopsies.
Figure 4.
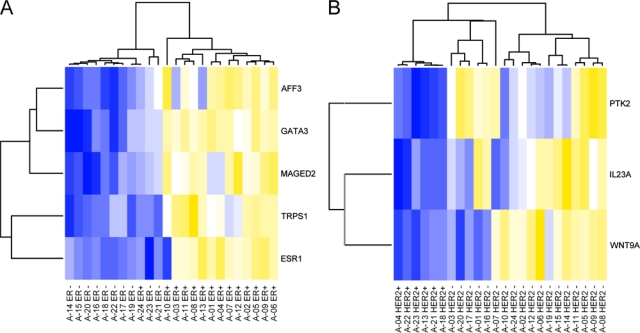
Heat maps of highly significant (p < 0.00001) differentially expressed genes between ER+ and ER− biopsies (A) and HER2+ and HER2− biopsies (B). Colors encode underexpression (blue), mean expression (white), and overexpression (yellow). Hierarchical clustering yields an almost perfect separation between ER+ and ER− biopsies and a perfect separation between HER+ and HER2− biopsies.
An overlap analysis was performed to quantify the reproducibility of the identified gene lists (Table 2). This analysis was performed on the level of genes; that is, probe sets were projected to the interrogated genes prior to calculation of overlaps. It turned out that 63% of the 346 genes that were found to be differentially expressed between ER+ and ER− tumors in the Charité cohort were found to be differentially expressed in the Dana-Farber cohort as well. Furthermore, 5% of the 528 genes that were found to be differentially expressed between HER2+ and HER2− tumors of the Charité cohort were found to be differentially expressed in the Dana-Farber cohort. This comparatively poor overlap may be a consequence of the great variability of tumor biology that is observed for HER2+ tumors (cf. Discussion section). Nevertheless, the size of the overlap between the gene list identified from the Charité data and the Dana-Farber data was significant for both the ER phenotype (p = 4e-36) and the HER2 phenotype (p = 0.0049).
Table 2.
Confirmation of the Gene Expression Phenotypes
| Protein | Charité | Overlap Charité/Dana-Farber |
|---|---|---|
| ER | 346 | 219 (p = 4e-36) |
| HER2 | 528 | 24 (p = 0.0049) |
We performed an overlap analysis of the gene lists obtained from the 24 formalin-fixed paraffin-embedded biopsies (Charité) and the ones obtained from the 129 frozen tissues (Dana-Farber Cancer Institute). A gene was selected whenever one of the interrogating array probe sets was passing the condition p < 0.005 (Welch’s t-test). The table contains the total numbers of the genes found in the Charité data, the number of genes in the overlap sets, and the significance of the overlaps (p-values from comparison with the hypergeometric distribution).
Discussion
This study provides a proof of principle that relevant information about tumor biology can be extracted by microarray analyses of routine FFPE breast cancer biopsies. The protocol for RNA processing included a PCR-based amplification step using T7-oligo(dT) primers that has been validated before together with microarrays (Klur et al. 2004). This 3′-biased amplification method was combined with a 3′-biased chip technology with probe sets that are typically located within a 600-bp distance from the 3′ end of genes. We have observed only slightly inferior quality of RNA extracts from years-old unselected archival FFPE core biopsies compared to frozen tissue samples, which is surprising given the fact that formalin fixation produces significant chemical modification of the RNA that depend on fixation conditions and times. A key success factor might be that the processing of core needle biopsies is more standardized compared to the general routine processing of other FFPE tissue samples. Fixation conditions such as time between resection and fixation, formalin concentration, temperature, and incubation time should be kept as uniform as possible.
As standard quality numbers, we have calculated the 3′/5′ ratio from probe sets interrogating the 3′ and 5′ regions of three control genes. However, as the 3′ probe sets for these genes are located at a distance of more than 1000 bp away from the 3′ end of transcripts, they should be considered as not convenient for quality assessment of fragmented RNA from FFPE samples. As a more convenient quality number, the slope of RNA fragmentation curves was calculated and found significantly steeper for the FFPE core biopsies compared to the frozen tissue samples (p = 3.6e-09, Wilcoxon test). Another effect was the reduction of the number of detected transcripts (present calls) in the FFPE core biopsies to 21% compared to 41% for the frozen tissue samples; this reduction was significant (p = 4.0e-15, Wilcoxon test). These quality losses can be interpreted as consequence of a lower abundance of intact RNAs having sufficient length and a poly-A-tail. Other gene expression technologies, such as the cDNA-mediated annealing, selection, and ligation (DASL) assay (April et al. 2009), use random priming and therefore do not depend on poly-A-tailed transcripts. However, these approaches have the disadvantage of co-amplifying non-coding RNAs and lead to larger background noise. Comparison of oligo(dT) and random priming approach should be addressed in further studies on expression profiling of FFPE biopsies.
The main hypothesis of this study is that despite these limitations, diagnostically relevant information can be obtained from the gene expression profiles of the biopsies. To evaluate this hypothesis, we have conducted a systematic analysis of relevant clinical biomarkers and signatures. An unsupervised analysis showed that the ER status is among the major contributors to the overall variance of the microarray data. A good separation between ER+ and ER− samples could be obtained in the plane of the second and third PCs.
A check of diagnostic quality was performed by looking at the measurements for ER and the HER2 transcripts. For each of these genes, a single probe set detected significant changes between IHC positive and negative tumors and reported high fold changes of 18.6 (ER) and 12.4 (HER2), respectively. Furthermore, we observed a strong but less than perfect correlation between microarray-determined ER and HER2 status and the current gold standard based on IHC and ISH. Our result is in line with other studies on the determination of ER and HER2 status: RT-PCR-based assessment of ER status in FFPE tissues led to an agreement between 91% and 98%, whereas HER2 status assessment showed somewhat lower concordance in the published studies (Badve et al. 2008; Iverson et al. 2009; Ma et al. 2006; Müller et al. 2010). In a microarray study using fresh-frozen and RNA later stored samples, an agreement of 88% to 96% for ER status and of 89% to 93% for HER2 status was obtained (Gong et al. 2007). The ROC curves of our study support the view that agreements of about 90% can be obtained by the analysis of FFPE samples with microarrays as well.
All other probe sets for ER and HER2 failed to measure significant differential expression between the biopsies. For both genes, the functional reporters are the ones that interrogate the 3′ UTR of the transcripts, in contrast to non-functional reporters that interrogate sequences located more 5′. This can be explained by the fragmentation of RNA in FFPE samples as the poly-A-tail of the mRNAs is targeted by a T7-oligo(dT) primer during the preparation of the hybridization cocktail. In summary, these observations suggest that reporters interrogating sequences near to the poly-A-tail of the transcribed genes are suitable to measure RNA levels in FFPE biopsies. However, it should be emphasized that even for frozen tissue samples, the ER probe sets show a reduced performance with increased distance from the 3′ end of the gene (see Fig. 5). Even for frozen tissues, only for the probe set in the 3′ UTR of the gene is the fold change between ER+ and ER− breast cancers greater than 1 with 95% confidence.
Figure 5.

Fold change between ER+ and ER− tumors measured by nine probe sets that interrogate the ER transcript. Data points with 90% confidence intervals for frozen tissue samples (blue) and formalin-fixed paraffin-embedded (FFPE) biopsies (green). For both the FFPE biopsy and the frozen tissue data, only a single probe set (205225_at, located in the 3′ UTR of the gene) yields a fold change greater than 1 with 95% confidence.
Next, we have identified gene expression phenotypes associated with the protein status of ER and HER2 from the FFPE biopsy data. Early genomic-scale gene expression studies on breast cancer observed distinct gene expression phenotypes depending on ER status (Gruvberger et al. 2001; van’t Veer et al. 2002). The latter work by van’t Veer et al. (2002) reported on differential expression of 2640 transcripts corresponding to 1684 genes that are represented by the HG-U133 Plus 2.0 chip. Of the 346 differentially expressed genes identified from the ER+ and ER− biopsies, 92 were included in the list obtained by van’t Veer et al. and 219 in the list that we obtained from the Dana-Faber data. As a result, we got the following confirmation rates for the gene list from the FFPE biopsies: 27% of the identified genes could be confirmed by expression profiling of frozen tissues with cDNA microarrays (van’t Veer data), whereas 63% of the identified genes could be confirmed by expression profiling of frozen tissues with the same type of oligonucleotide chip (Dana-Farber data). Both overlaps are highly significant (p = 2.3e-24 and p = 4.0e-36).
Comparison of HER2+ and HER2− biopsies led to the identification of 528 differentially expressed genes. Of these genes, only 5% overlapped with the gene list identified from the Dana-Farber data (p = 0.0049). However, recent studies support the distinctive nature of HER2+ breast cancers, which is primarily driven by HER2 gene amplification (Järvinen and Liu 2003; Kauraniemi and Kallioniemi 2006; Moasser 2007; Vanden Bempt et al. 2007). Depending on amplicon size, a variable number of genes can be coamplified and overexpressed together with HER2. The amplicon size may change and is even reported to correlate with response to trastuzumab therapy. We believe that the poorer overlap for the HER2 phenotype compared to the ER phenotype can be partly explained by a greater variability of the tumor biology of HER2+ tumors compared to ER+ tumors.
A methodical difficulty in the analysis of microarray data is connected with the measurement of a large number of genes in a comparatively small number of samples, which leads to a multiple testing problem. In the analysis of microarray data, it is usually too stringent to enforce control over the family-wise error rate by applying strict algorithms such as the Bonferroni method. As a consequence, gene selection always includes a trade-off between sensitivity and specificity. Perfect agreement between gene lists cannot be expected in this context (Ein-Dor et al. 2005).
Furthermore, we have identified five differentially expressed genes between ER+ and ER− biopsies at a more stringent threshold of p < 0.00001. All of these five genes are contained in the list published by van’t Veer et al. (2002). Clustering with respect to these genes led to an almost perfect separation between ER+ and ER− biopsies. Comparing HER2+ and HER2− biopsies, three genes passed the more stringent p-value threshold. The top gene out of these, PTK2, turns out to be significant even after Bonferroni correction (p = 0.00000013). Interestingly, strong correlations between PTK2, also known as focal adhesion kinase (FAK), and HER2 expression have been described in nodal negative breast cancer before (Schmitz et al. 2005).
A wealth of data from all major tumor types has shown that gene expression profiling can contribute to prediction of prognosis, treatment response, and probability of metastasis. In this context, ER and HER2 status could be determined and reported simultaneously with other more complex predictive and prognostic signatures from the same microarray experiment. However, the fact that such profiling is still very expensive when compared to RT-PCR and immunohistochemistry and that usually fresh-frozen tissue is required has, apart from few exceptions, restricted the translation of these results into the diagnostic setting. In contrast, often microarray screening builds the basis for the development of biomarkers, which can be measured by simpler detection techniques. Nevertheless, specifically in the field of breast cancer, there are some examples of RNA array-based tests that are developed or have recently been cleared for routine diagnostics, the most prominent being MammaPrint, which was commercialized by Agendia (Ross 2009). Because technological advances will lead to a continuous fall of array prices and because we and others have shown that array profiling from FFPE tissue is feasible, we believe that more of these tests will be cleared for routine diagnostics in the foreseeable future. However, whether these tests will be truly accepted and used by oncologists and cancer patients remains to be seen.
The tissue blocks analyzed in this study were obtained at the Charité Hospital for diagnostic purposes between 2003 and 2004. Our results show that microarray analysis of FFPE tissue samples more than 5 years old is feasible, and we expect that results for a few-day-old blocks analyzed within the routine workflow would be at least equally good or even better. Furthermore, there are large collections of FFPE tissues in pathology departments all over the world. Analysis of these samples with microarrays represents a great new perspective for biomarker research.
In summary, we have shown that relevant information about tumor biology can be extracted from microarray analyses of routine FFPE breast cancer biopsies. In particular, ER and HER2 classification of FFPE biopsies by microarray-measured RNA levels is feasible, and the corresponding gene expression phenotypes overlap with results from fresh-frozen tissues. This opens promising new opportunities for the integration of gene expression analysis into the FFPE sample-based routine workflow of breast cancer diagnostics. Using FFPE biopsies, microarray analyses can be performed preoperatively and in parallel to histology and immunohistochemistry from the same material used for diagnostics. As a consequence, the full molecular diagnostic spectrum can be executed early and exploited for an optimized and individualized treatment of patients. This is particularly important when increasingly popular neoadjuvant treatment is planned.
Footnotes
The author(s) declared no potential conflicts of interest with respect to the authorship and/or publication of this article.
The author(s) disclosed receipt of the following financial support for the research and/or authorship of this article: This project was funded by the BMBF (grant #01ES0725; NEO-PREDICT) and by the European Commission (FP7 grant #200327; METAcancer).
References
- April C, Klotzle B, Royce T, Wickham-Garcia E, Boyaniwsky T, Izzo J, Cox D, Jones W, Rubio R, Holton K, et al. 2009. Whole-genome gene expression profiling of formalin-fixed, paraffin-embedded tissue samples. PLoS ONE. 4:e8162. [DOI] [PMC free article] [PubMed] [Google Scholar]
- Badve SS, Baehner FL, Gray RP, Childs BH, Maddala T, Liu M, Rowley SC, Shak S, Perez EA, Shulman LJ, et al. 2008. Estrogen- and progesterone-receptor status in ECOG 2197: comparison of immunohistochemistry by local and central laboratories and quantitative reverse transcription polymerase chain reaction by central laboratory. J Clin Oncol. 26:2473-2481 [DOI] [PubMed] [Google Scholar]
- Bibikova M, Chudin E, Arsanjani A, Zhou L, Garcia EW, Modder J, Kostelec M, Barker D, Downs T, Fan J, et al. 2007. Expression signatures that correlated with Gleason score and relapse in prostate cancer. Genomics. 89:666-672 [DOI] [PubMed] [Google Scholar]
- Buyse M, Loi S, van’t Veer L, Viale G, Delorenzi M, Glas AM, d’Assignies MS, Bergh J, Lidereau R, Ellis P, et al. 2006. Validation and clinical utility of a 70-gene prognostic signature for women with node-negative breast cancer. J Natl Cancer Inst. 98:1183-1192 [DOI] [PubMed] [Google Scholar]
- Coudry RA, Meireles SI, Stoyanova R, Cooper HS, Carpino A, Wang X, Engstrom PF, Clapper ML. 2007. Successful application of microarray technology to microdissected formalin-fixed, paraffin-embedded tissue. J Mol Diagn. 9:70-79 [DOI] [PMC free article] [PubMed] [Google Scholar]
- Ein-Dor L, Kela I, Getz G, Givol D, Domany E. 2005. Outcome signature genes in breast cancer: is there a unique set? Bioinformatics. 21:171-178 [DOI] [PubMed] [Google Scholar]
- Elston CW, Ellis IO. 2002. Pathological prognostic factors in breast cancer: I. The value of histological grade in breast cancer: experience from a large study with long-term follow-up. Histopathology. 41:154-161 [PubMed] [Google Scholar]
- Farragher SM, Tanney A, Kennedy RD, Paul Harkin D. 2008. RNA expression analysis from formalin fixed paraffin embedded tissues. Histochem Cell Biol. 130:435-445 [DOI] [PubMed] [Google Scholar]
- Fedorowicz G, Guerrero S, Wu TD, Modrusan Z. 2009. Microarray analysis of RNA extracted from formalin-fixed, paraffin-embedded and matched fresh-frozen ovarian adenocarcinomas. BMC Med Genomics. 2:23. [DOI] [PMC free article] [PubMed] [Google Scholar]
- Frank M, Döring C, Metzler D, Eckerle S, Hansmann M. 2007. Global gene expression profiling of formalin-fixed paraffin-embedded tumor samples: a comparison to snap-frozen material using oligonucleotide microarrays. Virchows Arch. 450:699-711 [DOI] [PubMed] [Google Scholar]
- Gong Y, Yan K, Lin F, Anderson K, Sotiriou C, Andre F, Holmes FA, Valero V, Booser D, Pippen JEJ, et al. 2007. Determination of oestrogen-receptor status and ERBB2 status of breast carcinoma: a gene-expression profiling study. Lancet Oncol. 8:203-211 [DOI] [PubMed] [Google Scholar]
- Gruvberger S, Ringnér M, Chen Y, Panavally S, Saal LH, Borg A, Fernö M, Peterson C, Meltzer PS. 2001. Estrogen receptor status in breast cancer is associated with remarkably distinct gene expression patterns. Cancer Res. 61:5979-5984 [PubMed] [Google Scholar]
- Hlubek F, Brabletz T, Budczies J, Pfeiffer S, Jung A, Kirchner T. 2007. Heterogeneous expression of Wnt/beta-catenin target genes within colorectal cancer. Int J Cancer. 121:1941-1948 [DOI] [PubMed] [Google Scholar]
- Iverson AA, Gillett C, Cane P, Santini CD, Vess TM, Kam-Morgan L, Wang A, Eisenberg M, Rowland CM, Hessling JJ, et al. 2009. A single-tube quantitative assay for mRNA levels of hormonal and growth factor receptors in breast cancer specimens. J Mol Diagn. 11:117-130 [DOI] [PMC free article] [PubMed] [Google Scholar]
- Järvinen TAH, Liu ET. 2003. Topoisomerase IIalpha gene (TOP2A) amplification and deletion in cancer—more common than anticipated. Cytopathology. 14:309-313 [DOI] [PubMed] [Google Scholar]
- Jemal A, Siegel R, Xu J, Ward E. 2010. Cancer statistics, 2010. CA Cancer J Clin. 60:277-300 [DOI] [PubMed] [Google Scholar]
- Kauraniemi P, Kallioniemi A. 2006. Activation of multiple cancer-associated genes at the ERBB2 amplicon in breast cancer. Endocr Relat Cancer. 13:39-49 [DOI] [PubMed] [Google Scholar]
- Klur S, Toy K, Williams MP, Certa U. 2004. Evaluation of procedures for amplification of small-size samples for hybridization on microarrays. Genomics. 83:508-517 [DOI] [PubMed] [Google Scholar]
- Linton K, Hey Y, Dibben S, Miller C, Freemont A, Radford J, Pepper S. 2009. Methods comparison for high-resolution transcriptional analysis of archival material on Affymetrix Plus 2.0 and Exon 1.0 microarrays. Biotechniques. 47:587-596 [DOI] [PubMed] [Google Scholar]
- Linton KM, Hey Y, Saunders E, Jeziorska M, Denton J, Wilson CL, Swindell R, Dibben S, Miller CJ, Pepper SD, et al. 2008. Acquisition of biologically relevant gene expression data by Affymetrix microarray analysis of archival formalin-fixed paraffin-embedded tumours. Br J Cancer. 98:1403-1414 [DOI] [PMC free article] [PubMed] [Google Scholar]
- Ma X, Hilsenbeck SG, Wang W, Ding L, Sgroi DC, Bender RA, Osborne CK, Allred DC, Erlander MG. 2006. The HOXB13:IL17BR expression index is a prognostic factor in early-stage breast cancer. J Clin Oncol. 24:4611-4619 [DOI] [PubMed] [Google Scholar]
- Moasser MM. 2007. The oncogene HER2: its signaling and transforming functions and its role in human cancer pathogenesis. Oncogene. 26:6469-6487 [DOI] [PMC free article] [PubMed] [Google Scholar]
- Müller BM, Kronenwett R, Hennig G, Euting H, Weber K, Bohmann K, Weichert W, Winzer KW, Kristiansen G, Petry C, et al. 2010. Quantitative determination of estrogen receptor, progesterone receptor andHER2 mRNA in formalin-fixed paraffin-embedded tissue: a new option forpredictive biomarker assessment in breast cancer. Diagn Mol Pathol. In press [DOI] [PubMed] [Google Scholar]
- Nakagawa T, Kollmeyer TM, Morlan BW, Anderson SK, Bergstralh EJ, Davis BJ, Asmann YW, Klee GG, Ballman KV, Jenkins RB. 2008. A tissue biomarker panel predicting systemic progression after PSA recurrence post-definitive prostate cancer therapy. PLoS ONE. 3:e2318. [DOI] [PMC free article] [PubMed] [Google Scholar]
- Parkin DM, Bray F, Ferlay J, Pisani P. 2005. Global cancer statistics, 2002. CA Cancer J Clin. 55:74-108 [DOI] [PubMed] [Google Scholar]
- Penland SK, Keku TO, Torrice C, He X, Krishnamurthy J, Hoadley KA, Woosley JT, Thomas NE, Perou CM, Sandler RS, et al. 2007. RNA expression analysis of formalin-fixed paraffin-embedded tumors. Lab Invest. 87:383-391 [DOI] [PubMed] [Google Scholar]
- Perou CM, Sørlie T, Eisen MB, van de Rijn M, Jeffrey SS, Rees CA, Pollack JR, Ross DT, Johnsen H, Akslen LA, et al. 2000. Molecular portraits of human breast tumours. Nature. 406:747-752 [DOI] [PubMed] [Google Scholar]
- Ravo M, Mutarelli M, Ferraro L, Grober OMV, Paris O, Tarallo R, Vigilante A, Cimino D, De Bortoli M, Nola E, et al. 2008. Quantitative expression profiling of highly degraded RNA from formalin-fixed, paraffin-embedded breast tumor biopsies by oligonucleotide microarrays. Lab Invest. 88:430-440 [DOI] [PubMed] [Google Scholar]
- Remmele W, Stegner HE. 1987. Recommendation for uniform definition of an immunoreactive score (IRS) for immunohistochemical estrogen receptor detection (ER-ICA) in breast cancer tissue [in German]. Pathologe. 8:138-140 [PubMed] [Google Scholar]
- Ribeiro-Silva A, Zhang H, Jeffrey SS. 2007. RNA extraction from ten year old formalin-fixed paraffin-embedded breast cancer samples: a comparison of column purification and magnetic bead-based technologies. BMC Mol Biol. 8:118. [DOI] [PMC free article] [PubMed] [Google Scholar]
- Rody A, Karn T, Gätje R, Ahr A, Solbach C, Kourtis K, Munnes M, Loibl S, Kissler S, Ruckhäberle E, et al. 2007. Gene expression profiling of breast cancer patients treated with docetaxel, doxorubicin, and cyclophosphamide within the GEPARTRIO trial: HER-2, but not topoisomerase II alpha and microtubule-associated protein tau, is highly predictive of tumor response. Breast. 16:86-93 [DOI] [PubMed] [Google Scholar]
- Rody A, Karn T, Gätje R, Kourtis K, Minckwitz G, Loibl S, Munnes M, Ruckhäberle E, Holtrich U, Kaufmann M, et al. 2006. Gene expression profiles of breast cancer obtained from core cut biopsies before neoadjuvant docetaxel, adriamycin, and cyclophoshamide chemotherapy correlate with routine prognostic markers and could be used to identify predictive signatures. Zentralbl Gynakol. 128:76-81 [DOI] [PubMed] [Google Scholar]
- Rody A, Karn T, Solbach C, Gaetje R, Munnes M, Kissler S, Ruckhäberle E, Minckwitz GV, Loibl S, Holtrich U, et al. 2007. The erbB2+ cluster of the intrinsic gene set predicts tumor response of breast cancer patients receiving neoadjuvant chemotherapy with docetaxel, doxorubicin and cyclophosphamide within the GEPARTRIO trial. Breast. 16:235-240 [DOI] [PubMed] [Google Scholar]
- Ross JS. 2009. Multigene classifiers, prognostic factors, and predictors of breast cancer clinical outcome. Adv Anat Pathol. 16:204-215 [DOI] [PubMed] [Google Scholar]
- Schmitz KJ, Grabellus F, Callies R, Otterbach F, Wohlschlaeger J, Levkau B, Kimmig R, Schmid KW, Baba HA. 2005. High expression of focal adhesion kinase (p125FAK) in node-negative breast cancer is related to overexpression of HER-2/neu and activated Akt kinase but does not predict outcome. Breast Cancer Res. 7:R194-R203 [DOI] [PMC free article] [PubMed] [Google Scholar]
- Scicchitano MS, Dalmas DA, Bertiaux MA, Anderson SM, Turner LR, Thomas RA, Mirable R, Boyce RW. 2006. Preliminary comparison of quantity, quality, and microarray performance of RNA extracted from formalin-fixed, paraffin-embedded, and unfixed frozen tissue samples. J Histochem Cytochem. 54:1229-1237 [DOI] [PubMed] [Google Scholar]
- Srivastava PK, Küffer S, Brors B, Shahi P, Li L, Kenzelmann M, Gretz N, Gröne H. 2008. A cut-off based approach for gene expression analysis of formalin-fixed and paraffin-embedded tissue samples. Genomics. 91:522-529 [DOI] [PubMed] [Google Scholar]
- Sørlie T, Wang Y, Xiao C, Johnsen H, Naume B, Samaha RR, Børresen-Dale A. 2006. Distinct molecular mechanisms underlying clinically relevant subtypes of breast cancer: gene expression analyses across three different platforms. BMC Genomics. 7:127. [DOI] [PMC free article] [PubMed] [Google Scholar]
- Vanden Bempt I, Drijkoningen M, De Wolf-Peeters C. 2007. The complexity of genotypic alterations underlying HER2-positive breast cancer: an explanation for its clinical heterogeneity. Curr Opin Oncol. 19:552-557 [DOI] [PubMed] [Google Scholar]
- van’t Veer LJ, Dai H, van de Vijver MJ, He YD, Hart AAM, Mao M, Peterse HL, van der Kooy K, Marton MJ, Witteveen AT, et al. 2002. Gene expression profiling predicts clinical outcome of breast cancer. Nature. 415:530-536 [DOI] [PubMed] [Google Scholar]
- Wolff AC, Hammond MEH, Schwartz JN, Hagerty KL, Allred DC, Cote RJ, Dowsett M, Fitzgibbons PL, Hanna WM, Langer A, et al. 2007. American Society of Clinical Oncology/College of American Pathologists guideline recommendations for human epidermal growth factor receptor 2 testing in breast cancer. Arch Pathol Lab Med. 131:18-43 [DOI] [PubMed] [Google Scholar]