

Abstract
The enzyme arylsulfatase B (N-acetylgalactosamine-4-sulfatase; ARSB; ASB) removes 4-sulfate groups from the sulfated glycosaminoglycans (sGAG) chondroitin-4-sulfate (C4S) and dermatan sulfate (DS). Inborn deficiency of ARSB leads to the lysosomal storage disease mucopolysaccharidosis VI, characterized by accumulation of sGAG in vital organs, disruption of normal physiological processes, severe morbidity, and premature death. Recent published work demonstrated extra-lysosomal localization with nuclear and cell membrane ARSB observed in bronchial and colonic epithelial cells, cerebrovascular cells, and hepatic cells. In this report, the authors present ARSB immunostaining in a colonic microarray and show differences in distribution, intensity, and pattern of ARSB staining among normal colon, adenomas, and adenocarcinomas. Distinctive, intense luminal membrane staining was present in the normal epithelial cells but reduced in the malignancies and less in the grade 3 than in the grade 1 adenocarcinomas. In the normal cores, a distinctive pattern of intense cytoplasmic positivity at the luminal surface was followed by reduced staining deeper in the crypts. ARSB enzymatic activity was significantly greater in normal than in malignant tissue. These study findings affirm extra-lysosomal localization of ARSB and suggest that altered ARSB immunostaining and reduced activity may be useful indicators of malignant transformation in human colonic tissue.
Keywords: arylsulfatase B, colon, adenocarcinoma, membrane, lysosome, chondroitin-4-sulfate
The enzyme arylsulfatase B (ARSB; N-acetylgalactosamine-4-sulfatase; ASB) removes 4-sulfate groups from the non-reducing end of chondroitin-4-sulfate (C4S) or dermatan sulfate. ARSB has been characterized as a lysosomal enzyme, and innate deficiency of ARSB is associated with the lysosomal storage disease mucopolysaccharidosis (MPS) VI or Maroteaux-Lamy syndrome.
Recent published work demonstrated that reduced ARSB activity is associated with cystic fibrosis, in which there is accumulation of sulfated polysaccharides, including the sulfated glycosaminoglycans chondroitin sulfate and dermatan sulfate (Bhattacharyya and Tobacman 2007; Bhattacharyya et al. 2008; Bhattacharyya, Solakyildirim, et al. 2010). Immunohistochemistry and confocal microscopy have shown prominent cell membrane immunostaining for ARSB in human colonic and bronchial epithelial cells and cerebrovascular cells, as well as enzymatic activity in the cell membrane fraction (Bhattacharyya, Solakyildirim, et al. 2010; Bhattacharyya and Tobacman 2006, 2009). In the metastatic human colonic carcinoma cell line T84, ARSB activity was significantly less than in the non-transformed NCM460 cell line. Silencing or overexpression of ARSB affected colonic cell motility, as well as the expression of protein and mRNA for MMP9 and the activation of RhoA (Bhattacharyya and Tobacman 2009). Other investigators have reported non-lysosomal arylsulfatase B and arylsulfatase A in hepatic cells (Mitsunaga-Nakatsubo et al. 2009).
Reduced activity of ARSB was also shown in malignant mammary cell lines compared to normal mammary cells (Bhattacharyya et al. 2009). In MCF-7 cells, changes in ARSB expression were associated with changes in mRNA and protein expression of the proteoglycans syndecan-1 and decorin, which have chondroitin-4-sulfate attachments (Bhattacharyya et al. 2008). Decline in ARSB activity was associated with increased content of C4S, attributable to reduced hydrolysis of the 4-sulfate group on the non-reducing end of C4S when ARSB was reduced. Because this reaction is required for further degradation of C4S, C4S can accumulate when ARSB activity declines (Ingmar and Wasteson 1979). In other published work, increased cellular content of C4S was associated with increased cellular sequestration of interleukin-8 (IL-8) and of high molecular weight kininogen (Bhattacharyya, Solakyildirim, et al. 2010; Bhattacharyya, Kotlo, et al. 2010). These findings indicated that an increase in the cellular content of the highly anionic C4S had profound effects on the processing and release of vital cellular products.
In this report, ARSB immunostaining was evaluated in normal, adenomatous, and malignant colonic tissues to determine whether there were differences between the distribution and intensity of ARSB in the cytoplasm, luminal membrane, and nuclei of colonic epithelium in malignant versus normal colon tissue. ARSB activity was also compared between malignant and normal colonic tissue specimens.
Materials and Methods
Colonic Tissue Cancer Microarray
Cancer tissue microarrays that included cores from normal colonic tissue, adenomas, adenocarcinomas, and metastases were obtained from the National Disease Research Interchange (NDRI; Philadelphia, PA). Slides were arrayed with duplicate tissue sections, and all specimens were reviewed by NDRI pathologists and by pathologists at the University of Illinois at Chicago (UIC). Information about the cores included the diagnosis, the age of the patient at the time of excision, patient gender and ethnicity, and NDRI number.
The microarray included 9 cores of normal colon, 4 cores from villous adenomas, and 58 cores from adenocarcinomas, including well, moderately, and poorly differentiated. The microarray slides were hydrated through a xylene and alcohol gradient, rinsed in distilled water. Antigen unmasking used a 10× concentrated retrieval solution by Dako (Carpenteria, CA), according to the manufacturer’s instructions. Slides were then rinsed in phosphate-buffered saline (PBS) for 5 min. For the demonstration of ARSB, tissue sections were blocked with H2O2 blocking reagent for 10 min at room temperature. Slides were treated with a protein blocking solution for 10 min at room temperature, then rinsed and incubated with arylsulfatase B polyclonal rabbit antiserum (Open Biosystems, ThermoFisher Scientific, Hunstville, AL; 1:100) for 30 min at room temperature. Slides were rinsed, then treated with EnVision Plus labeled polymer (DakoCytomation, Carpenteria, CA) for 30 min at room temperature. ARSB staining was detected by DAB Plus (DakoCytomation) for 10 min. Slides were rinsed in distilled water, counterstained with hematoxylin, and dehydrated through an alcohol gradient and mounted with Permount. Slides were scanned by ScanScope CS (Aperio Technologies, Inc., Vista, CA), using the Aperio ImageScope program (v10.0.35.1800) with magnification up to ×400. Scale bars (100 µm) based on lymphocyte dimension of 7 µm were added to figures.
NDRI arrays were reviewed by three physician observers, who rated each core for percentage of cells with ARSB-positive staining of cytoplasm, luminal membrane, and nuclei (0–100%) and for the corresponding intensity on a scale of 0 (none), 1 (weak), 2 (intermediate), and 3 (strong). Differentiation of the adenocarcinomas was graded as 1, 2, or 3. Representative images are presented in the figures.
ARSB Activity and Immunostaining in Normal and Malignant Colon Tissue
Slides from frozen sections of adenocarcinomas and of adjacent normal tissue and frozen tissue samples were obtained through the Tumor Bank of the University of Illinois at Chicago, under an established institutional review board protocol to obtain de-identified human tissue samples from colonic resections. Slides were stained for ARSB using rabbit polyclonal antisera produced against a unique C-terminal epitope (as above), rinsed in buffer, and incubated with mouse anti-rabbit secondary antibody. After rinsing, 3,3′-diaminobenzidine (DAB) was used for color detection, and slides were rinsed in H2O, dehydrated, coverslipped with Permount, and photographed with a Nikon imaging system with no enhancement or modification of the images.
ARSB activity was measured in the frozen tissue samples following an established method that used the substrate 4-methyumbilliferyl sulfate (Bhattacharyya and Tobacman 2007; Bhattacharyya et al. 2008; Bhattacharyya, Solakyildirim, et al. 2010). Then, 20 µl of tissue homogenate and 80 µl of assay buffer (0.05M Na acetate buffer, pH 5.6) were combined with 100 µl of substrate (5 mM 4-MUS in assay buffer) in wells of a microplate. The microplate was incubated for 30 min at 37C, and the reaction was stopped by 150 µl of stop buffer (Glycine-Carbonate buffer, pH 10.7). Fluorescence was measured at 360 nm (excitation) and 465 nm (emission) in a fluorimeter (FluoStar Optima; BMG Labtech, Inc., Cary, NC) and normalized to the protein content of the tissue lysate using the BCA Protein Assay Kit (Pierce, Rockford, IL). Measurements of at least six biological samples with technical replicates were averaged for normal and malignant tissues and are expressed as nmol/mg protein/hr ± standard deviation (SD).
Statistics
Tests of statistical significance were performed using Instat Software (Instat3; GraphPad, La Jolla, CA). For comparisons of ARSB activity in normal and malignant colonic tissue, an unpaired, two-tailed t-test was performed with Welch correction. One-way ANOVA with Tukey-Kramer posttest for multiple comparisons was used for comparisons between the different grades of adenocarcinomas. A p value ≤0.05 was considered statistically significant.
Results
ARSB Activity in Normal and Malignant Colonic Tissue
ARSB activity was measured in samples of normal and malignant colonic tissue. Mean value for activity in the normal tissue was 108.2 ± 7.8 nmol/mg protein/hr (n=6), compared to 55.1 ± 4.3 nmol/mg protein/hr in the malignant tissue (n=8). Differences between the normal and malignant tissue were statistically significant (p<0.0001, unpaired t-test, two-tailed with Welch correction). Proportions of epithelial to stromal cells appeared comparable between the malignant and normal tissue, as shown in representative sections of the tissue in which ARSB was determined (Fig. 1A,B). ARSB immunostaining was more intense in the normal than in the adjacent malignant colonic tissue, including in nuclei, cytoplasm, and luminal membrane, with no counterstaining.
Figure 1.
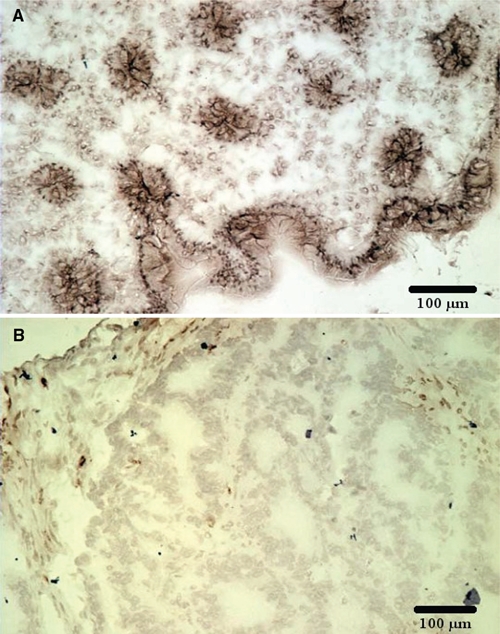
Arylsulfatase B (ARSB) activity and immunohistochemistry in paired samples of normal and malignant human colonic tissue. (A) Immunohistochemistry demonstrates prominent ARSB staining in the membranes, nuclei, and cytoplasm of the normal tissue. (B) In contrast, ARSB immunostaining in the tumor is markedly reduced. ARSB immunostaining is brown; no counterstain is present. Scale bar is 100 µm.
Differences in Overall Pattern of ARSB
The differences in ARSB staining between normal and malignant cores were quantified by ratings of the percentage positive staining cells of the cytoplasm, luminal membrane, and nuclei (0–100%). The corresponding intensity of staining was rated (0–3), as described in Materials and Methods. These ratings are presented in Table 1 and indicate significant differences between the normal and malignant tissue in the overall percentage of positive cytoplasm in the cells (higher in the malignant) and in the intensity of the luminal membrane and nuclear intensity immunostaining, which were higher in the normal than in the malignant cores (p=0.05, p=0.01, p=0.001, respectively; unpaired t-test, two-tailed). The adenocarcinomas differed significantly in the intensity of cytoplasmic staining, which increased from grade 1 to grade 3 (p=0.046, one-way ANOVA with Tukey-Kramer posttest for multiple comparisons) (Table 2). Differences in percentage of luminal membrane positivity and intensity trended down as grade increased and neared statistical significance.
Table 1.
Comparison of ARSB between Malignant and Normal Samples
| Malignanta (n=58) | Normal (n=9) | p Valueb | |
|---|---|---|---|
| Cytoplasm | |||
| % Positive cells | 85.3 (23.4) | 67.2 (31.3) | 0.05 |
| Intensity | 1.6 (0.7) | 1.7 (0.6) | NS |
| Luminal membrane | |||
| % Positive cells | 51.6 (38.4) | 62.2 (26.4) | NS |
| Intensity | 1.4 (1.1) | 2.5 (0.5) | 0.01 |
| Nuclei | |||
| % Positive cells | 23.8 (22.4) | 31.6 (24.4) | NS |
| Intensity | 1.3 (0.5) | 2.0 (0.5) | 0.001 |
Values presented as mean ± (standard deviation). NS, not significant.
Not all sections were evaluable by these criteria.
Unpaired t-test, two-tailed.
Table 2.
Comparison of ARSB between Adenocarcinomas of Different Grades
| Adenocarcinomaa | Grade 1 (n=12) | Grade 2 (n=31) | Grade 3 (n=7) | p Valueb |
|---|---|---|---|---|
| Cytoplasm | ||||
| % Positive cells | 84.9 (27.2) | 87.9 (20.1) | 91.4 (22.7) | NS |
| Intensity | 1.4 (0.4) | 1.7 (0.7) | 2.2 (0.9) | 0.05 |
| Luminal membrane | ||||
| % Positive cells | 62.9 (30.5) | 58.4 (36.0) | 24.7 (41.6) | 0.06 |
| Intensity | 1.8 (0.9) | 1.5 (1.0) | 0.9 (1.3) | 0.1 |
| Nucleus | ||||
| % Positive cells | 32.7 (23.5) | 23.1 (22.0) | 22.9 (23.2) | NS |
| Intensity | 1.4 (0.5) | 1.3 (0.5) | 1.5 (0.2) | NS |
Values presented as mean ± (standard deviation) NS, not significant.
Not all of the adenocarcinoma cores could be assigned a grade.
p value, one-way ANOVA with Tukey-Kramer posttest for multiple comparisons.
These differences were evident in the low magnification images (Fig. 2A-D) that demonstrated marked differences in the overall pattern of ARSB immunostaining in the normal tissue, villous adenoma, and adenocarcinoma. Grading in the normal tissue was confounded by the distinctive pattern of ARSB immunostaining (Fig. 2A). ARSB staining at the luminal membrane and in the cytoplasm of the epithelial cells that comprise the luminal surface was very intense. Marked reduction in intensity of cytoplasmic staining occurred abruptly between the differentiated cells at the luminal surface and the transit-amplifying cells. Diminished to absent staining persisted throughout the mid-portion and lower region of the crypts, with the exception of a few intensely positive cells at the base of the crypts and an occasional intensely staining cell in the mid-portion of the crypts.
Figure 2.
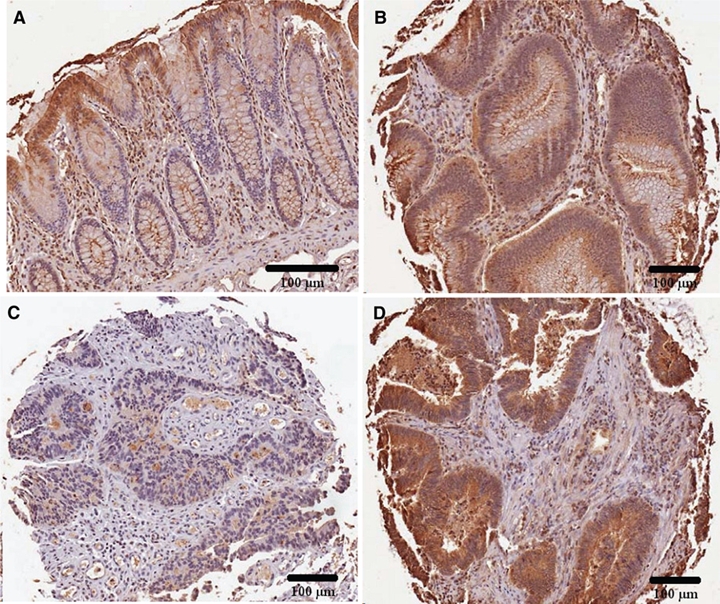
Overall pattern of arylsulfatase B (ARSB) staining in normal, villous adenomas, and adenocarcinomas. (A) Normal tissue demonstrates a distinct pattern of ARSB staining, with increased intensity at the luminal surface where differentiated cells are present. Along the mid-portion of the crypts, ARSB staining is absent, except for an occasional positively stained cell. At the base of the crypts, rare ARSB-positive cells are present. (B) In the villous adenomas, the distinctive topography of ARSB staining seen in the normal crypt is absent, and there is uniform epithelial staining. (C, D) These adenocarcinomas demonstrate loss of the distinctive overall pattern of ARSB staining seen in the normal tissue, with low and high percentages of cytoplasmic staining and intensity. ARSB immunostaining is brown; hematoxylin counterstain is blue. Scale bar is 100 µm.
In the villous adenomas, cytoplasmic ARSB staining was moderate but uniform in the epithelial cells, without the variation seen in the normal glands (Fig. 2B). In the adenocarcinomas, the distinctive pattern of ARSB staining of the normal tissue was absent, and there was variation in the intensity of cytoplasmic staining between different cores. Some of the cores had uniformly, very faint immunostaining for ARSB (Fig. 2C); in other cores, the staining was uniformly intense (Fig. 2D).
Variation in Luminal Membrane Staining
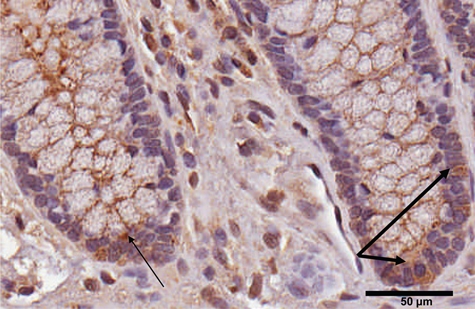
In the normal colonic tissue, a distinct pattern of luminal membrane staining was evident with intense staining at the surface (Fig. 2A). The positive cell membrane staining persisted into the base of the crypts and was well seen in the cross sections of the crypts. In the villous adenomas, the luminal membrane positive staining was discontinuous (Fig. 3A). In the adenocarcinomas, the luminal membrane staining was absent or markedly diminished in most areas, but some membrane fragments persisted (Fig. 3B).
Figure 3.
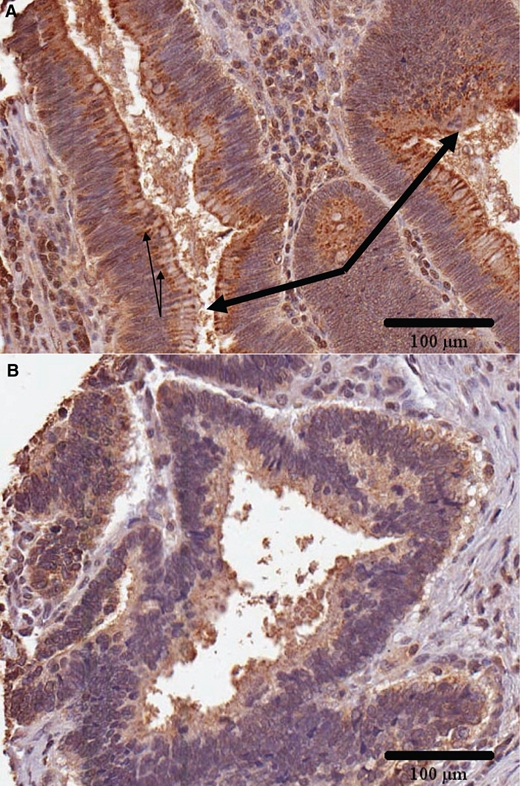
Luminal membrane staining of arylsulfatase B (ARSB). (A) In the villous adenomas, the luminal membrane staining for ARSB is discontinuous in some regions, as marked by the thick arrows. In the normal colonic tissue, the luminal membrane stains intensely and continuously for ARSB, as seen in Figure 2A. Thin arrows indicate examples of cytoplasmic inclusions. (B) In the adenocarcinomas, the membrane staining is absent in most areas, with only residual fragments. ARSB immunostaining is brown; hematoxylin counterstain is blue. Scale bar is 100 µm.
Variation in Nuclear Staining
In the normal colonic tissue, the majority of the nuclei of the epithelial cells were not ARSB positive, but some nuclei, particularly along the luminal surface, were strongly positive (Fig. 4A). In the villous adenomas, nuclear staining was present in some cells but generally absent (Fig. 4B). In the malignant tissue (Fig. 4C), marked variation in the nuclear positivity between different cores was apparent. This variability was similar to the variation in the cytoplasmic staining and may reflect differences in the cells of origin because it is consistent with the differences in ARSB nuclear and cytoplasmic staining in the normal tissue that gives rise to the malignant cells. Nuclear membrane staining was present and prominent in some of the cells in the normal, adenomatous, and malignant tissue.
Figure 4.
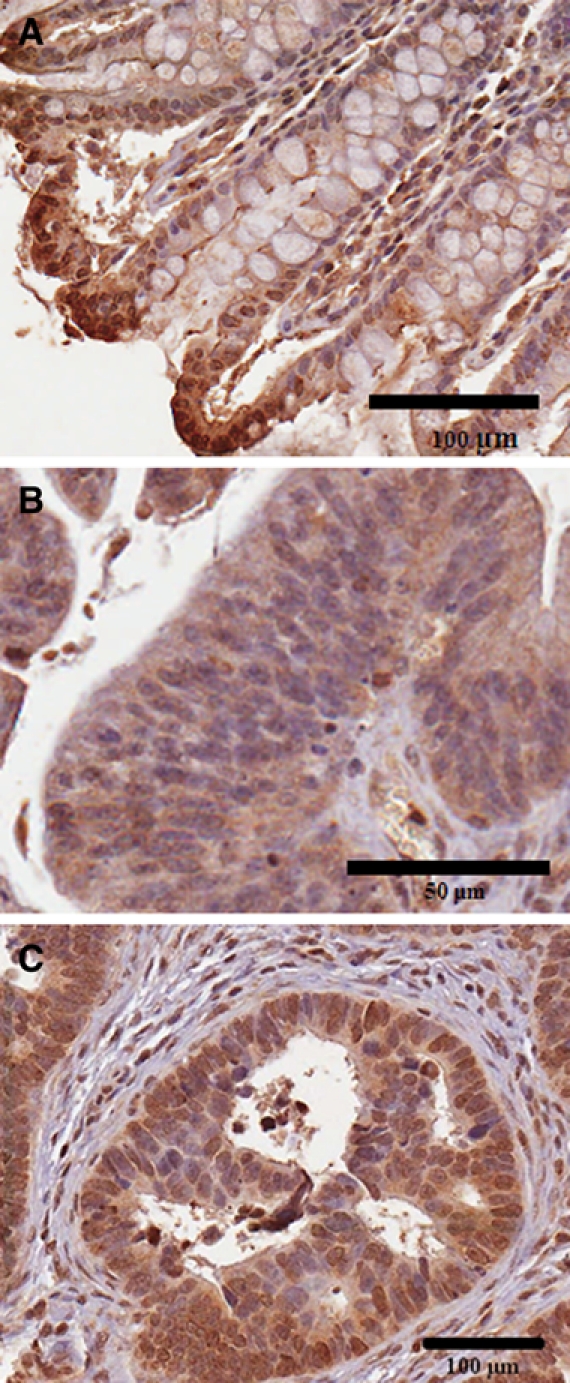
Differences in epithelial nuclear staining between normal and malignant tissue. (A) In the normal epithelial cells, nuclear staining is present in some of the cells at the luminal border and is intense. Nuclear membrane staining is also prominent in some of the cells. Scale bar is 100 µm. (B) In the villous adenoma, the nuclear staining is generally negative but with occasional positive cells. Nuclear membrane staining is prominent in some of the cells. Scale bar is 50 µm. (C) In the malignant tissue, there is variation in the extent of nuclear staining, similar to the variation in cytoplasmic staining. In some of the adenocarcinomas, nuclear staining is predominantly negative, whereas in other cores, many of the nuclei and nuclear membranes appear positive. ARSB immunostaining is brown; hematoxylin counterstain is blue. Scale bar is 100 µm.
Positive Cells at the Base of the Crypts in Normal Tissue Are Suggestive of Stem Cells
Occasional cells (~5) at the base of the colonic crypts had intensely positive cytoplasmic staining (Fig. 5). Their location and small number are suggestive of colonic stem cells.
Figure 5.
Arylsulfatase B (ARSB)–positive cells at the base of the crypts in normal tissue suggestive of stem cells. A small number of intensely positive cells appear at the base of the crypts in the normal tissue, suggestive of the location and quantity of stem cells anticipated to be present within the crypts (thick arrows). Thin arrow indicates cytoplasmic inclusion. ARSB immunostaining is brown; hematoxylin counterstain is blue. Scale bar is 50 µm.
Variation in ARSB Staining in Stromal Cells
In the normal tissue, the stromal cells were a heterogeneous population, in which ARSB positivity was present in the cell cytoplasm or nuclei of some of the mononuclear cells, indicating the presence of ARSB in cells of myeloid origin (Fig. 4A, Fig. 5). In the villous adenomas, the stromal cells appeared more uniform, with some positive for ARSB (Fig. 6A). In the adenocarcinomas, the distribution of ARSB-positive cell types in the stroma was more heterogeneous, including frequent ARSB-positive elongated cells that are possibly myofibroblasts (Fig. 6B).
Figure 6.
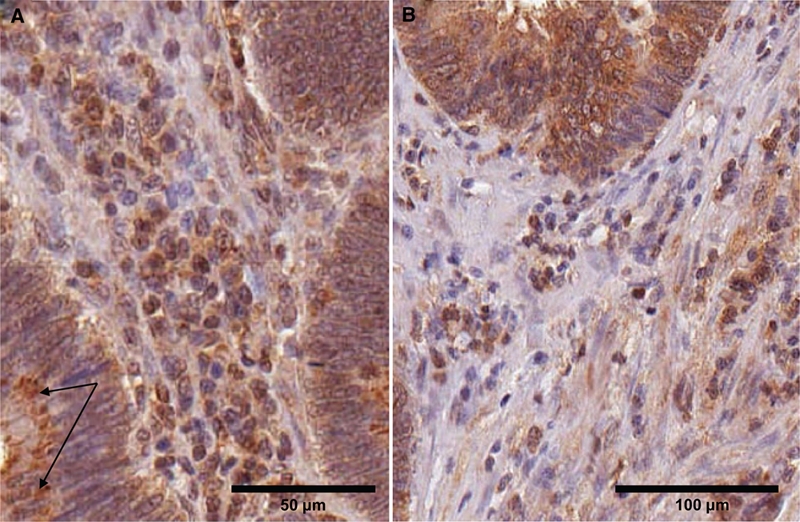
Variation in arylsulfatase B (ARSB) staining in the stroma and cytoplasmic inclusions positive for ARSB cells. (A) In the villous adenomas, the stromal cells appear more homogeneous than in the normal cores (Fig. 4A and Fig. 5). Distinct ARSB-positive inclusions are seen in the cytoplasm of the epithelial cells; arrows indicate representative inclusions. Scale bar is 50 µm. (B) In the adenocarcinomas, more variability is apparent in the stromal cells. Many are ARSB positive, with an increase in positively staining elongated cells that may be myofibroblasts. ARSB immunostaining is brown; hematoxylin counterstain is blue. Scale bar is 100 µm.
Cytoplasmic Inclusions Positive for ARSB in Epithelial Cells
In the villous adenomas, prominent cytoplasmic inclusions that stained intensely for ARSB were present in most of the cells (Fig. 3A and Fig. 6A). Similar inclusions were present in some cells of some of the adenocarcinomas (Fig. 6B). Inclusions were not prominent in the ARSB-positive normal epithelial cells (e.g., Fig. 4A and Fig. 5).
Discussion
The ARSB imaging and activity data presented in this report provide evidence that supports a more extensive biological role for ARSB than a deficiency resulting in MPS VI. Extra-lysosomal localization of ARSB is consistent with functional effects beyond accumulation of sulfated glycosaminoglycans in the lysosomes. Measurements of ARSB activity indicated that activity was reduced in the malignant compared to the normal colonic tissue. Ratings of intensity and extent of distribution indicated that the intensity of ARSB staining was greater in the luminal membrane and nuclei of the normal cells than in the malignant cells, but the overall extent of cytoplasmic staining was greater in the malignant cores. These differences suggest that reduction of ARSB activity and alteration of the normal pattern of distribution of ARSB may be useful as indicators of malignant transformation in colonic tissue.
In the current report, a highly specific immunostaining pattern for ARSB appears in the normal colonic crypts, as well as prominent luminal membrane staining. Along the crypt, where transit-amplifying cells are present, cytoplasmic and nuclear immunostaining for ARSB is generally absent, except for an occasional intensely staining cell. At the apical surface, the ARSB staining was very intense, with prominent cytoplasmic, nuclear, and luminal membrane staining. In the adenomas and the adenocarcinomas, this distinctive pattern of staining disappeared, suggesting that the distinct pattern of ARSB localization may be important in maintenance of normal crypt architecture.
In the adenocarcinomas, the intensity of immunostaining for ARSB was variable, suggesting origin of the adenocarcinomas from epithelial cells in different regions of the crypts. The epithelial cells in the transit-amplifying region of the crypts might give rise to malignant cells that lack ARSB staining but are more motile. This would be consistent with the greatly reduced ARSB activity found in the metastatic T84 cell line (Bhattacharyya and Tobacman 2009). In some of the adenocarcinoma cores examined, the ARSB immunostaining was very intense, suggesting origin from either the apical or basal highly positive cells, rather than from the non-staining cells of the transit-amplifying region of the crypts. Future study will enable clarification of the prognostic implications of these differences in ARSB intensity that are observed in the malignant cells. Additional investigation is required to determine how reduced activity and altered distribution of ARSB, as well as the associated increase in chondroitin-4-sulfate or dermatan sulfate, might influence malignant transformation of the colonic epithelium.
Footnotes
The content in this article is solely the responsibility of the authors and does not necessarily represent the official views of the National Center for Research Resources or the National Institutes of Health.
The author(s) declared no potential conflicts of interest with respect to the authorship and/or publication of this article.
This study was funded in part by VA Merit Review to JKT. GG received funding from the University of Illinois at Chicago Center for Clinical and Translational Sciences (Award Number ULRR029879 from the National Center for Research Resources).
References
- Bhattacharyya S, Kotlo K, Danziger R, Tobacman JK. 2010. Arylsulfatase B regulates interaction of chondroitin-4-sulfate and kininogen in renal epithelial cells. Biochim Biophys Acta. 1802(5):472–477 [DOI] [PubMed] [Google Scholar]
- Bhattacharyya S, Kotlo K, Shukla S, Danziger RS, Tobacman JK. 2008. Distinct effects of N-acetylgalactosamine-4-sulfatase and galactose-6-sulfatase expression on chondroitin sulfate. J Biol Chem. 283(15):9523–9530 [DOI] [PubMed] [Google Scholar]
- Bhattacharyya S, Solakyildirim K, Zhang Z, Chen ML, Linhardt RJ, Tobacman JK. 2010. Cell-bound IL-8 increases in bronchial epithelial cells following arylsulfatase B silencing. Am J Respir Cell Mol Biol. 42(1):51–56 [DOI] [PubMed] [Google Scholar]
- Bhattacharyya S, Solakyildirim K, Zhang Z, Linhardt RJ, Tobacman J. 2009. Chloroquine reduces arylsulfatase B activity and increases chondroitin 4-sulfate: implications for mechanisms of action and resistance. Malaria J. 8(1):303. [DOI] [PMC free article] [PubMed] [Google Scholar]
- Bhattacharyya S, Tobacman JK. 2006. Steroid sulfatase, arylsulfatases A and B, galactose 6-sulfatase, and iduronate sulfatase in mammary cells and effects of sulfated and non-sulfated estrogens on sulfatase activity. J Steroid Biochem Mol Biol. 103(1):20–34 [DOI] [PubMed] [Google Scholar]
- Bhattacharyya S, Tobacman JK. 2007. Increased arylsulfatase B activity in cystic fibrosis cells following correction of CFTR. Clin Chim Acta. 380(1–2):122–127 [DOI] [PubMed] [Google Scholar]
- Bhattacharyya S, Tobacman JK. 2009. Arylsulfatase B regulates colonic epithelial cell migration by effects on MMP9 expression and RhoA activation. Clin Exp Metastasis. 26(6):535–545 [DOI] [PubMed] [Google Scholar]
- Ingmar B, Wasteson Å. 1979. Sequential degradation of a chondroitin sulphate trisaccharide by lysosomal enzymes from embryonic-chick epiphysial cartilage. Biochem J. 179:7–13 [DOI] [PMC free article] [PubMed] [Google Scholar]
- Mitsunaga-Nakatsubo K, Kusunoki S, Kawakami H, Akasaka K, Akimoto Y. 2009. Cell-surface arylsulfatase A and B on sinusoidal endothelial cells, hepatocytes, and Kupffer cells in mammalian livers. Med Mol Morphol. 42(2):63–69 [DOI] [PubMed] [Google Scholar]