Abstract
In the nervous system, protease-activated receptors (PARs), which are activated by thrombin and other extracellular proteases, are expressed widely at both neuronal and glial levels and have been shown to be involved in several brain pathologies. As far as the glial receptors are concerned, previous experiments performed in rat hippocampus showed that expression of PAR-1, the prototypic member of the PAR family, increased in astrocytes both in vivo and in vitro following treatment with trimethyltin (TMT). TMT is an organotin compound that induces severe hippocampal neurodegeneration associated with astrocyte and microglia activation. In the present experiments, the authors extended their investigation to microglial cells. In particular, by 7 days following TMT intoxication in vivo, confocal immunofluorescence revealed an evident PAR-1-related specific immunoreactivity in OX-42-positive microglial cells of the CA3 and hilus hippocampal regions. In line with the in vivo results, when primary rat microglial cells were treated in vitro with TMT, a strong upregulation of PAR-1 was observed by immunocytochemistry and Western blot analysis. These data provide further evidence that PAR-1 may be involved in microglial response to brain damage.
Keywords: neurodegeneration, nervous system, protease-activated receptor-1, glia, trimethyltin
Protease-activated receptor–1 (PAR-1) is the prototypic member of a family of four G-protein-coupled receptors that signal in response to extracellular proteases. PAR activation is unique in that it involves the proteolytic unmasking of a receptor amino-terminal sequence, which acts as a tethered ligand while remaining attached to the body of the receptor. PAR-1, PAR-3, and PAR-4 represent thrombin receptors, whereas PAR-2 is activated by trypsin and mast cell tryptase. However, other proteases can cleave and activate these receptors with different efficiency. In particular, PAR-1 is also activated by matrix metalloproteinase-1 (MMP-1), plasmin, activated protein C (APC), and FXa (Arora et al. 2007). Upon activation, PAR-1 couples to the Gαq/11, Gαi/o, and Gα12/13 subtypes, inducing phosphoinositide metabolism and intracellular calcium mobilization, inhibition of adenylate cyclase, and activation of Rho/Rho kinase, c-Jun NH2-terminal kinase, protein kinase C, and mitogen-activated protein (MAP) kinases to promote diverse cellular responses (Coughlin 2005).
Recent evidence shows that PARs contribute to neuroprotection and/or neurodegeneration and are modulated under various pathological conditions (for review, see Luo et al. 2007; Sokolova and Reiser 2008): The number of astrocytes expressing PAR-1 is increased in substantia nigra pars compacta of Parkinson disease brains (Ishida et al. 2006); during human immunodeficiency virus encephalitis, PAR-1 expression is upregulated at both mRNA and protein levels in human astrocytes in vivo (Boven et al. 2003); the expression of PAR-1 and PAR-3 is increased in rat hippocampal slices after exposure to severe in vitro ischemia (oxygen-glucose deprivation, OGD) (Striggow et al. 2001). Besides, our previous studies showed that PAR-1 expression is increased in astrocytes both in vivo and in vitro after treatment with the neurotoxic compound trimethyltin (TMT) (Pompili et al. 2004; Pompili et al. 2006). In contrast to the astrocytic receptors, microglial PARs are less known. Several authors have described the presence of functional PAR-1 in microglial cultures (Möller et al. 2000; Suo et al. 2002; Balcaitis et al. 2003; Fabrizi et al. 2009), and it has been suggested that PAR-1 activation induces proliferation and microgliosis in the dentate gyrus of rat hippocampal slice cultures after traumatic injury (Laskowski et al. 2007). Furthermore, in an experimental model of ischemic injury, PAR-1 appeared selectively expressed in ramified cells, possibly corresponding to microglial cells (Henrich-Noack et al. 2006).
To gain further insight into this subject, in the present experiments, we investigated microglial PAR-1 both in vivo and in vitro following treatment with TMT, an organotin compound that is considered a useful tool to obtain an animal model of neurodegeneration associated with cognitive impairment (Balaban et al. 1988; Ishikawa et al. 1997). A single intraperitoneal TMT injection causes, in the rat brain, massive neuronal death selectively involving pyramidal neurons localized in the CA3/hilus and CA1 hippocampal subfields with selective sparing of interneuronal subpopulations (Geloso et al. 1996; Geloso et al. 1997). TMT-induced neurodegenerative events are associated with the activation of astrocytes and microglial cells (Brabeck et al. 2002; Geloso et al. 2004; Pompili et al. 2004; Rohl and Sievers 2005). Microglia become activated during the first postintoxication day around neurons known to be targets of TMT and persist over a long period. Histological evidence of activated microglial cells in the hippocampus is temporally associated with the upregulation of proinflammatory cytokines (interleukin [IL]–1α, IL-6, and tumor necrosis factor [TNF]–α) (Maier et al. 1995; Harry et al. 2008) that could play a modulatory role in the early stages of TMT-induced neurotoxicity (Rohl and Sievers 2005). Degenerative changes show a delayed onset and a prolonged duration, starting 2 days after treatment, and progress over time, becoming evident within 21 days (Chang 1986).
In this article, data will be shown indicating PAR-1 expression in microglial cells following TMT treatment.
Materials and Methods
Animals and Tissue Preparation
All procedures were carried out in accordance with the Italian laws and guidelines established for the care and the use of animals in research. Wistar rats (200–250 g) were administrated a single intraperitoneal dose of TMT (8 mg/kg body weight; ChemPur, Karlsruhe, Germany) or vehicle (saline). Rats were sacrificed 7, 15, or 21 days after TMT or saline treatment, and the brains were rapidly removed, embedded in OCT compound (Killik, Bio-Optica, Italy), and frozen on methylbutane precooled with liquid nitrogen. Sagittal cryostatic sections (10-µm thickness) were cut on a cryostat and used for histological and immunohistochemical examinations.
Histological Staining
Sagittal cryostatic sections from saline- and TMT-treated rats were stained by toluidine blue (Nissl method).
Double-labeling Immunohistochemistry
Sagittal cryostatic sections from saline- and TMT-treated rats were fixed with cold acetone (10 min). After quenching autofluorescence with 0.05 M ammonium chloride and saturation of nonspecific sites with 3% normal donkey serum (BioCell Research Laboratories, Rancho Dominguez, CA), sections were incubated overnight at 4C with rabbit anti-PAR-1 antibody (Thrombin R/ATAP2; Lab Vision, Fremont, CA, 4 µg/ml; Thrombin Receptor, LifeSpan Biosciences, Seattle, WA, 1–2 µg/ml; or H-111, Santa Cruz Biotechnology, Santa Cruz, CA, 4 µg/ml) and mouse anti-OX-42 antibody (1:100; Serotec, Oxford, UK). After washing, the sections were incubated with a mixture of donkey Cy3-labeled anti-rabbit IgG (1:400; Jackson ImmunoResearch Laboratories, West Grove, PA) and donkey Dy-light 488–labeled anti-mouse IgG (1:100; Jackson ImmunoResearch Laboratories). Negative controls were performed: substituting specific Igs with an equivalent amount of nonspecific Igs, preincubating the primary antibody with saturating amounts of a specific blocking peptide (AnaSpec, Fremont, CA; antigen/antibody weight ratio = 5), and omitting primary antibodies. Slides were mounted with Vectashield mounting medium, containing DAPI for nuclear staining (Vector Laboratories, Burlingame, CA). Examination and photographs were made using a fluorescence (Eclipse E600; Nikon Instruments S.p.A., Firenze, Italy) or confocal (LSM 510 Meta; Zeiss, Oberkochen, Germany) microscope. For confocal analysis, images from control and TMT-treated hippocampi were acquired in adequate emission channels. The images were then viewed as stacked Z-dimension images, both as single 0.5-µm optical sections or as merged images. Double-labeled PAR-1/OX-42 cells were then observed orthogonally in both the vertical and horizontal planes (three-dimensional reconstruction).
An evaluation of PAR-1 immunostaining in microglial cells was carried out within the hippocampal CA3/hilus regions after TMT administration. OX-42-positive microglial cells and PAR-1/OX-42 double-labeled cells were counted at ×40 magnification in consecutive non-serial sections, at 50-µm intervals, to avoid counting the same cell twice. These values were used to calculate the main percentage ± SEM of microglial cells expressing PAR-1 (three animals/group).
Microglial Cell Culture
Microglial cells were prepared from the cortex of newborn (P4) Wistar rats, as described previously (Aloisi et al. 1998). Briefly, after 14 days in culture, microglial cells were separated from the underlying astrocytic monolayer by gentle agitation, and cells were cultured in DMEM (Invitrogen, Italy) supplemented with 10% fetal calf serum (Sigma, Milan, Italy) in 5% CO2. For immunocytochemistry and Western blot analyses, microglial cells were seeded in 24-well plates (3 × 10⁵ cells/well in 0.6 ml medium) and for cell viability experiments in 96-well plates (5 × 10⁴ cells/well in 0.1 ml culture medium). Twenty-four hours after seeding, cells were treated with TMT. Cultures routinely consisted of ≥98% microglial cells as determined by staining with Griffonia simplicifolia isolectin B4 (IL B4; Sigma, St Louis, MO).
Cell Viability
Cell viability was measured by 3-(4,5-dimethylthiazol-2-yl)-2,5-diphenyltetrazolium bromide (MTT) reduction essentially as described (Hansen et al. 1989). Briefly, rat microglia primary cultures were grown in the presence of various doses of TMT (0.01, 0.1, 1, 10, 100 µM). Following 48-hr treatments, 10 µl of MTT solution (5 mg/ml) was added to each well, and the incubation was continued for 3 hr. Lysis buffer was prepared by dissolving 40% (w/v) SDS in deionized water, after adding an equal volume of N,N-dimethylformamide, and the pH was adjusted to 4.7. After a 3-hr incubation with MTT, 100 µl of the lysis buffer was added to each well and the absorbance read at 570 nm on a microplate reader (Model 550 Microplate Reader, Bio-Rad Laboratories, Hercules, CA, USA).
Lactate dehydrogenase (LDH) release in the culture medium was measured by the Cytotoxicity Detection Kit (Roche, Mannheim, Germany) according to the manufacturer’s protocols.
Immunocytochemistry in Microglial Cell Cultures
Microglial cells (50 × 103 cells/well) were seeded onto 8-well chamber slides and exposed to TMT (10, 50, or 100 µM) for 24 and 48 hr. Cells were fixed in cold acetone for 10 min and treated with 3% H2O2 in methanol to inhibit endogenous peroxidase. Then, cells were preincubated for 1 hr with 5% non-fat milk (Sigma, St Louis, MO) and incubated overnight at 4C in rabbit polyclonal antibody to PAR-1 (H-111, Santa Cruz Biotechnology; 4 µg/ml). After extensive washes with PBS, slides were incubated for 1 hr with a biotinylated secondary antibody (Vector Laboratories), and then the immunoreactive cells were visualized by the avidin-biotin immunoperoxide method with 3,3-diaminobenzidine tetrahydrochloride (DAB) as the chromogen (Vectastain Elite ABC Kit; Vector Laboratories). These experiments were also performed with rabbit polyclonal antibody from Lab Vision (Thrombin R/ATAP2) and LifeSpan Biosciences (Thrombin Receptor). Negative controls were performed substituting specific Igs with an equivalent amount of nonspecific Igs, omitting the primary or secondary antibodies, and preabsorbing the primary antibody with the specific blocking peptide.
Western Blot Analysis
Microglial cells were collected at 24 and 48 hr after treatment with 10 µM TMT, 300–600 µM hydrogen peroxide, or 10 mM sodium azide. Cells were lysed in the following lysis buffer: 10 mM Tris/HCl (pH 7.4), 1% SDS, 2 mM AEBSF (4-2(2-aminoethyl) benzenesulfonylfluoride hydrochloride), 2 µM aprotinin, 40 µM leupeptin, 70 µM bestatin, 30 µM pepstatin A, and 30 µM E-64 (trans-epoxysuccinyl-l-leucylamido-(4-guanidino)-butane). Samples were clarified by centrifugation at 1000 × g for 5 min. Equivalent amounts of protein (30 µg) from each sample was electrophoretically resolved on 12.5% precast SDS-polyacrylamide gels (ExcelGel; GE Healthcare Biosciences, Uppsala, Sweden) using a horizontal apparatus (Pharmacia Biotech, Uppsala, Sweden). Then, separated proteins were electro-transferred onto nitrocellulose membranes (Schleicher & Schuell, Dassel, Germany) by a semidry system (Novablot, Pharmacia Biotech). Membranes were blocked with 3% dry non-fat milk (Sigma, St Louis, MO) in PBS and then were incubated (overnight at 4C) with rabbit polyclonal antibody specific for PAR-1 (Thrombin R/ATAP2 [Lab Vision] or Thrombin Receptor [LifeSpan Biosciences]) at a final concentration of 0.1–0.2 µg/ml in 3% BSA. Negative controls were performed: substituting specific Igs with equivalent amounts of nonspecific Igs, omitting the primary antibody, and preabsorbing the primary PAR-1 antibody with the specific blocking peptide. After extensive washing with PBS containing 0.1% Tween-20 (TBST), blots were incubated with 1:2000 dilution of horseradish peroxidase (HRP)–conjugated secondary antibody (Amersham Biosciences, Buckinghamshire, UK) for 1 hr at room temperature. Immunopositive bands were detected with a chemiluminescence detection system (GE Healthcare Biosciences) according to the manufacturer’s protocol. The positive control was from Lab Vision. To check for equal loading of the gel, membranes were stripped and reprobed with mouse anti-β-actin antibody (1:20,000; Sigma, St Louis, MO). All analysis was done in duplicate and was repeated at least three times. Band intensity on immunoblots was quantified with a PC-assisted CCD camera (GelDoc 2000 System/Quantity One software; Bio-Rad, Hercules, CA), and the relative densitometry units were calculated relative to β-actin for each lane.
Results
TMT-Induced Hippocampal Degeneration
Brain sections from control and TMT-treated animals were stained by toluidine blue (Nissl method) to assess the extent and features of hippocampal lesion after TMT treatment. In line with previous results (Balaban et al. 1988; Corvino et al. 2005), TMT caused moderate to severe neuronal loss accompanied by reactive gliosis mainly localized in the CA3 and hilus regions exhibiting a progressive worsening and reaching the maximum severity at day 21 of treatment (Fig. 1).
Figure 1.
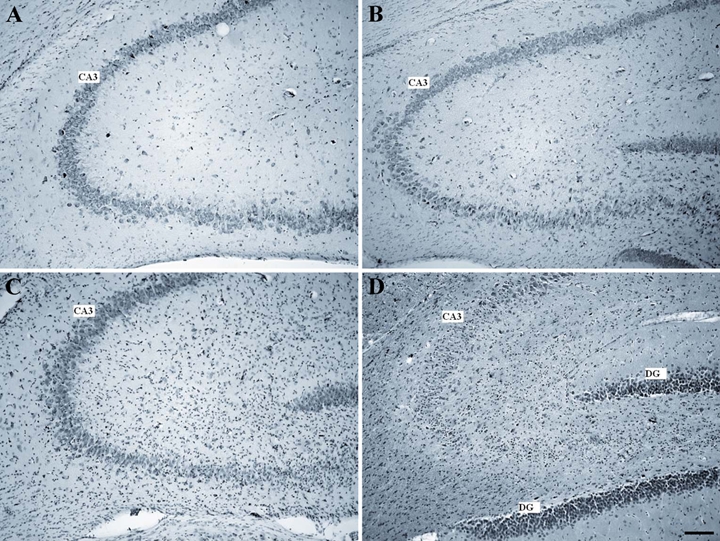
Micrographs of Nissl-stained 10-µm rat hippocampal sagittal sections from control (A) and trimethyltin (TMT)–treated animals at 7 (B), 15 (C), and 21 (D) days after intoxication. TMT-treated animals show in the pyramidal cell layer of the CA3 region moderate (B, C) to severe (D) neuronal loss (scale bar = 250 µm). DG, dentate gyrus.
PAR-1 Immunostaining in Microglial Cells of Rat Hippocampus
PAR-1 expression in microglial cells of rat hippocampus was studied by double immunofluorescence experiments with three commercial antibodies to PAR-1 (see Materials and Methods) and the microglial marker OX-42. Similar results were obtained with all the anti-PAR-1 antibodies used.
Figure 2 shows confocal analysis performed on sections from control (A-C) and TMT-treated hippocampi (D-F). Microglial cells immunostained with OX-42 antibody were rarely observed in control rat hippocampus, and specific immunoreactivity for PAR-1 was mainly associated with neurons (Fig. 2A-C). By contrast, 7 days after TMT administration, PAR-1 expression was also observed in many OX-42 immunoreactive microglial cells that appeared in the hilus regions (Figs. 2D-F and 3). The main percentage of OX-42-positive cells that expressed PAR-1 following TMT treatment was 67 ± 7.6% SEM. OX-42-labeled cells exhibited the morphology of activated microglia with enlarged body and few and short processes. PAR-1 immunoreactivity in microglia occurred diffusely in the cytoplasm of both cell body and processes.
Figure 2.
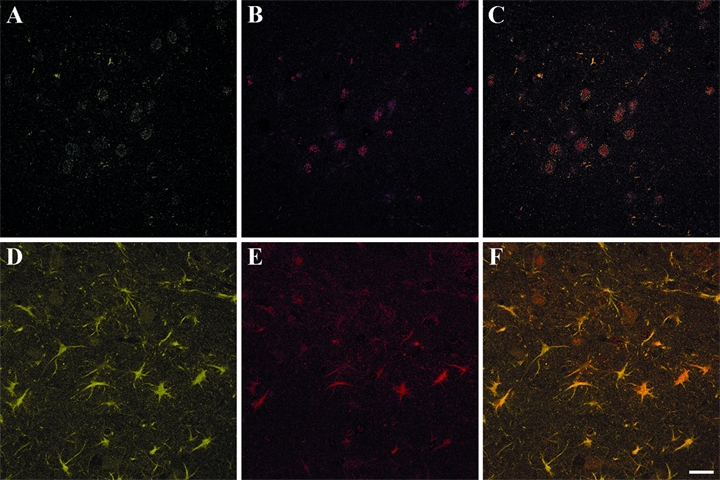
Confocal images of OX-42 (A, D) and PAR-1 (B, E) immunoreactive cells of CA3/hilus hippocampal subfields from control (A-C) and trimethyltin (TMT)–treated rats sacrificed 7 days after intoxication (D-F). Merged images are shown in C (control) and F (TMT-treated rats). Many OX-42-positive cells are evident in the CA3/hilus area after TMT injection (D), and most of the OX-42-positive cells are also stained for PAR-1 (F). PAR-1 immunoreactivity in microglia is seen diffusely in both the cell body and in processes. Photographs show a representative image for five independent experiments. PAR-1, protease-activated receptor–1. (Scale bar = 30 µm)
Figure 3.
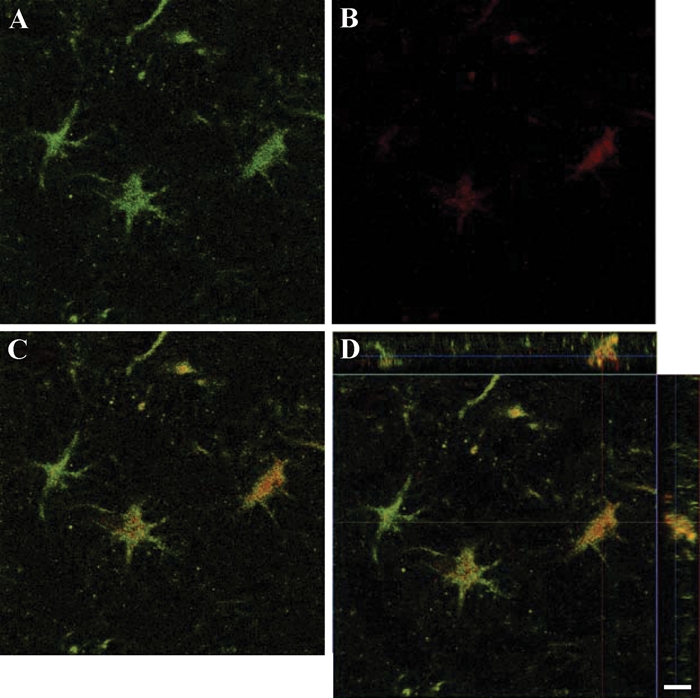
Confocal images and three-dimensional reconstruction in two axes of cells in the hilus hippocampal region on day 7 of observation. A through C show OX-42-positive cells (A), PAR-1-positive cells (B), and cells expressing both immunoreactivities (C). The three-dimensional reconstruction in two axes of the confocal z-stack of the merged image is shown in D. PAR-1, protease-activated receptor–1. (Scale bar = 10 µm)
Negative controls were performed with equivalent amounts of nonspecific Igs or blocking peptides or omitting primary antibodies (not shown).
Cytotoxic Effect of TMT on Rat Microglia Primary Cultures
The cytotoxic effect of TMT on microglial primary cultures was evaluated by MTT assay (Fig. 4) and confirmed by LDH release (not shown). As already observed in cultured rat astrocytes (Pompili et al. 2006), also in microglial cultures, TMT treatment reduced cell viability (Fig. 4). TMT cytotoxicity was statistically significant between 10 and 100 µM, whereas doses above 100 µM induced a massive cell death. Thus, we performed further experiments in a range of TMT concentrations between 10 and 100 µM.
Figure 4.
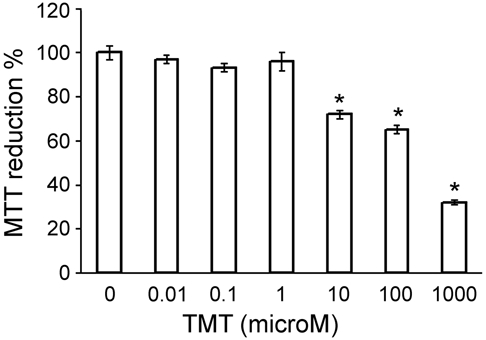
Concentration-response curve of cytotoxicity induced by exposure of rat microglia to trimethyltin (TMT) estimated by 3-(4,5-dimethylthiazol-2-yl)-2,5-diphenyltetrazolium bromide (MTT) assay at 48 hr. Cytotoxicity is expressed as a decrease in the percentage of MTT reduction with respect to control samples. The lowest concentration of TMT that induces a significant inhibition of MTT reduction is 10 µM, whereas cell death is massive with doses above 100 µM TMT. n = 3; *p < 0.001 versus controls (untreated cultures); ANOVA with Bonferroni-corrected t-test.
PAR-1 Immunostaining in Rat Microglia Primary Cultures
Immunoperoxidase experiments with untreated cell cultures revealed fusiform microglial cells with rare delicate processes and a weak diffuse specific staining for PAR-1 (Fig. 5). Control experiments performed with nonspecific Igs or primary antibodies preabsorbed with a specific blocking peptide were negative (not shown). After exposure for 24 and 48 hr to 10 µM TMT, a stronger PAR-1-related immunoreactivity occurred in many activated microglial cells, which showed a rounding up of the cell body and a retraction of cell processes (Fig. 5). The percentage of the rounded and more positive cells increased at higher doses of TMT (50 µM) (Fig. 5).
Figure 5.
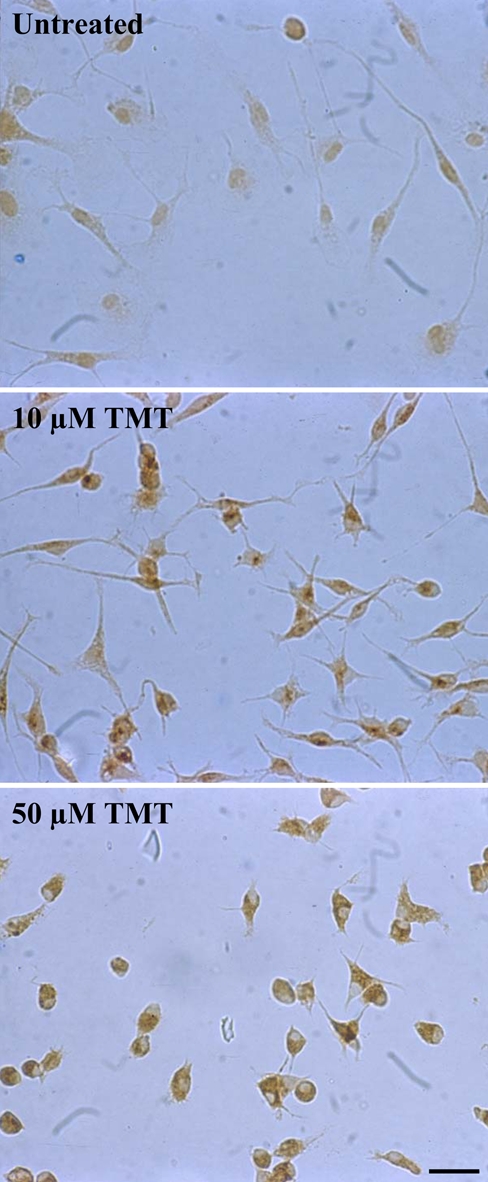
Protease-activated receptor–1 (PAR-1) immunostaining in rat primary microglia. Untreated microglial cells show a weak diffuse staining for PAR-1. After exposure to 10 µM trimethyltin (TMT) for 24 hr, a stronger immunoreactivity for PAR-1 is evident in activated microglial cells, which show a rounding up of the cell body and a retraction of cell processes. Following exposure to 50 µM TMT, almost all surviving microglial cells are rounded and intensely positive for PAR-1. Photographs show a representative image for five independent experiments. (Scale bar = 20 µm)
Western Blot Analysis in Rat Microglia Primary Cultures
Semiquantitative variation of PAR-1 in microglial cultures was measured by immunoblotting. This procedure was performed on lysates of microglial cells exposed (24 and 48 hr) to 10 µM TMT that was the minimum dose of this compound exerting cytotoxic activity under our experimental conditions. As shown in Figure 6, a single band was apparent for PAR-1 in normal (control) and experimental (TMT treatment) cultures, with an approximate increase by 2- to 3-fold following TMT treatment. No band was observed substituting primary antibody with an equivalent amount of nonspecific Igs or preabsorbing the primary PAR-1 antibody with the specific blocking peptide (not shown).
Figure 6.
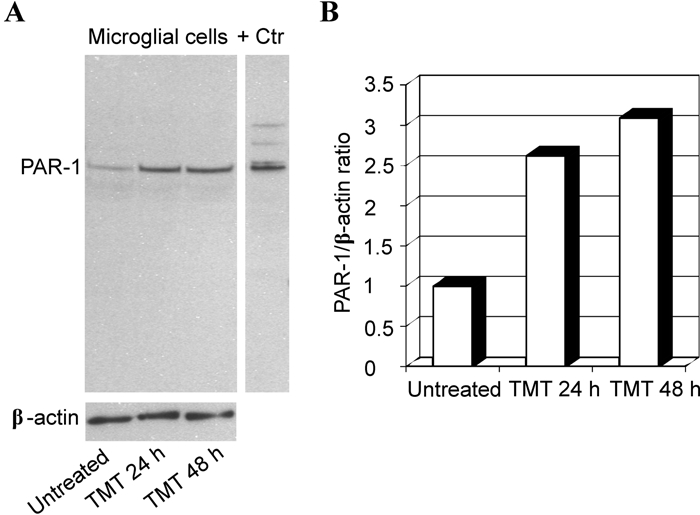
Western blot analysis of protease-activated receptor–1 (PAR-1) in rat primary microglia. Protein extracts were separated by SDS-PAGE, transferred to nitrocellulose, and probed sequentially for PAR-1 and β-actin. (A) Representative immunoblot shows that PAR-1 expression increases in the microglial lysates following 10 µM trimethyltin (TMT) treatment at 24 and 48 hr with respect to untreated cells. (B) Densitometric analysis of blot shown in panel A. Relative amounts of PAR-1 were calculated as a PAR-1 to β-actin ratio. + Ctr, positive control.
PAR-1 upregulation in microglia seems to be a specific effect of TMT because other toxic compounds, such as hydrogen peroxide and sodium azide, were ineffective in modifying PAR-1 expression at both 24 and 48 hr (not shown).
Discussion
Microglia are resident immune cells of the central nervous system (CNS). They are involved in the pathogenesis of diverse neurodegenerative diseases such as Alzheimer disease, Parkinson disease, and prion diseases, as well as multiple sclerosis, amyotrophic lateral sclerosis, and AIDS dementia (Wojtera et al. 2005; Garden and Möller 2006; Graeber and Streit 2010). Microglial activation is characterized by a gradual transition from a quiescent stellate form of the cells to a macrophage-like form, accompanied by an upregulation of surface antigens, in some cases by proliferation, and by the release of numerous bioactive factors (Ransohoff and Perry 2009). Numerous substances can trigger microglial activation, including thrombin and its cognate membrane receptors, the protease-activated receptors (PAR-1, -3, -4) (Weinstein et al. 2008). In this article, we studied the expression of PAR-1, the prototypic member of the PAR family, in rat microglia following exposure to the neurotoxicant TMT. A single systemic administration of TMT causes loss of hippocampal pyramidal cells in the rat brain, with a maximal decline in neurons occurring at 3 weeks postdosing (Balaban et al. 1988; Haga et al. 2002; Latini et al. 2010). Neuronal loss due to TMT is known to be associated with a marked microglial activation and astrogliosis over the same time period (O’Callaghan 1991; Barone 1993; Maier et al. 1995; McCann et al. 1996; Kuhlmann and Guilarte 2000; Brabeck et al. 2002; Geloso et al. 2004). In this respect, TMT-induced brain damage is a very interesting model of neurodegeneration, in which microglial activation has been described to occur. Consistently with the above-mentioned reports, our present results showed an evident microgliosis in the CA3 and hilus regions of the rat hippocampus already at 7 days after TMT intoxication. Interestingly, double immunofluorescence experiments allowed us to demonstrate that activated microglial cells (recognized by the specific marker OX-42) express PAR-1. Although widely reported as a specific marker for microglia, it has to be mentioned that OX-42 also labels dendritic cells, macrophages, and granulocytes. So far, the expression of functional PAR-1 has been mainly shown in vitro in primary rodent microglia and in the N9 microglial cell line (Möller et al. 2000; Suo et al. 2002; Balcaitis et al. 2003; Fabrizi et al. 2009). Only Henrich-Noack et al. (2006) had shown that focal ischemia induces a distinct staining for PAR-1 in cells with ramified microglial morphology in the penumbra zone of the infarct.
In the present experiments, we observed a specific PAR-1 immunoreactivity at the level of the cell body and processes of OX-42-positive cells. This observation is substantially in line with literature data that provided evidence for the presence of functional PAR-1 at relatively low density on the cellular surface and in relatively large quantities inside the cells, associated with an endosomal compartment spreading from the perinuclear region to the periphery of the cells (Horvat and Palade 1995; Wautier et al. 2007).
Our in vitro results indicated that TMT-treated microglial cells, showing a rounded body and a reduction of processes, were more intensely stained for PAR-1 with respect to control resting cells. This increase in PAR-1 expression was then clearly confirmed as a receptor upregulation by Western blot analysis. These data provide evidence that TMT administration can modify PAR-1 expression in microglial cell cultures, and the role exerted in vivo by molecules released from injured neurons and/or astrocytes should also be taken into account. In addition, it has also been shown in vitro that astrocytes trigger microglial activation after treatment with TMT (Rohl and Sievers 2005). Although our experiments were performed using high-purity microglial cultures, the contribution of the contaminant astrocytes to microglial activation cannot be ruled out. Moreover, because species-dependent differences in microglial response to thrombin have been previously reported (Weinstein et al. 2005), our data may not extend perfectly to other species.
As already observed in astrocytes (Pompili et al. 2006), PAR-1 remains unchanged also in microglia treated with toxic compounds such as hydrogen peroxide and sodium azide. This result indicates that the PAR-1 upregulation we detected in TMT-treated microglial cells is not just related to the induction of cell death.
Although the physiological significance of this upregulation remains to be determined, it is interesting to note that over the past years, several studies have suggested the involvement of microglial PARs, especially PAR-1, in the balance of inflammatory processes in the nervous system (Weinstein et al. 2008; Weinstein et al. 2009). In particular, our group has observed that the administration of PAR-1 activating peptides (TRAP6 and TFLLR) inhibits the production of the proinflammatory cytokines TNF-α and IL-6 in microglial cells treated with lipopolysaccharide, while promoting the release of the anti-inflammatory cytokine IL-10. Consistent with these data, PAR-1 stimulation upregulates the expression of the suppressor of cytokine signaling–3 (Fabrizi et al. 2009). These results support the view that in microglia, PAR-1 may be involved in the regulation of inflammatory reactions modulating the balance between pro- and anti-inflammatory cytokines.
In addition to the role in inflammatory processes, literature data also suggest that thrombin could be involved in the proliferation and microgliosis under trauma-induced conditions, and this effect seems at least partially mediated by PAR-1 (Laskowski et al. 2007).
The present study on microglial PAR-1 induction in the TMT model of neurodegeneration is in line with previous studies and indicates that PAR-1 expression may be associated with microglial response following brain damage. Further investigation is needed to fully clarify the pathways involved in these processes.
Footnotes
The author(s) declared no potential conflicts of interest with respect to the authorship and/or publication of this article.
The author(s) disclosed receipt of the following financial support for the research and/or authorship of this article: This work was supported by grants Università La Sapienza (Facoltà and Ateneo) and PRIN 2008 to Lorenzo Fumagalli and grants from Università Cattolica del S. Cuore and Ministry of Health to Fabrizio Michetti.
References
- Aloisi F, Ria F, Penna G, Adorini L. 1998. Microglia are more efficient than astrocytes in antigen processing and in Th1 but not Th2 cell activation. J Immunol. 160:4671–4680 [PubMed] [Google Scholar]
- Arora P, Ricks TK, Trejo J. 2007. Protease-activated receptor signalling, endocytic sorting and dysregulation in cancer. J Cell Sci. 120:921–928 [DOI] [PubMed] [Google Scholar]
- Balaban CD, O’Callaghan JP, Billingsley ML. 1988. Trimethyltin-induced neuronal damage in the rat brain: comparative studies using silver degeneration stains, immunocytochemistry and immunoassay for neuronotypic and gliotypic proteins. Neuroscience. 26:337–361 [DOI] [PubMed] [Google Scholar]
- Balcaitis S, Xie Y, Weinstein JR, Andersen H, Hanisch UK, Ransom BR, Möller T. 2003. Expression of proteinase-activated receptors in mouse microglial cells. Neuroreport. 14:2373–2377 [DOI] [PubMed] [Google Scholar]
- Barone S., Jr 1993. Developmental differences in neural damage following trimethyl-tin as demonstrated with GFAP immunohistochemistry. Ann N Y Acad Sci. 679:306–316 [DOI] [PubMed] [Google Scholar]
- Boven LA, Vergnolle N, Henry SD, Silva C, Imai Y, Holden J, Warren K, Hollenberg MD, Power C. 2003. Up-regulation of proteinase-activated receptor 1 expression in astrocytes during HIV encephalitis. J Immunol. 170:2638–2646 [DOI] [PubMed] [Google Scholar]
- Brabeck C, Michetti F, Geloso MC, Corvino V, Goezalan F, Meyermann R, Schluesener HJ. 2002. Expression of EMAP-II by activated monocytes/microglial cells in different regions of the rat hippocampus after trimethyltin-induced brain damage. Exp Neurol. 177:341–346 [DOI] [PubMed] [Google Scholar]
- Chang LW. 1986. Neuropathology of trimethyltin: a proposed pathogenetic mechanism. Fundam Appl Toxicol. 6:217–232 [DOI] [PubMed] [Google Scholar]
- Corvino V, Geloso MC, Cavallo V, Guadagni E, Passalacqua R, Florenzano F, Giannetti S, Molinari M, Michetti F. 2005. Enhanced neurogenesis during trimethyltin-induced neurodegeneration in the hippocampus of the adult rat. Brain Res Bull. 65:471–477 [DOI] [PubMed] [Google Scholar]
- Coughlin SR. 2005. Protease-activated receptors in hemostasis, thrombosis and vascular biology. J Thromb Haemost. 3:1800–1814 [DOI] [PubMed] [Google Scholar]
- Fabrizi C, Pompili E, Panetta B, Nori SL, Fumagalli L. 2009. Protease-activated receptor-1 regulates cytokine production and induces the suppressor of cytokine signaling-3 in microglia. Int J Mol Med. 24:367–371 [DOI] [PubMed] [Google Scholar]
- Garden GA, Möller T. 2006. Microglia biology in health and disease. J Neuroimmune Pharmacol. 1:127–137 [DOI] [PubMed] [Google Scholar]
- Geloso MC, Corvino V, Cavallo V, Toesca A, Guadagni E, Passalacqua R, Michetti F. 2004. Expression of astrocytic nestin in the rat hippocampus during trimethyltin-induced neurodegeneration. Neurosci Lett. 357:103–106 [DOI] [PubMed] [Google Scholar]
- Geloso MC, Vinesi P, Michetti F. 1996. Parvalbumin-immunoreactive neurons are not affected by trimethyltin-induced neurodegeneration in the rat hippocampus. Exp Neurol. 139:269–277 [DOI] [PubMed] [Google Scholar]
- Geloso MC, Vinesi P, Michetti F. 1997. Calretinin-containing neurons in trimethyltin-induced neurodegeneration in the rat hippocampus: an immunocytochemical study. Exp Neurol. 146:67–73 [DOI] [PubMed] [Google Scholar]
- Graeber MB, Streit WJ. 2010. Microglia: biology and pathology. Acta Neuropathol. 119:89–105 [DOI] [PubMed] [Google Scholar]
- Haga S, Haga C, Aizawa T, Ikeda K. 2002. Neuronal degeneration and glial cell-responses following trimethyltin intoxication in the rat. Acta Neuropathol. 103:575–582 [DOI] [PubMed] [Google Scholar]
- Hansen MB, Nielsen K, Berg K. 1989. Re-examination and further development of a precise and rapid dye method for measuring cell growth/cell kill. J Immunol Methods. 119:203–210 [DOI] [PubMed] [Google Scholar]
- Harry GJ, Funk JA, Lefebvre d’Hellencourt C, McPherson CA, Aoyama M. 2008. The type 1 interleukin 1 receptor is not required for the death of murine hippocampal dentate granule cells and microglia activation. Brain Res. 1194:8–20 [DOI] [PMC free article] [PubMed] [Google Scholar]
- Henrich-Noack P, Riek-Burchardt M, Baldauf K, Reiser G, Reymann KG. 2006. Focal ischemia induces expression of protease-activated receptor1 (PAR-1) and PAR-3 on microglia and enhances PAR-4 labeling in the penumbra. Brain Res. 1070:232–241 [DOI] [PubMed] [Google Scholar]
- Horvat R, Palade GE. 1995. The functional thrombin receptor is associated with the plasmalemma and a large endosomal network in cultured human umbilical vein endothelial cells. J Cell Sci. 108:1155–1164 [DOI] [PubMed] [Google Scholar]
- Ishida Y, Nagai A, Kobayashi S, Kim SU. 2006. Upregulation of protease-activated receptor-1 in astrocytes in Parkinson disease: astrocyte-mediated neuroprotection through increased levels of glutathione peroxidase. J Neuropathol Exp Neurol. 65:66–77 [DOI] [PubMed] [Google Scholar]
- Ishikawa K, Kubo T, Shibanoki S, Matsumoto A, Hata H, Asai S. 1997. degeneration inducing impairment of learning in rats: model of dementia? Behav Brain Res. 83:39–44 [DOI] [PubMed] [Google Scholar]
- Kuhlmann AC, Guilarte TR. 2000. Cellular and subcellular localization of peripheral benzodiazepine receptors after trimethyltin neurotoxicity. J Neurochem. 74:1694–1704 [DOI] [PubMed] [Google Scholar]
- Laskowski A, Reiser G, Reymann KG. 2007. Protease-activated receptor-1 induces generation of new microglia in the dentate gyrus of traumatised hippocampal slice cultures. Neurosci Lett. 415:17–21 [DOI] [PubMed] [Google Scholar]
- Latini L, Geloso MC, Corvino V, Giannetti S, Florenzano F, Viscomi MT, Michetti F, Molinari M. 2010. Trimethyltin intoxication up-regulates nitric oxide synthase in neurons and purinergic ionotropic receptor 2 in astrocytes in the hippocampus. J Neurosci Res. 88:500–509 [DOI] [PubMed] [Google Scholar]
- Luo W, Wang Y, Reiser G. 2007. Protease-activated receptors in the brain: receptor expression, activation, and functions in neurodegeneration and neuroprotection. Brain Res Rev. 56:331–345 [DOI] [PubMed] [Google Scholar]
- Maier WE, Brown HW, Tilson HA, Luster MI, Harry GJ. 1995. Trimethyltin increases interleukin (IL)-1 alpha, IL-6 and tumor necrosis factor alpha mRNA levels in rat hippocampus. J Neuroimmunol. 59:65–75 [DOI] [PubMed] [Google Scholar]
- McCann MJ, O’Callaghan JP, Martin PM, Bertram T, Streit WJ. 1996. Differential activation of microglia and astrocytes following trimethyltin-induced neurodegeneration. Neuroscience. 72:273–281 [DOI] [PubMed] [Google Scholar]
- Möller T, Hanisch UK, Ransom BR. 2000. Thrombin-induced activation of cultured rodent microglia. J Neurochem. 75:1539–1547 [DOI] [PubMed] [Google Scholar]
- O’Callaghan JP. 1991. Quantification of glial fibrillary acidic protein: comparison of slot-immunobinding assays with a novel sandwich ELISA. Neurotoxicol Teratol. 13:275–281 [DOI] [PubMed] [Google Scholar]
- Pompili E, Fabrizi C, Fumagalli L. 2006. PAR-1 upregulation by trimethyltin and lipopolysaccharide in cultured rat astrocytes. Int J Mol Med. 18:33–39 [PubMed] [Google Scholar]
- Pompili E, Nori SL, Geloso MC, Guadagni E, Corvino V, Michetti F, Fumagalli L. 2004. Trimethyltin-induced differential expression of PAR subtypes in reactive astrocytes of the rat hippocampus. Brain Res Mol Brain Res. 122:93–98 [DOI] [PubMed] [Google Scholar]
- Ransohoff RM, Perry VH. 2009. Microglial physiology: unique stimuli, specialized responses. Annu Rev Immunol. 27:119–145 [DOI] [PubMed] [Google Scholar]
- Rohl C, Sievers J. 2005. Microglia is activated by astrocytes in trimethyltin intoxication. Toxicol Appl Pharm. 204:36–45 [DOI] [PubMed] [Google Scholar]
- Sokolova E, Reiser G. 2008. Prothrombin/thrombin and the thrombin receptors PAR-1 and PAR-4 in the brain: localization, expression and participation in neurodegenerative diseases. Thromb Haemost. 100:576–581 [PubMed] [Google Scholar]
- Striggow F, Riek-Burchardt M, Kiesel A, Schmidt W, Henrich-Noack P, Breder J, Krug M, Reymann KG, Reiser G. 2001. Four different types of protease-activated receptors are widely expressed in the brain and are up-regulated in hippocampus by severe ischemia. Eur J Neurosci. 14:595–608 [DOI] [PubMed] [Google Scholar]
- Suo Z, Wu M, Ameenuddin S, Anderson HE, Zoloty JE, Citron BA, Andrade-Gordon P, Festoff BW. 2002. Participation of protease-activated receptor-1 in thrombin-induced microglial activation. J Neurochem. 80:655–666 [DOI] [PubMed] [Google Scholar]
- Wautier F, Wislet-Gendebien S, Chanas G, Rogister B, Leprince P. 2007. Regulation of nestin expression by thrombin and cell density in cultures of bone mesenchymal stem cells and radial glial cells. BMC Neurosci. 8:104. [DOI] [PMC free article] [PubMed] [Google Scholar]
- Weinstein JR, Ettinger RE, Zhang M, Andersen H, Hanisch UK, Möller T. 2008. Thrombin regulates CD40 expression in microglial cells. Neuroreport. 19:757–760 [DOI] [PubMed] [Google Scholar]
- Weinstein JR, Hong S, Kulman JD, Bishop C, Kuniyoshi J, Andersen H, Ransom BR, Hanisch UK, Möller T. 2005. Unraveling thrombin’s true microglia-activating potential: markedly disparate profiles of pharmaceutical-grade and commercial-grade thrombin preparations. J Neurochem. 95:1177–1187 [DOI] [PubMed] [Google Scholar]
- Weinstein JR, Zhang M, Kutlubaev M, Lee R, Bishop C, Andersen H, Hanisch UK, Möller T. 2009. Thrombin-induced regulation of CD95(Fas) expression in the N9 microglial cell line: evidence for involvement of proteinase-activated receptor(1) and extracellular signal-regulated kinase 1/2. Neurochem Res. 34:445–452 [DOI] [PubMed] [Google Scholar]
- Wojtera M, Sikorska B, Sobow T, Liberski PP. 2005. Microglial cells in neurodegenerative disorders. Folia Neuropathol. 43:311–321 [PubMed] [Google Scholar]


