

Abstract
Human Helicobacter pylori infection leads to multiple pathological consequences, including gastritis and adenocarcinoma. Although this association has led to the classification of H. pylori as a type 1 carcinogen, it is not clear if additional nonhelicobacter gastric microbiota play a role in these diseases. In this study, we utilized either specific pathogen-free C57BL/6 mice (B6.SPF) or mice colonized with altered Schaedler flora (B6.ASF) to evaluate the role of nonhelicobacter gastric microbiota in disease development after Helicobacter felis infection. Despite similar histological changes, H. felis persisted in B6.ASF stomachs, while H. felis could no longer be detected in the majority of B6.SPF mice. The B6.SPF mice also acquired multiple Lactobacillus spp. in their stomachs after H. felis infection. Our data indicate that potential mechanisms responsible for the ineffective H. felis clearance in the B6.ASF model include the absence of new gastric microbiota to compete for the gastric niche, the lack of expression of new gastric mucins, and a reduced ratio of H. felis–specific IgG2c:IgG1 serum antibodies. These data suggest that although H. felis is sufficient to initiate gastric inflammation and atrophy, bacterial eradication and the systemic immune response to infection are significantly influenced by pre-existing and acquired gastric microbiota.
Keywords: helicobacter, gnotobiotic, gastric, cytokine, antibody, immunofluorescence, lactobacillus
Helicobacter pylori is one of the most common bacterial infections worldwide and has several pathological manifestations (Correa and Piazuelo 2008; Herrera and Parsonnet 2009). In a subset of individuals, infection is associated with chronic active gastritis, gastric atrophy, and loss of parietal and zymogenic cells, which lead to alterations in the protective mucus layer and a shift toward neutral pH (Cover and Blaser 2009). It has been proposed that these changes allow carcinogens and microbial components the opportunity to interact with the gastric epithelium and cause alterations in cellular DNA, leading to the progression to gastric adenocarcinoma. However, the role of additional colonization of the stomach by microbiota other than helicobacter, during infection-associated gastritis, has not been directly tested.
Most gastric carcinomas arise from a background of atrophic gastritis, and the extent of atrophy increases the risk (El-Zimaity 2008). Although H. pylori is believed to be the cause of most gastric atrophy, other inflammatory conditions such as autoimmune atrophic gastritis can also be associated with atrophy and a marked loss of parietal cells. In a mouse model of parietal cell depletion, the absence of this differentiated cell type altered gastric glandular morphology but did not lead to inflammation or the development of gastric adenocarcinoma (Berg 1996). This finding raises the possibility that it is not solely the loss of this differentiated cell type that links atrophy to carcinogenesis but is instead the subsequent increase in pH in association with an inflamed stomach that may then allow other bacteria to enter the gastric milieu and alter the host response (Houben and Stockbrugger 1995). In a study done by Dicksved et al. (2009), the gastric microbial populations of patients receiving acid-reducing therapies were similar to patients with gastric cancer. In addition, other bacteria such as Acinetobacter lwoffii can colonize the stomach and cause histological and inflammatory changes similar to a helicobacter infection (Rathinavelu et al. 2003; Zavros et al. 2002).
The original characterization of Helicobacter felis and its ability to cause histological progression to dysplasia in a chronic active inflammatory state was performed in germ-free animals (Fox et al. 1991). Since then, several groups have published findings comparing specific pathogen-free (SPF) and germ-free (GF) animals. Yamaguchi et al. (2003) demonstrated that when SPF C57BL/6 mice and GF IQI mice were immunized with H. pylori heat shock protein 60 prior to infection with an H. pylori isolate from a patient with gastritis, only the SPF C57BL/6 mice developed postimmunization gastritis, leading to the conclusion that additional gastric bacteria may play a role in the development of gastritis. Aebischer et al. (2006) utilized clone libraries of gastric 16S rRNA genes to analyze the composition of the gastric microbiota in BALB/c mice infected with H. pylori (strain P76) for 8 weeks and determined that in noninfected mice, Lactobacilli spp. dominated the gastric microbiota, while the infected stomachs were colonized with Clostridium spp., Bacteroides/Prevotella spp., Eubacterium spp., Ruminococcus spp., Streptococci spp., and Escherichia coli, all of which normally colonized the lower intestinal tract. The gastric environment altered by H. pylori could be mimicking that of the lower gastrointestinal tract, allowing these bacteria to flourish. However, Tan et al. (2007) reported gastric microbiota did not change after 6 months in C57BL/6 mice infected with H. pylori (strain SS1) and was dominated by Lactobacillus reuteri and Lactobacillus murinus. One explanation could be that this strain of helicobacter does not induce extensive inflammation, which may also play a role in altering the gastric milieu and subsequent bacterial colonization.
In order to comprehensively and systematically address the influence of microbiota in helicobacter infection, we utilized our well-defined H. felis model system to create a hypochlorous microenvironment and then studied the influence of acquisition of additional bacteria on gastric inflammation and histology. This model has been shown consistently and effectively to mimic H. pylori infection and disease progression seen in humans, even though H. felis is negative for both the VacA and CagA virulence genes (McCracken et al. 2005; Mohammadi et al. 1996; Roth et al. 1999). Initially, three groups of C57BL/6 mice were used: germ free/gnotobiotic (B6.GB), gnotobiotic colonized with altered Schaedler flora (B6.ASF), and specific pathogen free (B6.SPF). Altered Schaedler flora is a cocktail of eight different bacterial strains known to colonize the gastrointestinal tract in mice, thereby making the B6.ASF mouse an ideal model to study the role of commensal gastrointestinal organisms during H. felis infection (Dewhirst et al. 1999; Sarma-Rupavtarm et al. 2004; Schaedler et al. 1965). As the B6.GB and B6.ASF mice are continuously housed in a gnotobiotic facility, they can acquire no additional bacteria (other than the administered H. felis); in contrast, the B6.SPF mice can acquire any nonpathogenic bacteria present in our animal SPF facility. This allowed a direct evaluation of how environmental microbiota can influence disease progression.
Materials and Methods
Mice
Inbred mouse strains between 6 and 10 weeks of age at the time of initial infection were used in this study. All animals were female and were determined to be helicobacter free prior to the initiation of the experiment by either The Jackson Laboratory (B6.SPF) or routine screening by the UAB Gnotobiotic and Genetically Engineered Mouse Core (B6.ASF). B6.SPF mice were obtained from The Jackson Laboratory (Bar Harbor, ME) and housed in ventilated racks (Thoren Caging Systems Inc.; Hazleton, PA). All caging, bedding, water, and food were sterilized prior to use. The detailed list of our facility’s SPF conditions can be accessed at http://main.uab.edu/sites/ComparativePathology/surveillance/.
B6.SJL-Ptprca Pepcb/BoyJ (gnotobiotic; B6.GB) and B6.SJL-Ptprca Pepcb/BoyJ (altered Schaedler flora; B6.ASF) were maintained in Trexler-type (Standard Safety Equipment Co.; Palatine, IL) or semirigid isolators (Park Bioservices; Groveland, MA) according to standard gnotobiotic methods. GB status was monitored by monthly aerobic and anaerobic cultures of fecal and water samples and by examination of Gram-stained fecal specimens. Colonization with ASF organisms (Clostridium sp. [ASF356], Lactobacillus sp. [ASF360], L. murinus [ASF361], Mucispirillum schaedleri [ASF457], Eubacterium plexicaudatum [ASF492], low G + C content Gram-positive group [ASF500], Clostridum sp. [ASF502], and Bacteroides sp. [ASF519]) was monitored by examination of Gram-stained fecal specimens for each bacterial morphological type (Johnson et al. 1995). All mice were raised on autoclaved standard laboratory mouse chow (NIH-31; Harlan Teklad, Madison, WI) and filter-sterilized autoclaved water ad libitum and housed in a facility that maintained a 12:12-hour light-dark schedule. All animal protocols and procedures were conducted in accordance with the Institutional Animal Care and Use Committee at the University of Alabama at Birmingham. B6.SJL-Ptprca Pepcb/BoyJ and B6 mice respond similarly to H. felis infection (De Bock et al. 2005).
H. felis Infection
Both mouse models, B6.SPF and B6.ASF, were mock infected or infected with H. felis organisms prepared as described previously (Roth et al. 1999). At least five mice were included in each group, and infections were done twice for each model. Mice were orally inoculated on days 1, 4, and 7 with sterile brain-heart infusion broth (BHI)/glycerol (mock-infected mice) or 5 × 10⁷ CFU H. felis (ATCC 49179) in BHI/glycerol (25 µL). One OD450 corresponds to 109 bacteria. This infection protocol results in approximately 100% colonization efficiency in our laboratory. Infection was verified by immunofluorescent staining for helicobacter, as described below.
Tissue Preparation
Mice were injected intraperitoneally with 5-Bromo-2-DeoxyUridine (BrdU, 120 mg/kg; Sigma, St. Louis, MO). After 90 minutes, mice were euthanized using isofluorane inhalation followed by cervical dislocation. The stomach was immediately removed, rinsed in PBS, and quartered. One quarter was immersed in RNALater (Ambion; Austin, TX) for RNA isolation, and one quarter was immersion fixed in cold 4C Bouin’s solution (Fisher Scientific; Pittsburg, PA) overnight at 4C, then changed to ethanol, and placed in cassettes for embedding in paraffin (Zaidi et al. 2001). The tissue was cut into 5-µm sections on a microtome and attached to precleaned microscope slides (Snowcoat X-tra; Surgipath, Richmond, IL). The remaining two-quarter sections were snap frozen in liquid nitrogen and stored at −80C until ready for DNA isolation for denaturing gradient gel electrophoresis (DGGE) analysis and quantitative bacterial PCR.
Immunofluorescence and BrdU Staining
To identify parietal cells, gastric cells expressing H/K-ATPase were identified by a “mouse-on-mouse” immunostaining procedure (Brown et al. 2004). Briefly, slides were deparaffinized through washes of Citrosolv (Fisher Scientific) and isopropanol and rinsed in running DI water for 5 minutes. After rehydrating in PBS, slides were blocked in PBS-blocking buffer (PBS-BB) (1% bovine serum albumin, 0.2% powdered skim milk, 0.03% Triton X-100) and normal mouse serum (10%) for 1 hour. Mouse anti–H/K-ATPase (5 mg/mL; Sigma) and Cy3 goat anti-mouse IgG Fab fragment (1.6 mg/mL; Jackson Immunoresearch, West Grove, PA) were incubated at a 1:2 ratio in PBS with 1% BSA in the dark for 20 to 40 minutes at room temperature. The antibody solution was then incubated with PBS/BSA (1%) with 10% normal mouse serum at a final dilution of 1:1000 for 10 minutes at room temperature and subsequently added to the slide. After incubating 1 hour in the dark at room temperature in a humidity chamber, slides were washed in PBS and counterstained with Hoechst (0.5 ug/mL, H33258, bis-Benzimide; Sigma).
To visualize the other major population of differentiated gastric epithelial cells, slides were deparaffinized, rinsed with DI water, and rehydrated with PBS. Avidin- and biotin-blocking reagents (Avidin-Biotin Blocking Kit; Vector Laboratories, Burlingame, CA) were sequentially incubated on the slides for 15 minutes at room temperature in a humidity chamber. Slides were washed with PBS after each blocking solution. Slides were incubated at room temperature for 15 minutes with PBS-BB, primary antibodies (diluted in PBS-BB) were added, and the slides were incubated overnight at 4C. After washing slides in PBS, donkey anti-rabbit Cy3 (Jackson Immunoresearch) was diluted 1:250 in PBS-BB and incubated on the slide for 1 hour in the dark. After a PBS rinse, slides were counterstained with Hoechst to label nuclei. Primary antibodies used were rabbit anti-intrinsic factor (zymogenic cells) and rabbit anti-pepsinogen (prezymogenic cells and zymogenic cells). Mucus neck cells were identified by a FITC-conjugated lectin, N-acetyl-D-glucoaminyl–specific Griffonia simplifolica II (GSII). These procedures and antibodies have all been described in our previous publication (Lorenz and Gordon 1993).
To identify rapidly dividing stem or early daughter cells, slides were deparaffinized and boiled for 1 minute, and then endogenous peroxidases were blocked using H2O2 (3%) in methanol for 5 minutes at room temperature, followed by a rinse in DI water. Slides were blocked using PBS-BB and avidin and biotin reagents as previously outlined. Goat anti-BrdU (a kind gift of Dr. S.M. Cohn of the University of Virginia) was applied to the slide overnight at 4C (1:1000). Biotin anti-goat (Jackson Immunoresearch) was diluted 1:250 in PBS-BB, and the slides were incubated for 1 hour and washed with PBS. Streptavidin-HRP (Jackson Immunoresearch) was diluted 1:100 in the same buffer and incubated at room temperature for 30 minutes. Finally, the Tyramide Amplification System was used with Cy3 Plus (Perkin Elmer; Waltham, MA) as per the manufacturer’s instructions, and the nuclei were identified by Hoechst staining.
Histological Analysis and H. felis Colonization
Tissue sections of each stomach were stained with hematoxylin and eosin and scored using our previously published histological scoring system (Roth et al. 1999). To semiquantitate the level of H. felis gastric colonization, each stomach section was stained with undiluted rabbit anti–H. pylori antibody (SIG-3431; Covance, Emeryville, CA), which crossreacts with H. felis and H. hepaticus, but not Lactobacillus spp. found in the stomachs of our C57BL/6 colony (data not shown). Stomach sections were deparaffinized as previously described. The sections were rehydrated with PBS and pretreated with 0.25% pepsin in PBS for 10 minutes at room temperature. PBS-BB was added to the slides to block nonspecific binding proteins and permeabilize the sections, and the slides were then incubated with antihelicobacter antibody for 1 hour at room temperature, followed by a PBS wash and detection by incubation for 1 hour with Cy3 donkey anti-rabbit (Jackson Immunoresearch). Nuclei were counterstained with Hoechst 33258 as described above. Colonization of the antrum was evaluated on a 0-to-4 scale as previously described (Roth et al. 1999). All evaluations were performed by investigators blinded to the experimental conditions.
The number of helicobacter organisms present per quarter stomach section was also analyzed via a quantitative PCR for H. felis urease B. Briefly, gastric DNA (extraction detailed below) was prepared and amplified using SYBR Green PCR Master Mix (Applied Biosystems; Foster City, CA) as per the manufacturer’s instructions. The urease primers were HFUREB999F (GTT TGC CGA TTC GAG GAT TC) and HFUREB1062R (CCC CAT GTC ATG GAG TTG G). The PCR conditions were 95C for 10 minutes (1 cycle), 95C for 15 seconds and 63C for 18 seconds (40 cycles), then 95C for 1 minute, 55C for 30 seconds, and 95C for 30 seconds. Quantitative polymerase chain reaction (QPCR) was performed using the MX3000P real-time PCR system (Stratagene; La Jolla, CA) with detection during the 63C part of the cycle. A standard curve for H. felis quantitation was established by routine DNA extraction of stomach tissue (quarter stomachs) spiked with known amounts of H. felis organisms (quantitated via hemacytometer counting).
RNA Isolation and Quantitation
Total RNA was isolated from the quarter stomach using the phenol and guanidine isothiocyanate method with Trizol (Invitrogen; Carlsbad, CA). Total RNA was processed through a genomic DNA clean-up step utilizing the Turbo DNase kit (Ambion). cDNA was made with equal amounts of mRNA (2 µg), using the Roche Transcriptor First Strand cDNA Synthesis Kit (Roche; Penzberg, Germany). Using Applied Biosystems Assays-On-Demand primer/probe sets (Eukaryotic 18S–housekeeping gene, Hs99999901_s1; muc4, Mm00466886_m1; muc5ac, Mm01276725_g1; muc5b, Mm00466376_m1; tff1, Mm00436945_m1; IFNg, Mm00801778_m1; IL10, Mm00439616_m1; IL17, Mm00439619_m1) and TaqMan Universal PCR Mix (Applied Biosystems), quantitative real-time reverse transcription polymerase chain reaction (QRT-PCR) was performed using the MX3000P real-time PCR system (Stratagene). Data were analyzed by the “delta-delta Ct” relative quantitation method as described in the manufacturer’s instructions (4371095 Rev A; Applied Biosystems). The average crossing threshold of the housekeeping gene (18S) is subtracted from the average crossing threshold of each target gene to determine the relative expression (ΔCt). The 18S gene was used as our housekeeping gene, as published results indicate it has relatively stable expression under inflammatory conditions (Bas et al. 2004; Ropenga et al. 2004; Rubie et al. 2005). To determine the fold change, the experimental animal data (H. felis infected) are compared to the control (as indicated in each figure legend) for each gene. The upper and lower limits of the average fold change were determined using the standard deviation of the ΔCt of the experimental group in the 2ΔΔCt formula, as outlined in the manufacturer’s protocol.
Gastric DNA Extraction
Mouse stomach quarters were flash frozen in liquid nitrogen and then stored at −80C. DNA extraction was performed using four gastric washes of 0.1% Tween 20 (Fisher Scientific) in PBS. The thawed stomach section was combined with 5 mL of this solution and vortexed for 30 seconds. The wash solution was collected and centrifuged at 5000 rpm for 15 minutes. The pellet was resuspended in Tris/EDTA (TE, pH 8.0; Ambion) and Tris-saturated phenol and combined with 200 µL of 0.1-mm glass beads. This solution was shaken for 15 minutes and immediately immersed in an ice bath. The final solution was centrifuged for 5 minutes at 11,000 rpm. Phenol/chloroform (PC) was used to extract DNA. Two successive PC extractions were performed, with centrifugation at 11,000 rpm for 5 minutes between steps, removing the top layer for the next step. After the second PC extraction, the supernatant was combined with sodium acetate and 100% ethanol. This was stored on ice for 5 minutes to precipitate the DNA and then centrifuged at 11,000 rpm for 5 minutes. The pellet was washed with 70% ethanol, centrifuged again, and resuspended in TE.
PCR of Gastric DNA
DNA samples were exposed to polymerase chain reaction (PCR) to amplify the V3 region of the 16S ribosomal DNA (Muyzer et al. 1993). A master mix of 5 µL of 10x buffer (TaKaRa/Clontech; Madison, WI), 4 µL of deoxyribonucleic acid nucleotides (TaKaRa/Clontech), 0.25 µL of Hotstart Taq polymerase (TaKaRa/Clontech), 8.75 µL of sterile water, and 1 µL of both forward and reverse primers was prepared (20 µL total). The forward primer used was 5’CGCCCGCCGCGCGCGGCGGGCGGGGGGGGCACGGGGGGCCTACGGGAGGCAGCAG 3’ (Sigma). The reverse primer used was 5’ATTACCGCGGCTGCTGG 3’(Sigma). The master mix was combined with 150 ng of DNA and water to make a total reaction volume of 50 µL. This was exposed to the following PCR conditions utilizing a Perkin Elmer Gene Amp PCR System 2400. Initial denaturation at 95C for 5 minutes was followed by 20 cycles at 95C for 1 minute, annealing for 45 seconds, and 72C for 1 minute. Initial annealing temperature was 65C; this was ramped down to 0.5C per cycle over 20 cycles. Following the 20 cycles, 10 additional cycles at 95C for 1 minute, 55C for 45 seconds, and 72C for 1 minute were performed. A final step at 72C for 5 minutes was performed, and the samples were stored at −20C.
DGGE and Total Bacteria Quantitative PCR of Gastric Tissue
A Bio-Rad DCode system (Bio-Rad Laboratories; Hercules, CA) was used to perform DGGE. PCR fragments were separated using polyacrylamide gels with 8% of a 37:1 acrylamide-bisacrylamide mixture in 0.5x TAE buffer and 35% to 60% linear DNA-denaturing gradients (where 100% denaturant is equivalent to 7 M urea and 40% deionized formamide) (Muyzer et al. 1993). The gradient was formed with the Bio-Rad Gradient Delivery System (Model 475; Bio-Rad Laboratories). After 2 hours of polymerization, the gel was loaded with a combination of 15 µL of the PCR product and 15 µL of loading buffer. Gels were run overnight at 58C and 58 V. The gel was stained with ethidium bromide (Bio-Rad Laboratories) and imaged under ultraviolet light.
To identify organisms represented by DGGE bands, specific bands are cut out of the gel and stored at −20C until use, when they are thawed and transferred to a new tube. The band is crushed and frozen/thawed at −20C using 50 µL milliQ water. Using the primers previously described except with M13 vector tails added, PCR is done, and the DNA concentration is measured at 260 nm. Samples are diluted to 50 ng/µL and submitted to the Heflin Center for Genomic Science at UAB. The sequence is then matched to a genus and species using the Ribosomal Database Project at Michigan State University (http://rdp.cme.msu.edu/seqmatch/seqmatch_intro.jsp).
Total bacterial genome copy number per stomach was calculated by using a plasmid standard containing a part of the 16S ribosomal DNA from Ruminococcus productus strain VPI (ATCC 27340D-5), which had been generated by PCR using the universal primers described above for preparation of DNA for DGGE. Stomach DNA samples (generated as described) were amplified using SYBR Green Master Mix (Applied Biosystems) and published primers to detect total bacteria (UniF340, ACTCCTACGGGAGGCAGCAGT; UniR514, ATTACCGCGGCTGCTGGC) (Hartman et al. 2009).
Serum and Fecal Collection
Whole blood was collected immediately upon sacrifice by cardiac puncture. Blood was allowed to clot for 1 hour, and serum was separated by centrifugation at 13,000 rpm. The sera samples were stored at −20C until assays were performed. During the sacrifice of the animals, fresh fecal samples were collected. A solution of PBS supplemented with 0.05% NaN3 and mammalian protease inhibitor (10 µL/mL; Sigma) was added to the feces at a concentration of 10 µL/mg of feces. The feces solution was vortexed and frozen overnight at −20C. The frozen solution was thawed on ice and vortexed for 10 minutes, followed by centrifugation at 13,000 rpm. The supernatants were stored at −20C until further analysis.
Preparation of H. felis Antigen
The organisms were harvested as described for inoculation, washed in PBS, and sonicated on ice for 30 seconds, alternated with 30 seconds of cooling, for a total of 4 minutes using setting 4 on Branson Sonifer 250 (Branson Ultrasonics; Danbury, CT). The bacterial suspension was centrifuged at 20,000 × g at 4C for 20 minutes. The supernatant was passed through a 0.22-µm filter, and supernatants were frozen at −80C until further use. Total protein concentration was determined by the DC Protein Assay (Bio-Rad Laboratories).
Analysis of H. felis-Specific Antibodies
ELISAs were performed to determine the specific antibody response to H. felis in both fecal and serum samples. A 96-well Immunlon Assay Plate (Fisher Scientific) was coated with H. felis sonicate (10 µg/mL in PBS) overnight at 4C. Plates were washed, nonspecific binding sites were blocked with 5% bovine serum albumin (BSA; Fisher Scientific), and the samples were added. After washing, alkaline phosphatase-linked goat anti-mouse IgG1, IgG2c, or IgA (Southern Biotech; Birmingham, AL) were added, the plate was washed, and the bound secondary antibody was detected using pNPP substrate solution (N-2770; Sigma). The plates were read on a VERSAmax microplate reader (Molecular Devices; Sunnyvale, CA) at 405 nm. For comparison purposes, the concentration of IgG1, IgG2c, or IgA anti–H. felis was estimated based on a standard curve of the corresponding Ig (Cat #5300-01; Southern Biotech) that was run on each plate. These wells were coated with 10 µg/mL goat anti-mouse Ig (Southern Biotech) for IgG1 and IgA and 10 ug/mL goat anti-mouse IgG2c to quantitate IgG2c (Southern Biotech). This type of analysis does not take into account the differences in affinity/avidity of the antibody for its cognate antigen and therefore can only be used to make relative comparisons between the treatment groups.
Graphic and Statistical Analysis
Histology, colonization, and antibody graphs were made using GraphPad Prism 4 (GraphPad Software; San Diego, CA); RNA expression graphs were made using version 5. QRT-PCR graphs are vertical oriented, with the x-axis set to represent baseline expression for each gene (fold change = 1). The mean fold change and range are represented in the graph. The infected animals were initially compared to B6.SPF mock controls, as the comparison between baseline mock B6.ASF and B6.SPF mice indicated similar expression levels. Statistical analysis of continuous data was performed using the unpaired t-test at http://www.quantitativeskills.com/sisa/. For the QRT-PCR data, statistics were performed on the ΔΔCt value and are considered continuous data. Statistics on noncontinuous data were performed with the Mann-Whitney U test in GraphPad Prism 5. Comparisons having a p ≤ 0.05 were considered significant and are indicated by asterisks.
Results
B6.GB Mice Have Shortened Gastric Glands and a Decreased Proliferative Zone
As there has been no previous description of the mouse gastric glandular architecture under gnotobiotic conditions, we first investigated the presence or absence of differentiated gastric cell types by immunofluorescence microscopy. There is no appreciable histological difference in the organization or proportion of parietal or zymogenic cells, as identified by H/K-ATPase and intrinsic factor staining, respectively, in uninfected B6.SPF, B6.GB, and B6.ASF stomachs (Fig. 1 A-F). However, there are two striking alterations seen in the B6.GB mouse stomach when compared to the microbially colonized B6.SPF and B6.ASF mice. First, there is a considerable shortening of gastric gland length in the B6.GB mice (Fig. 1 B, E, H, K). Also, identification of rapidly dividing cells, based on BrdU incorporation and immunostaining, demonstrates that the B6.GB has fewer gastric stem and early daughter cells moving through the cell cycle (Fig. 1K). This could account, at least in part, for the shortened length.
Figure 1.

Gnotobiotic mice exhibit reduced pepsinogen expression and fewer rapidly proliferating epithelial cells in gastric zymogenic glands. The distribution and proportions of H/K-ATPase (red, A-C) and intrinsic factor–expressing cells (red, D-F) are similar in uninfected mice in all groups. Pepsinogen expression (red, G-I) and proliferation, as shown by BrdU incorporation/detection (red, J-L), are similar in the B6.SPF (G, J) and the B6.ASF mice (I, L); however, B6.GB mice have reduced pepsinogen-expressing and rapidly proliferating cells (H, K). (D-I) These are also stained for mucus neck cells using the lectin GSII (green). There is an absence of co-stained GSII/pepsinogen cells in H, indicating an absence of prezymogenic cells. All slides were counterstained with Hoechst to stain nuclei (blue). Scale bar = 50 um.
Second, the cells expressing pepsinogen appear to be dramatically reduced in the B6.GB stomach (Fig. 1H). In a normal gastric gland, pepsinogen is initially produced in prezymogenic cells, as they transition from mucus neck cells into true zymogenic cells at the base of the gland (Karam and Leblond 1995; Lorenz and Gordon 1993). In the B6.GB mouse gastric gland, there is no co-localization between GSII and pepsinogen, which is the usual method of identifying these prezymogenic cells. The absence of these gastric epithelial cells, which co-express both mucus neck and zymogenic properties, indicates that the microbiota clearly play a role in this component of the normal gastric differentiation pathway. Due to this dramatic alteration in gastric glandular structure, the decision was made to not include the B6.GF stomachs in the H. felis infection experiments, as it would be difficult to differentiate changes in colonization and histology due to bacterial influences from those potentially caused by the absence of prezymogenic cells.
Commensal Microbiota Do Not Alter Dysplasia but Do Effect Long-Term H. felis Colonization
B6.SPF and B6.ASF animals were infected for 8 and 24 weeks with H. felis. The mock-infected stomachs of both groups have normal stomach architecture and no inflammation (Fig. 2 A, D). The histological scores for the mock-infected mice were similar to unmanipulated controls at each time point (Fig. 3 A, C). By 24 weeks post–H. felis infection, B6.SPF and B6.ASF both progress to gastric dysplasia, as noted by the loss of parietal and zymogenic cells, have increased numbers of mucus-producing cells, and show lengthened and abnormal gastric glands, as well as an increased inflammatory infiltrate (Fig. 2 C, F). Quantitation of the histological changes confirms the similarity in epithelial response to infection in both models (Fig. 3A, C). Despite this similarity in the histological picture, the bacterial colonization scores are surprisingly different. The majority of B6.SPF mice display decreased H. felis colonization by 24 weeks after inoculation (Fig. 3B), while most B6.ASF mice are never able to reduce their levels of bacterial colonization after inoculation (Fig. 3D). At 24 weeks after infection, 87.5% (7/8) of the B6.SPF mice had decreased colonization to below the level of detection by our assays, while only 25% (1/4) of the B6.ASF mice had no detectable organisms. This semiquantitative analysis by immunofluorescence was also confirmed by QPCR for helicobacter urease B gene. This QPCR has a detection limit of 1 × 10⁴ organisms per quarter stomach. This assay detected no helicobacter organisms in any of the mock-infected mice or in the 8- and 24-week infected B6.SPF mice available for testing. (Unfortunately, not enough DNA remained from the 24-week B6.SPF gastric sample with a HF colonization score of 3 to include in this QPCR.) However, the 8-week infected B6.ASF mice had 1.1 × 10⁴ ± 7.7 × 10³ per quarter stomach, and the 24-week infected B6.ASF mice had 4.9 × 10⁴ ± 5.5 × 10⁴ per quarter stomach. It should be noted that this wide range of infection directly correlates with the scoring range of organisms in our semiquantitative immunofluorescent HF colonization assay (i.e., high HF colonization scores correlated with high H. felis organism quantitation in the QPCR assay).
Figure 2.

H. felis infection of both B6.SPF and B6.ASF stomachs results in extensive immune infiltrates and alteration of gastric zymogenic glands. Uninfected stomachs show similar gastric zymogenic gland structure 24 weeks after mock infection (A, D). Stomachs infected with H. felis for 8 and 24 weeks demonstrate gastric infiltrates, loss of parietal and zymogenic cells, and an expansion of mucus-producing neck cells, and both groups of mice progress to gastric dysplasia after 24 weeks of H. felis infection (B, C, E, F). There was no visible difference seen in the histological changes between the B6.SPF and B6.ASF mice. H&E stain. Scale bar = 50 um.
Figure 3.

B6.SPF and B6.ASF stomachs after H. felis infection show similar histological scores but significant differences in H. felis colonization. All experimental groups exhibit extensive pathological lesions, as measured by a histological scoring system that includes both epithelial histological changes and inflammation (A, C). The levels of colonization are decreased below the level of detection in the majority of B6.SPF mice (B), while only a minority of B6.ASF mice is able to eradicate H. felis by 24 weeks after infection (D). Dots represent individual infected mice, and the line represents the median of each group. Comparisons were made to the same strain mock-infected mice (*) or to the B6.SPF 24-week H. felis–infected mice (#) using the Mann-Whitney U test; significance was defined as p < 0.05.
B6.SPF Acquired Multiple New Gastric Microbiota after H. felis Infection
One potential mechanism for enhanced bacterial clearance could be an increase in diversity of the microbiota present in the gastric niche. As H. felis infection changes the luminal pH of the stomach towards neutral, bacteria that could not previously survive in the acidic environment may now find conditions appropriate for colonization. In order to test this hypothesis, the composition of the gastric microbiota was evaluated before and after H. felis infection. Figure 4A clearly shows the B6.SPF animals acquired multiple new bacterial species as early as 8 weeks after H. felis infection (Fig. 4A, box c). This increased diversity of microbiota is accompanied by clearance of H. felis from the gastric environment (Fig. 4A, box d). However, as per the experimental design, the infected B6.ASF mice cannot obtain any additional bacterial diversity, and only ASF organisms (Lactobacillus spp. and L. murinus) (Fig. 4A, arrows a, b), as well as a faint band of colonizing H. felis, are seen (Fig. 4B, box d). When the major bands were cut out from the DGGE gel and sequenced, the band, which was persistent in the B6.ASF mice (Fig. 4B, arrow b) and is acquired in the B6.SPF mice (Fig. 4A, arrow b), was identified as one of the expected ASF strains, L. murinus. The lower bands in the B6.SPF gastric washes (Fig. 4A, box c) represent bacteria, all of which have high G + C content. Several of these bands were identified as Lactobacillus spp. (L. johnsonii, L. acidophilis, and L. reuteri), but no bacteria that are considered pathogens were identified. All of these organisms could be acquired by the coprophagic behavior of the mice, and our data cannot determine whether they are true colonizers or just transient members of the gastric microbiota.
Figure 4.

B6.SPF animals demonstrate increased gastric microbial diversity after H. felis infection. The B6.SPF (A) mice effectively clear H. felis, whereas 24-week infected B6.ASF (B) mice do not (box d). The band indicated by arrow “a” is a Lactobacillus sp. that is part of the ASF cocktail and is also persistent in the B6.SPF uninfected stomach. The B6.SPF mice acquired L. murinus, also a component of ASF, 24 weeks after H. felis infection (arrow b). Additionally after infection, the B6.SPF mice acquired several high G + C bacteria (A, box c), including L. johnsonii, L. acidophilis, and L. reuteri. This group of bacteria is not found in the B6.ASF mice (B, box c).
Using a QPCR for total bacterial DNA, we also evaluated whether there was an increase in bacterial numbers to accompany the increase in bacterial diversity in the H. felis–infected B6.SPF stomachs. Our results indicate that there was no significant change in total bacterial numbers between mock- and H. felis–infected stomachs from either the B6.SPF or B6.ASF mice (24-week data: B6.SPF mock = 9.1 × 10⁸ ± 6.1 × 10⁸; B6.SPF H. felis infected = 2.7 × 10⁹ ± 2.2 × 10⁹; B6.ASF mock = 1.7 × 10⁹ ± 1.4 × 10⁹; B6.ASF H. felis infected = 2.6 × 10⁹ ± 1.9 × 10⁹). These data allow us to conclude that H. felis infection does not lead to bacterial overgrowth in the infected stomachs but instead alters the diversity of bacteria present.
The Gastric Immune Response Is Influenced by Gastric Bacterial Composition
Infection of C57BL/6 mice with H. felis is known to cause CD4+ T-cell–dependent gastric inflammation that is accompanied by significant expression of IL17 and IFNγ (McCracken et al. 2005; Roth et al. 1999; Shi et al. 2010; Smythies et al. 2000). Reductions in H. felis colonization levels in this model are also T-cell dependent, as B6.Rag-1–/– and B6.TCRγδ–/– mice cannot decrease levels of colonization (Eaton et al. 1999; Roth et al. 1999). However, a recent report has shown that administration of an adenovirus encoding IL17 actually increased the load of H. pylori in a mouse model (Shi et al. 2010). There also appears to be a role for the regulatory cytokine IL10 in control of colonization, as mice deficient in IL10 appear to more efficiently clear helicobacter infection (Velin et al. 2008). Therefore, RNA expression levels of these three cytokines were evaluated to determine any relationship between their expression and the colonization in the B6.ASF mice. In mock-infected animals, there were no significant differences in the gene expression of IL17, IFNγ, or IL10 (data not shown). As shown in Figure 5A, IL17 gene expression is significantly elevated 8 weeks after H. felis infection in both the B6.SPF and the B6.ASF models as compared to B6.SPF mock-infected controls. By 24 weeks after infection, the level of IL17 gene expression is lower than at 8 weeks after infection; however, it continues to be significantly elevated in the B6.SPF- but not in the B6.ASF-infected mice (Fig. 5A). Compared to mock-infected B6.SPF stomachs, all H. felis–infected B6.SPF and B6.ASF mice had significantly high and sustained levels of IFNγ gene expression (Fig. 5B). It has been reported that IFNγ is critical for bacterial clearance, but it is not known if it is sufficient (Sayi et al. 2009). Our data would argue that other factors, such as acquired gastric bacteria, are involved in H. felis clearance in the C57BL/6 model in addition to IFNγ. The levels of IL10 mRNA were significantly elevated only in the 8-week B6.SPF group when compared to the mock-infected B6.SPF mice (Fig. 5C). This indicates that IL10 is probably not playing a role in bacterial eradication in these two models of H. felis infection, which is consistent with data from infected B6.IL10–/– mice (Velin et al. 2008).
Figure 5.

H. felis infection of both B6.SPF and B6.ASF mice increases gastric gene expression of IL17 and IFNγ. Gastric mRNA expression of IL17 (A), IFNγ (B), and IL10 (C) were evaluated at 8 and 24 weeks after infection. Average fold change is shown in the graph, along with the upper and lower limits of the fold change in each group. Comparisons were made to the B6.SPF mock-infected mice (*) or to same strain 8-week H. felis–infected mice (#) using the Student t-test; significance was defined as p < 0.05.
The production of IFNγ and IL4 has been shown to affect the predominant IgG subclass present. T-cells producing IFNγ induce the synthesis of IgG2a/c, while IL4-producing cells increase the production of IgG1 (DeKruyff et al. 1993). The effect of IL17 on IgG subclass induction is not clear. Therefore, in order to further investigate the type of immune response induced by H. felis infection, we evaluated the antibody response in both mouse models. B6.SPF mice had a significant increase in serum IgG2c anti–H. felis, while the B6.ASF mice did not generate appreciable amounts of H. felis–specific IgG2c (Fig. 6A). The B6.ASF mice made significantly more H. felis– specific IgG1 (Fig. 6B). Interestingly, when plotted as a ratio of H. felis–specific IgG2c:IgG1, the B6.SPF group had a significantly higher ratio than the B6.ASF group (Fig. 6C). H. felis–specific serum and fecal IgA were measured in each group, and although there were no significant differences between the groups in H. felis–specific serum IgA (data not shown), there was a significant increase in the amount of fecal H. felis–specific IgA in 24-week infected B6.SPF mice (Fig. 6D).
Figure 6.

H. felis–infected B6.SPF mice produce higher levels of serum H. felis–specific IgG2c than similarly infected B6.ASF mice. At 24 weeks, the B6.SPF mice produced significantly more H. felis–specific serum IgG2c than the B6.ASF (A), while the opposite was observed for IgG1 (B). When calculated as a ratio, it is clearly seen that the B6.SPF mice produced a much more robust IgG2c response than the B6.ASF (C). The B6.SPF mice also produce an increased concentration of fecal H. felis–specific IgA (D). Comparisons to mock-infected animals (*) were made using the Student t-test; significance was defined as p < 0.05.
Mucin Alterations Only Seen after H. felis Infection of B6.SPF Mice
We have previously reported that alterations in gastric mucin expression occur as early as 4 weeks after initial H. felis infection (Schmitz et al. 2009). These alterations include an increase in the gene expression of both muc4 and muc5b and a decrease in the protein expression of muc5ac. Although we have shown that these changes are dependent on the presence of an adaptive immune response, the effects of commensal microbiota are unknown (Schmitz et al. 2009). To explore the role of gastric microbiota in these alterations in mucin expression, we first evaluated the levels of gene expression of four components of either normal gastric mucus or mucus found in H. felis–infected B6.SPF mice. Neither the mucins (muc4, muc5ac, and muc5b), nor the scaffolding protein trefoil factor 1 (tff1), showed any difference in expression in the B6.ASF stomach when compared to the B6.SPF mock stomach (data not shown). Additionally, there was no significant change in gene expression of either muc5ac or tff1 in any of the H. felis–infected mice (Fig. 7 B, D). However, both muc4 and muc5b were significantly elevated 8 weeks after H. felis infection of B6.SPF mice but not B6.ASF mice (Fig. 7 A, C). Intriguingly, the gene expression level of muc4 continued to remain elevated in the B6.SPF mouse 24 weeks postinfection, while the expression level of muc5b returned to baseline.
Figure 7.
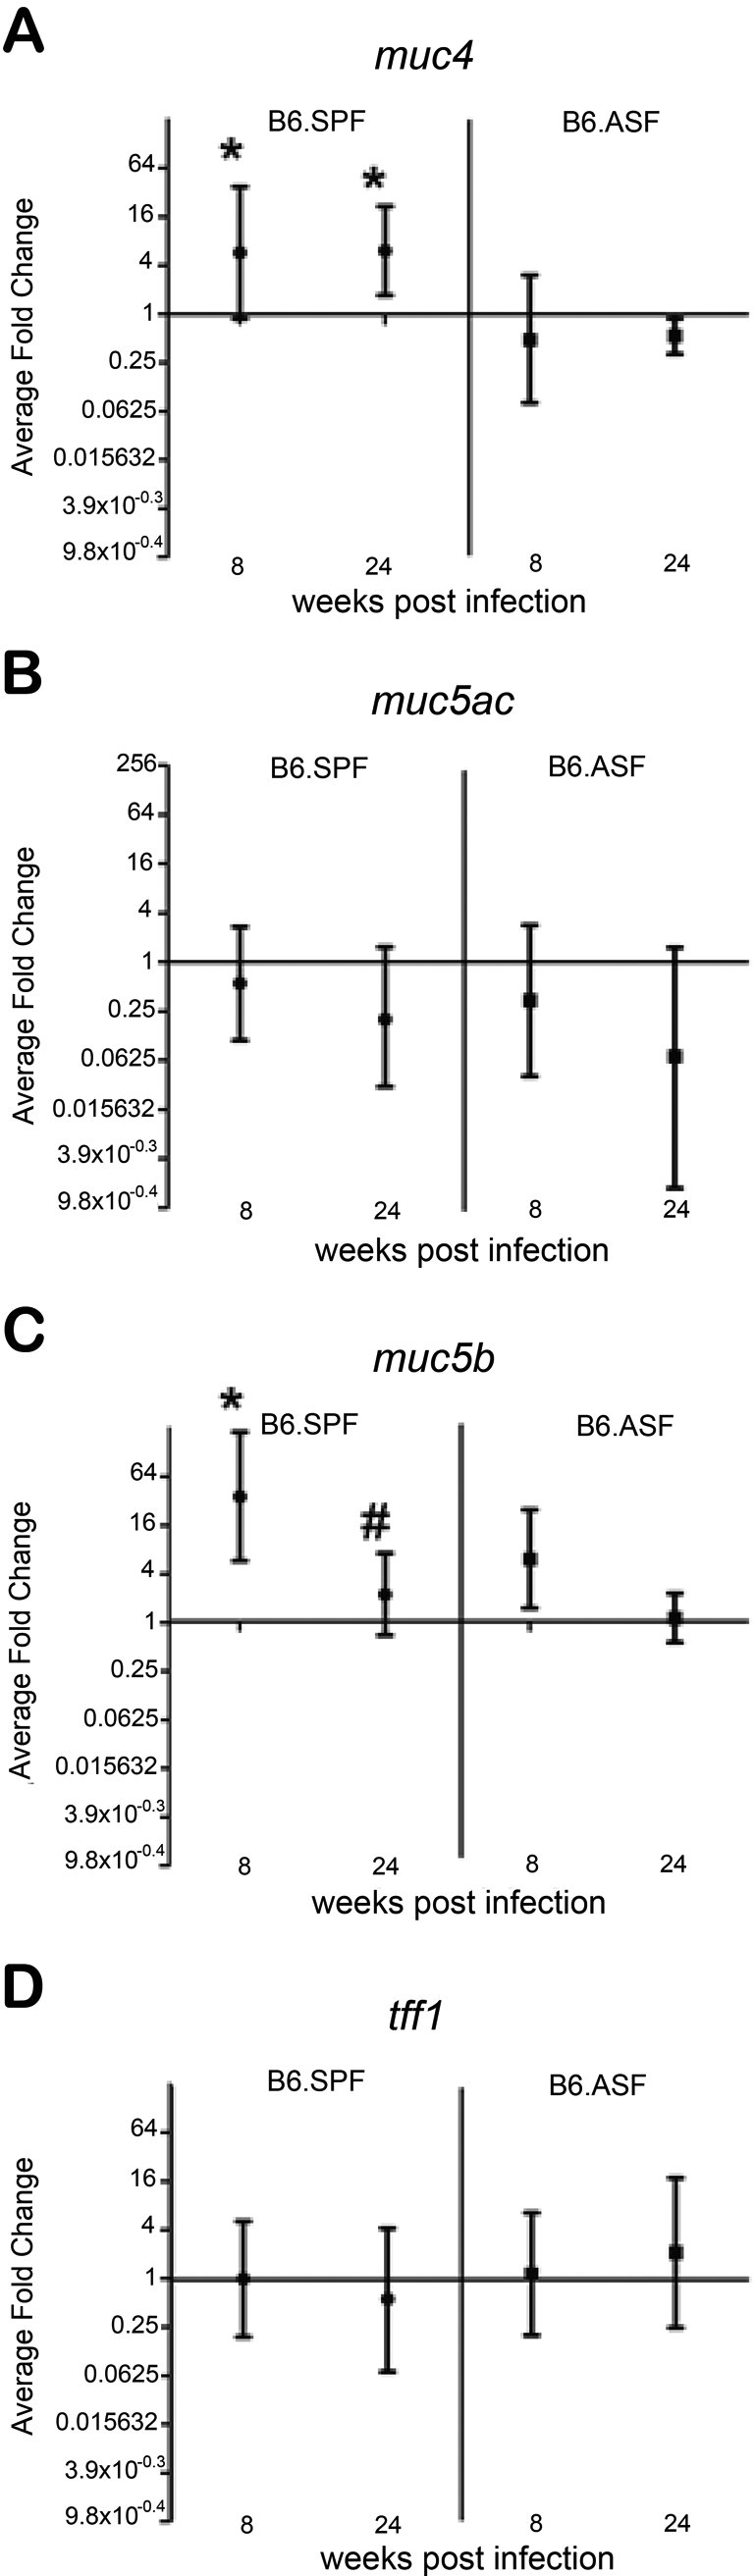
Gastric muc4 and muc5b gene expression is increased in H. felis–infected B6.SPF mice but unchanged in infected B6.ASF mice. Gastric mRNA expression of muc4 (A), muc5ac (B), muc5b (C), and tff1 (D). Average fold change is shown in the graph, along with the upper and lower limits of the fold change in each group. Significance was measured using the Student t-test. *Significance (p < 0.05) compared to B6.SPF mock infected at the same time period. #Significance (p < 0.05) compared to the B6.SPF H. felis–infected stomach at 8 weeks.
Discussion
The effects of commensal microorganisms on intestinal morphology have been well documented and include a decreased rate of epithelial cell turnover and alterations in villi and crypt length (McCracken and Lorenz 2001; O’Hara and Shanahan 2006; Smith et al. 2007; Thompson and Trexler 1971; Wostmann 1996). However, previous studies have not well characterized the baseline stomach architecture of gnotobiotic (B6.GB) and altered Schaedler flora (B6.ASF) colonized mice in comparison to conventionally reared animals (B6.SFP). Our results clearly show that the height of zymogenic glands in gnotobiotic mice is greatly shortened, despite the appropriate proportions of H/K-ATPase–expressing parietal cells and intrinsic factor/pepsinogen–expressing zymogenic cells. Correlating with this finding, the number of rapidly proliferating cells, as measured by BrdU incorporation, was dramatically decreased in the B6.GB mice. This decrease in the rapidly dividing stem/daughter cell population has been previously reported in the small intestine of gnotobiotic mice (Khoury et al. 1969). One hypothesis for this decrease in gland proliferation is the lack of signaling through pattern recognition receptors (such as toll-like receptors [TLR]), as there are fewer bacterial ligands found in this microenvironment. This is consistent with preliminary data from our laboratory, which indicates that mice lacking TLR2 or TLR4 also have shortened villi (Tatum et al. 2009). Accompanying this reduction in gland height is the apparent loss of the population of transitional cells known as prezymogenic cells. These cells normally express markers of both mucus neck cells (GSII) and zymogenic cells (pepsinogen). There is no co-localization of these two markers in the B6.GB stomach, indicating an apparent loss of this cell type (Karam and Leblond 1995; Karam 1995). This intriguing finding appears to be the first report of an effect of commensal microbiota on gastric glandular differentiation. One mechanism for the potential alteration of gastric epithelial differentiation could be microbe-induced epigenetic alterations in the gastric epithelial cell (Minarovits 2009).
Particularly of note, compared to B6.SPF stomachs, muc4, muc5ac, muc5b, and tff1 were expressed at similar levels in the B6.ASF stomachs. These mucins and trefoil factor have been shown to be critical in the formation of the gastric mucus layer, in the initial colonization of helicobacter, and are altered during the course of the disease (Correa 1988; Kaneko et al. 2003; Linden et al. 2004; Linden et al. 2008; Schmitz et al. 2009). These normal levels of expression indicated that H. felis should be able to colonize effectively, and the results showed that both mouse groups progressed to atrophy and dysplasia. There did appear to be a slight decrease in inflammation over the 24-week postinfection in the B6.ASF mice; however, this change was not significant. Intriguingly, the B6.ASF mice, which are housed in the gnotobiotic facility and are unable to acquire additional bacteria due to their sterile housing conditions, did not decrease the H. felis colonization levels as effectively as the B6.SPF mice.
Our studies have revealed several potential mechanisms for this difference in colonization. First, our laboratory has shown that over the course of H. felis infection in B6.SPF mice, the mucin barrier is altered, which could either allow newly acquired bacteria to come into closer contact with the epithelial cell layer or may create a new niche for these additional bacteria (Schmitz et al. 2009). Our study clearly demonstrates that the B6.SPF mice acquire additional gastric bacteria from their environment only after H. felis infection. As mice are coprophagic, these additional gastric bacteria could originate from the mouse’s own fecal microbiota. The acquisition of additional gastric bacteria is consistent with the recent observation that H. pylori–infected Mongolian gerbils also acquire new gastric microbiota, including Lactobacillus spp., after colonization and that humans infected with H. pylori have marked differences in the structure of their gastric microbial community (Maldonado-Contreras et al. 2011; Zaman et al. 2010).
The newly acquired gastric bacteria in our study were identified by sequencing as multiple Lactobacillus spp., including L. murinus and L. acidophilis. Many Lactobacillus spp. are used as probiotics, and it has been shown that probiotics can both prevent H. pylori infection and improve helicobacter eradication rates in humans, although the mechanism for this observation is unknown (Boonyaritichaikij et al. 2009; Franceschi et al. 2007; Gotteland et al. 2006; Sachdeva and Nagpal 2009). This improvement in eradication rate after Lactobacillus spp. colonization has also been seen in a BALB/c mouse model of H. pylori infection (Cui et al. 2010). One potential mechanism through which Lactobacillus reduces colonization by H. felis is competition for the gastric niche; the presence of lactobacilli (L. murinus) in the B6.ASF mouse stomach prior to infection may help to explain the wide variation of H. felis colonization seen in this model (Sarma-Rupavtarm et al. 2004). In support of this mechanism, it has been reported that a L. casei strain, when present in the stomachs of C57BL/6 mice, can cause a significant alteration in the levels of H. pylori colonization (Sgouras et al. 2004). In addition, L. johnsonii has also been shown to attenuate H. pylori–induced gastritis, if present during the early stages of infection (Sgouras et al. 2005). This again implicates the commensal microbial content at the time of infection in the determination of eventual disease outcomes.
Several studies done in gnotobiotic (ASF) mice have demonstrated that intestinal helicobacter infection (H. bilis) causes the host to initiate an inappropriate immune response against commensal microbiota and that this response can contribute to intestinal inflammation (Jergens et al. 2006; Jergens et al. 2007). Our results argue that a similar scenario is occurring after H. felis infection of B6.SPF mice, where we believe that the newly acquired gastric bacteria are providing the continued stimulation of the gastric immune response that was initially triggered by the H. felis infection.
In multiple helicobacter infection models, including the B6.SPF H. felis model used in this study, we and others have shown that the H. felis organism can be cleared to below the level of detection and that this clearance is critically dependent on the presence of CD4+ T-cells (Roth et al. 1999). Without this robust immune response, the helicobacter infection never resolves, and there appears to be an inverse correlation between the histological scores and colonization levels (Eaton et al. 1999; Velin et al. 2008; Velin et al. 2009). Recently, it has been suggested that H. pylori–induced IL17 may serve to increase the H. pylori load in the stomach (Shi et al. 2010). Although in our B6.SPF model, the high levels of IL17 gene expression do not correlate with high bacterial loads, they do correlate with the level of IgG2c antibody production and the high anti–H. felis– specific IgG2c:IgG1 ratio. This increase in the levels of IgG2c never occurs in the B6.ASF mice, which also do not maintain high levels of IL17 gene expression after infection. These findings are consistent with the recent conclusion that IL17 plays a role in antibody production and immunoglobulin class-switch in response to infection with Borrelia burgdorferi (Blaho et al. 2009). It should be noted that we believe that this dramatic difference in antibody production does not explain the alterations in eradication of the H. felis, as our laboratory, as well as others, have demonstrated that the presence of B-cells/antibody do not alter the development of gastritis or clearance of the organism (Ermak et al. 1998; Roth et al. 1999).
This inability to eradicate the H. felis gastric infection in B6.ASF mice and the increased IgG2c:IgG1 ratio is similar to the finding reported after H. pylori SS1 infection of B6.myd88–/– mice (Rad et al. 2007). Our findings lead to a hypothesis that the increased diversity in gastric microbiota in the B6.SPF H. felis model may lead to altered stimulation of pattern recognition receptors. TLR9 signaling in B-cells has been proposed to be involved in this class-switch recombination to IgG2c (Jegerlehner et al. 2007). Further studies will be necessary to determine if altered TLR9 stimulation is involved in the lack of class-switch in the B6.ASF mice.
As we have previously reported, B6.SPF have significant alterations in the expression of gastric mucins muc5ac, muc4, and muc5b after H. felis infection (Schmitz et al. 2009). However, in B6.SPF mice, total gastric RNA (from the forestomach, zymogenic zone, mucoparietal zone, and pure mucous zone [or antrum]) expression of muc5ac does not directly correlate to protein expression in specific zones. In the zymogenic zone of the stomach, protein expression as evaluated by immunohistochemical detection is diminished by H. felis infection, while protein expression in the antral portion of the stomach is unaltered. We confirmed that this observation was also true of H. felis–infected B6.ASF stomachs by immunofluorescence staining, as gastric glands had decreased zymogenic zone but unaltered antral zone protein expression of muc5ac after infection (data not shown). However, we were much more interested in the expression of muc4 and muc5b after infection, as our previous experiments have demonstrated that the alteration in gastric expression of these two mucins after H. felis infection only occurs if the adaptive immune response is intact (Schmitz et al. 2009). Intriguingly, 8 weeks after infection, the expression of muc4 and muc5b is only increased in the B6.SPF model. This gene expression was confirmed by immunohistochemical analysis for muc4, which only showed detectible protein expression in H. felis–infected B6.SPF (data not shown) (Schmitz et al. 2009). Muc4 is known to encode a membrane-bound mucin that is overexpressed in many adenocarcinomas (Jonckheere and Van Seuningen 2010; Senapati et al. 2008). Muc4 overexpression can increase tumorgenicity of transplanted gastric AGS cells and phosphorylated ErbB2 (Senapati et al. 2008). Due to this role in the progression to gastric carcinogenesis, it will be interesting to determine if the gastric atrophy and dysplasia in B6.ASF mice do not actually progress to carcinoma because muc4 is not overexpressed during H. felis infection in this model. It is unclear how the H. felis infection induces this increase in muc4/5b. It has been shown that levels of muc4 can be increased by IL6, but this is probably not the mechanism in our model, as there is no significant increase in gastric IL6 gene expression in the H. felis–infected B6.SPF model (data not shown).
This study indicates that commensal microbiota have complex influences on disease progression. In our model of H. felis infection, the presence of additional nonhelicobacter gastric bacteria did not alter the histological changes associated with infection over the 24-week observation period but did have a major influence on the persistence of the infection, the type of immune response induced, and the expression of gastric muc4 and muc5b. The observation that gastric inflammation and pathological disease continue in the B6.SPF stomach even after apparent H. felis eradication supports the hypothesis that helicobacter infection initiates an epithelial and immune response, which subsequently alters the gastric milieu in such a way that other microbiota can live in this new niche and sustain the gastric inflammatory response. This novel finding sets the stage for further investigations of the influence of polymicrobial colonization after helicobacter infection and the ability to clinically manipulate this in humans by probiotic or prebiotic treatments.
Acknowledgments
The authors thank Peggy R. McKie-Bell, Jamie L. McNaught, and Charyl Roy for their technical assistance and members of the Lorenz Lab for valuable advice.
Footnotes
The author(s) declared no potential conflicts of interest with respect to the authorship and publication of this article.
This study was supported in part by NIH grants R01 DK059911, P01 DK071176, and T32A07041; American Asthma Foundation grant 06-0167; and University of Alabama at Birmingham Digestive Diseases Research Development Center grant #P30 DK064400. CGD and SMT are recipients of the UAB-Hughes Med into Grad Fellowship. Aspects of this project were conducted in biomedical research space that was constructed with funds supported in part by NIH grant C06RR020136.
References
- Aebischer T, Fischer A, Walduck A, Schlotelburg C, Lindig M, Schreiber S, Meyer TF, Bereswill S, Gobel UB. 2006. Vaccination prevents Helicobacter pylori-induced alterations of the gastric flora in mice. FEMS Immunol Med Microbiol. 46:221–229 [DOI] [PubMed] [Google Scholar]
- Bas A, Forsberg G, Hammarstrom S, Hammarstrom ML. 2004. Utility of the housekeeping genes 18S rRNA, beta-actin and glyceraldehyde-3-phosphate-dehydrogenase for normalization in real-time quantitative reverse transcriptase-polymerase chain reaction analysis of gene expression in human T lymphocytes. Scand J Immunol. 59:566–573 [DOI] [PubMed] [Google Scholar]
- Berg RD. 1996. The indigenous gastrointestinal microflora. Trends Microbiol. 4:430–435 [DOI] [PubMed] [Google Scholar]
- Blaho VA, Buczynski MW, Dennis EA, Brown CR. 2009. Cyclooxygenase-1 orchestrates germinal center formation and antibody class-switch via regulation of IL-17. J Immunol. 183:5644–5653 [DOI] [PMC free article] [PubMed] [Google Scholar]
- Boonyaritichaikij S, Kuwabara K, Nagano J, Kobayashi K, Koga Y. 2009. Long-term administration of probiotics to asymptomatic pre-school children for either the eradication or the prevention of Helicobacter pylori infection. Helicobacter. 14:202–207 [DOI] [PubMed] [Google Scholar]
- Brown JK, Pemberton AD, Wright SH, Miller HR. 2004. Primary antibody-Fab fragment complexes: a flexible alternative to traditional direct and indirect immunolabeling techniques. J Histochem Cytochem. 52:1219–1230 [DOI] [PubMed] [Google Scholar]
- Correa P. 1988. A human model of gastric carcinogenesis. Cancer Res. 48:3554–3560 [PubMed] [Google Scholar]
- Correa P, Piazuelo MB. 2008. Natural history of Helicobacter pylori infection. Dig Liver Dis. 40:490–496 [DOI] [PMC free article] [PubMed] [Google Scholar]
- Cover TL, Blaser MJ. 2009. Helicobacter pylori in health and disease. Gastroenterology. 136:1863–1873 [DOI] [PMC free article] [PubMed] [Google Scholar]
- Cui Y, Wang CL, Liu XW, Wang XH, Chen LL, Zhao X, Fu N, Lu FG. 2010. Two stomach-originated Lactobacillus strains improve Helicobacter pylori infected murine gastritis. World J Gastroenterol. 16:445–452 [DOI] [PMC free article] [PubMed] [Google Scholar]
- De Bock M, Decostere A, Van den Bulck K, Baele M, Duchateau L, Haesebrouck F, Ducatelle R. 2005. The inflammatory response in the mouse stomach to Helicobacter bizzozeronii, Helicobacter salomonis and two Helicobacter felis Strains. J Comp Pathol. 133:83–91 [DOI] [PubMed] [Google Scholar]
- DeKruyff RH, Rizzo LV, Umetsu DT. 1993. Induction of immunoglobulin synthesis by CD4+ T cell clones. Semin Immunol. 5:421–430 [DOI] [PubMed] [Google Scholar]
- Dewhirst F, Chien C, Paster B, Ericson R, Orcutt R, Schauer D, Fox J. 1999. Phylogeny of the defined murine microbiota: altered Schaedler flora. Appl Environ Microbiol. 65:3287–3292 [DOI] [PMC free article] [PubMed] [Google Scholar]
- Dicksved J, Lindberg M, Rosenquist M, Enroth H, Jansson JK, Engstrand L. 2009. Molecular characterization of the stomach microbiota in patients with gastric cancer and in controls. J Med Microbiol. 58:509–516 [DOI] [PubMed] [Google Scholar]
- Eaton KA, Ringler SR, Danon SJ. 1999. Murine splenocytes induce severe gastritis and delayed-type hypersensitivity and suppress bacterial colonization in Helicobacter pylori-infected SCID mice. Infect Immun. 67:4594–4602 [DOI] [PMC free article] [PubMed] [Google Scholar]
- El-Zimaity H. 2008. Gastritis and gastric atrophy. Curr Opin Gastroenterol. 24:682–686 [DOI] [PubMed] [Google Scholar]
- Ermak TH, Giannasca PJ, Nichols R, Myers GA, Nedrud J, Weltzin R, Lee CK, Kleanthous H, Monath TP. 1998. Immunization of mice with urease vaccine affords protection against Helicobacter pylori infection in the absence of antibodies and is mediated by MHC class II-restricted responses. J Exp Med. 188:2277–2288 [DOI] [PMC free article] [PubMed] [Google Scholar]
- Fox JG, Lee A, Otto G, Taylor NS, Murphy JC. 1991. Helicobacter felis gastritis in gnotobiotic rats: an animal model of Helicobacter pylori gastritis. Infect Immun. 59:785–791 [DOI] [PMC free article] [PubMed] [Google Scholar]
- Franceschi F, Cazzato A, Nista EC, Scarpellini E, Roccarina D, Gigante G, Gasbarrini G, Gasbarrini A. 2007. Role of probiotics in patients with Helicobacter pylori infection. Helicobacter. 12 Suppl 2:59–63 [DOI] [PubMed] [Google Scholar]
- Gotteland M, Brunser O, Cruchet S. 2006. Systematic review: are probiotics useful in controlling gastric colonization by Helicobacter pylori? Aliment Pharmacol Ther. 23:1077–1086 [DOI] [PubMed] [Google Scholar]
- Hartman AL, Lough DM, Barupal DK, Fiehn O, Fishbein T, Zasloff M, Eisen JA. 2009. Human gut microbiome adopts an alternative state following small bowel transplantation. Proc Natl Acad Sci U S A. 106:17187–17192 [DOI] [PMC free article] [PubMed] [Google Scholar]
- Herrera V, Parsonnet J. 2009. Helicobacter pylori and gastric adenocarcinoma. Clin Microbiol Infect. 15:971–976 [DOI] [PubMed] [Google Scholar]
- Houben GM, Stockbrugger RW. 1995. Bacteria in the aetio- pathogenesis of gastric cancer: a review. Scand J Gastroenterol Suppl. 212:13–18 [DOI] [PubMed] [Google Scholar]
- Jegerlehner A, Maurer P, Bessa J, Hinton HJ, Kopf M, Bachmann MF. 2007. TLR9 signaling in B cells determines class switch recombination to IgG2a. J Immunol. 178:2415–2420 [DOI] [PubMed] [Google Scholar]
- Jergens AE, Dorn A, Wilson J, Dingbaum K, Henderson A, Liu Z, Hostetter J, Evans RB, Wannemuehler MJ. 2006. Induction of differential immune reactivity to members of the flora of gnotobiotic mice following colonization with Helicobacter bilis or Brachyspira hyodysenteriae. Microbes Infect. 8:1602–1610 [DOI] [PubMed] [Google Scholar]
- Jergens AE, Wilson-Welder JH, Dorn A, Henderson A, Liu Z, Evans RB, Hostetter J, Wannemuehler MJ. 2007. Helicobacter bilis triggers persistent immune reactivity to antigens derived from the commensal bacteria in gnotobiotic C3H/HeN mice. Gut. 56:934–940 [DOI] [PMC free article] [PubMed] [Google Scholar]
- Johnson MJ, Thatcher E, Cox ME. 1995. Techniques for controlling variability in gram staining of obligate anaerobes. J Clin Microbiol. 33:755–758 [DOI] [PMC free article] [PubMed] [Google Scholar]
- Jonckheere N, Van Seuningen I. 2010. The membrane-bound mucins: from cell signalling to transcriptional regulation and expression in epithelial cancers. Biochimie. 92:1–11 [DOI] [PubMed] [Google Scholar]
- Kaneko Y, Yanagihara K, Miyazaki Y, Hirakata Y, Mukae H, Tomono K, Okada Y, Kadota J, Kohno S. 2003. Overproduction of MUC5AC core protein in patients with diffuse panbronchiolitis. Respiration. 70:475–478 [DOI] [PubMed] [Google Scholar]
- Karam S, Leblond CP. 1995. Origin and migratory pathways of the eleven epithelial cell types present in the body of the mouse stomach. Microsc Res Tech. 31:193–214 [DOI] [PubMed] [Google Scholar]
- Karam SM. 1995. New insights into the stem cells and the precursors of the gastric epithelium. Nutrition. 11:607–613 [PubMed] [Google Scholar]
- Khoury KA, Floch MH, Hersh T. 1969. Small intestinal mucosal cell proliferation and bacterial flora in the conventionalization of the germfree mouse. J Exp Med. 130:659–670 [DOI] [PMC free article] [PubMed] [Google Scholar]
- Linden S, Boren T, Dubois A, Carlstedt I. 2004. Rhesus monkey gastric mucins: oligomeric structure, glycoforms and Helicobacter pylori binding. Biochem J. 379:765–775 [DOI] [PMC free article] [PubMed] [Google Scholar]
- Linden SK, Wickstrom C, Lindell G, Gilshenan K, Carlstedt I. 2008. Four modes of adhesion are used during Helicobacter pylori binding to human mucins in the oral and gastric niches. Helicobacter. 13:81–93 [DOI] [PubMed] [Google Scholar]
- Lorenz R, Gordon J. 1993. Use of transgenic mice to study regulation of gene expression in the parietal cell lineage of gastric units. J Biol Chem. 268:26559–26570 [PubMed] [Google Scholar]
- Maldonado-Contreras A, Goldfarb KC, Godoy-Vitorino F, Karaoz U, Contreras M, Blaser MJ, Brodie EL, Dominguez-Bello MG. 2011. Structure of the human gastric bacterial community in relation to Helicobacter pylori status. ISME J. 5:574–579 [DOI] [PMC free article] [PubMed] [Google Scholar]
- McCracken V, Lorenz R. 2001. The gastrointestinal ecosystem: a precarious alliance among epithelium, immunity and microbiota. Cell Microbiol. 3:1–11 [DOI] [PubMed] [Google Scholar]
- McCracken VJ, Martin SM, Lorenz RG. 2005. The Helicobacter felis model of adoptive transfer gastritis. Immunol Res. 33:183–194 [DOI] [PubMed] [Google Scholar]
- Minarovits J. 2009. Microbe-induced epigenetic alterations in host cells: the coming era of patho-epigenetics of microbial infections. A review. Acta Microbiol Immunol Hung. 56:1–19 [DOI] [PubMed] [Google Scholar]
- Mohammadi M, Redline R, Nedrud J, Czinn S. 1996. Role of the host in pathogenesis of Helicobacter-associated gastritis: H. felis infection of inbred and congenic mouse strains. Infect Immun. 64:238–245 [DOI] [PMC free article] [PubMed] [Google Scholar]
- Muyzer G, de Waal E, Uitterlinden A. 1993. Profiling of complex microbial populations by denaturing gradient gel electrophoresis analysis of polymerase chain reaction-amplified genes coding for 16S rRNA. Appl Environ Microbiol. 59:695–700 [DOI] [PMC free article] [PubMed] [Google Scholar]
- O’Hara AM, Shanahan F. 2006. The gut flora as a forgotten organ. EMBO Rep. 7:688–693 [DOI] [PMC free article] [PubMed] [Google Scholar]
- Rad R, Brenner L, Krug A, Voland P, Mages J, Lang R, Schwendy S, Reindl W, Dossumbekova A, Ballhorn W, et al. 2007. Toll-like receptor-dependent activation of antigen-presenting cells affects adaptive immunity to Helicobacter pylori. Gastroenterology. 133:150–163 [DOI] [PubMed] [Google Scholar]
- Rathinavelu S, Zavros Y, Merchant JL. 2003. Acinetobacter lwoffii infection and gastritis. Microbes Infect. 5:651–657 [DOI] [PubMed] [Google Scholar]
- Ropenga A, Chapel A, Vandamme M, Griffiths NM. 2004. Use of reference gene expression in rat distal colon after radiation exposure: a caveat. Radiat Res. 161:597–602 [DOI] [PubMed] [Google Scholar]
- Roth K, Kapadia S, Martin S, Lorenz R. 1999. Cellular immune responses are essential for the development of Helicobacter felis-associated gastric pathology. J Immunol. 163:1490–1497 [PubMed] [Google Scholar]
- Rubie C, Kempf K, Hans J, Su T, Tilton B, Georg T, Brittner B, Ludwig B, Schilling M. 2005. Housekeeping gene variability in normal and cancerous colorectal, pancreatic, esophageal, gastric and hepatic tissues. Mol Cell Probes. 19:101–109 [DOI] [PubMed] [Google Scholar]
- Sachdeva A, Nagpal J. 2009. Effect of fermented milk-based probiotic preparations on Helicobacter pylori eradication: a systematic review and meta-analysis of randomized- controlled trials. Eur J Gastroenterol Hepatol. 21:45–53 [DOI] [PubMed] [Google Scholar]
- Sarma-Rupavtarm R, Ge Z, Schauer D, Fox J, Polz M. 2004. Spatial distribution and stability of the eight microbial species of the altered Schaedler flora in the mouse gastrointestinal tract. Appl Environ Microbiol. 70:2791–2800 [DOI] [PMC free article] [PubMed] [Google Scholar]
- Sayi A, Kohler E, Hitzler I, Arnold I, Schwendener R, Rehrauer H, Muller A. 2009. The CD4+ T cell-mediated IFN-gamma response to Helicobacter infection is essential for clearance and determines gastric cancer risk. J Immunol. 182:7085–7101 [DOI] [PubMed] [Google Scholar]
- Schaedler RW, Dubs R, Costello R. 1965. Association of germfree mice with bacteria isolated from normal mice. J Exp Med. 122:77–82 [DOI] [PMC free article] [PubMed] [Google Scholar]
- Schmitz JM, Durham CG, Ho SB, Lorenz RG. 2009. Gastric mucus alterations associated with murine Helicobacter infection. J Histochem Cytochem. 57:457–467 [DOI] [PMC free article] [PubMed] [Google Scholar]
- Senapati S, Chaturvedi P, Sharma P, Venkatraman G, Meza JL, El-Rifai W, Roy HK, Batra SK. 2008. Deregulation of MUC4 in gastric adenocarcinoma: potential pathobiological implication in poorly differentiated non-signet ring cell type gastric cancer. Br J Cancer. 99:949–956 [DOI] [PMC free article] [PubMed] [Google Scholar]
- Sgouras D, Maragkoudakis P, Petraki K, Martinez-Gonzalez B, Eriotou E, Michopoulos S, Kalantzopoulos G, Tsakalidou E, Mentis A. 2004. In vitro and in vivo inhibition of Helicobacter pylori by Lactobacillus casei strain Shirota. Appl Environ Microbiol. 70:518–526 [DOI] [PMC free article] [PubMed] [Google Scholar]
- Sgouras DN, Panayotopoulou EG, Martinez-Gonzalez B, Petraki K, Michopoulos S, Mentis A. 2005. Lactobacillus johnsonii La1 attenuates Helicobacter pylori-associated gastritis and reduces levels of proinflammatory chemokines in C57BL/6 mice. Clin Diagn Lab Immunol. 12:1378–1386 [DOI] [PMC free article] [PubMed] [Google Scholar]
- Shi Y, Liu XF, Zhuang Y, Zhang JY, Liu T, Yin Z, Wu C, Mao XH, Jia KR, Wang FJ, et al. 2010. Helicobacter pylori-induced Th17 responses modulate Th1 cell responses, benefit bacterial growth, and contribute to pathology in mice. J Immunol. 184:5121–5129 [DOI] [PubMed] [Google Scholar]
- Smith K, McCoy KD, Macpherson AJ. 2007. Use of axenic animals in studying the adaptation of mammals to their commensal intestinal microbiota. Semin Immunol. 19:59–69 [DOI] [PubMed] [Google Scholar]
- Smythies LE, Waites KB, Lindsey JR, Harris PR, Ghiara P, Smith PD. 2000. Helicobacter pylori-induced mucosal inflammation is Th1 mediated and exacerbated in IL-4, but not IFN-gamma, gene-deficient mice. J Immunol. 165:1022–1029 [DOI] [PubMed] [Google Scholar]
- Tan MP, Kaparakis M, Galic M, Pedersen J, Pearse M, Wijburg OL, Janssen PH, Strugnell RA. 2007. Chronic Helicobacter pylori infection does not significantly alter the microbiota of the murine stomach. Appl Environ Microbiol. 73:1010–1013 [DOI] [PMC free article] [PubMed] [Google Scholar]
- Tatum P, Staley E, Tanner SM, Lorenz RG. 2009. The role of TLR2 and TLR4 in postnatal intestinal development. Mucosal Immunol. 2(supplement 1);doi: 10.1038/mi.2009.64 [DOI] [Google Scholar]
- Thompson GR, Trexler PC. 1971. Gastrointestinal structure and function in germ-free or gnotobiotic animals. Gut. 12:230–235 [DOI] [PMC free article] [PubMed] [Google Scholar]
- Velin D, Bachmann D, Bouzourene H, Michetti P. 2008. Reduction of Helicobacter infection in IL-10-/- mice is dependent on CD4+ T cells but not on mast cells. Helicobacter. 13:361–369 [DOI] [PubMed] [Google Scholar]
- Velin D, Favre L, Bernasconi E, Bachmann D, Pythoud C, Saiji E, Bouzourene H, Michetti P. 2009. Interleukin-17 is a critical mediator of vaccine-induced reduction of Helicobacter infection in the mouse model. Gastroenterology. 136:2237–2246 [DOI] [PubMed] [Google Scholar]
- Wostmann BS. 1996. Germfree and Gnotobiotic Animal Models: Background and Applications. Boca Raton: CRC Press [Google Scholar]
- Yamaguchi H, Osaki T, Taguchi H, Sato N, Toyoda A, Takahashi M, Kai M, Nakata N, Komatsu A, Atomi Y, Kamiya S. 2003. Effect of bacterial flora on postimmunization gastritis following oral vaccination of mice with Helicobacter pylori heat shock protein 60. Clin Diagn Lab Immunol. 10:808–812 [DOI] [PMC free article] [PubMed] [Google Scholar]
- Zaidi AU, D’Sa-Eipper C, Brenner J, Kuida K, Zheng TS, Flavell RA, Rakic P, Roth KA. 2001. Bcl-X(L)-caspase-9 interactions in the developing nervous system: evidence for multiple death pathways. J Neurosci. 21:169–175 [DOI] [PMC free article] [PubMed] [Google Scholar]
- Zaman C, Osaki T, Hanawa T, Yonezawa H, Kurata S, Kamiya S. 2010. Analysis of the microflora in the stomach of Mongolian gerbils infected with Helicobacter pylori. J Gastroenterol Hepatol. 25 Suppl 1:S11–S14 [DOI] [PubMed] [Google Scholar]
- Zavros Y, Rieder G, Ferguson A, Merchant JL. 2002. Gastritis and hypergastrinemia due to Acinetobacter lwoffii in mice. Infect Immun. 70:2630–2639 [DOI] [PMC free article] [PubMed] [Google Scholar]