

Abstract
Multiple neurofibromas are cardinal features of neurofibromatosis 1 (NF1). Several different types of NF1-associated neurofibromas occur, each distinct in terms of pathological details, clinical presentation, and natural history. Mast cells are present in most neurofibromas and have been shown to be critical to the origin and progression of neurofibromas in both human NF1 and relevant mouse models. In this investigation, the authors determined whether mast cell involvement is the same for all types of NF1-associated neurofibromas. They examined the density and distribution of mast cells within 49 NF1-associated neurofibromas classified histopathologically as diffuse or encapsulated on the basis of the presence or absence of the perineurium or its constituent cells. They made two observations: (1) Diffuse neurofibromas had significantly higher densities of mast cells than did encapsulated neurofibromas, and (2) mast cells were evenly distributed throughout diffuse neurofibromas but were primarily restricted to the periphery of encapsulated neurofibromas. The differences in mast cell density and distribution differentiate the two basic types of NF1-associated neurofibromas, suggesting that the pathogenesis of diffuse and encapsulated neurofibromas may be significantly different.
Keywords: NF1, neurofibromas, image analysis, immunohistochemistry, mast cells, neurons, paraffin material
Neurofibromatosis 1 (NF1) is an autosomal dominant disorder with an incidence of 1:3500 (Friedman 1999). Neurofibromas, the disorder’s hallmark benign tumors, contain a mixture of cells, including Schwann cells, fibroblasts, endothelial cells, lymphocytes, and mast cells. In some neurofibromas, perineurial cells, adipocytes, and/or glandular cells may also be present (Friedman and Riccardi 1999). Large amounts of intercellular collagen and ground substance are typical of all neurofibromas, with substantial variation from one portion of a neurofibroma to another.
Mast cells are formed in the bone marrow and are released into the blood, undergoing final differentiation when they leave the vasculature and are incorporated into their target tissues. Mature mast cells are normally found in the endoneurial, perineurial, and epineurial spaces of peripheral nerves (Bienenstock et al. 1991). Mast cells accumulate more intensely when the nerve is damaged and/or is in the process of repair (Bienenstock et al. 1987). Mast cell infiltration of neurofibromas from individuals with or without NF1 has been appreciated for many years (Isaacson 1976; Riccardi 1981; Riccardi and Wald 1987; Johnson et al. 1989).
Mast cells also play an important role in neurofibroma development in Nf1 mouse models (Zhu et al. 2002), although it is not clear whether the mast cell distribution is the same in the murine neurofibromas as in the human tumors. Mice with a homozygous knockout of Nf1 in all Schwann cells but an Nf1 heterozygous state in all other cells have enlarged peripheral nerves and may develop dorsal root neurofibromas that resemble encapsulated neurofibromas in NF1 patients (Zhu et al. 2002). Yang and coworkers (2008) have shown conclusively that Nf1+/− mast cells are required for the development of neurofibromas in mice whose peripheral nerve Schwann cells are null for Nf1 (Nf −/−).
Although all NF1-associated neurofibromas share characteristic histopathological features, individual tumors vary in age of presentation, anatomical location, appearance on physical examination, natural history, and malignant potential (Riccardi 1992). Several different classifications of neurofibromas have been proposed, relying to different degrees on the importance of anatomical location, symptomatology, natural history, and gross and microscopic pathological characterizations (Crowe et al. 1956; Harkin and Reed 1968; Korf and Rubenstein 2005; Masson 1970; Riccardi 1992; Wiesteler and Radner 1994; Woodruff 1999). In this context, we hypothesized that differences in mast cell densities and distributions might indicate differences in pathogenesis of the two histopathological types of NF1-associated neurofibromas distinguished by Masson (1970) on the basis of whether at least some portion of the perineurium encloses (encapsulates) the tumor.
Encapsulated neurofibromas, the perineurium of which “isolates them from the neighboring tissues”
Diffuse neurofibromas, “surrounded by diffuse infiltration having a fibrous appearance”
The present study was limited to neurofibromas from patients with NF1, each of whom has a presumed or documented constitutional mutation of one allele at the NF1 locus. We used histological staining and immunohistochemical techniques to quantify the presence and distribution of mast cells in NF1 neurofibromas classified histopathologically as diffuse or encapsulated. We show for the first time that the density and distribution of mast cells distinguish these two types of neurofibromas. Diffuse neurofibromas have a higher density and more uniform distribution of mast cells than encapsulated neurofibromas.
Materials and Methods
Sample Collection
We collected formalin-fixed paraffin-embedded samples from Creteil Hospital (Paris, France), The Neurofibromatosis Institute (La Crescenta, CA), Vancouver General Hospital (Vancouver, Canada), and Children’s and Women’s Hospital (Vancouver, Canada). All individuals had a confirmed clinical diagnosis of NF1 according to established criteria (National Institutes of Health 1988). The study protocol was approved by the University of British Columbia Research Ethics Committee.
Histopathological Classification of Neurofibromas
Forty-nine neurofibromas were classified on the basis of their histopathological appearance in hematoxylin and eosin (H&E)–stained sections as diffuse or encapsulated, according to the classification scheme of Masson (1970). Diffuse neurofibromas included neurofibromas infiltrating the skin and/or more deeply located tissues. They were characterized by the presence of Schwann cells and fibroblasts that were not limited by the perineurium and thus enveloped or infiltrated otherwise normal structures (exocrine glands, hair follicles, blood vessels, etc.). Schwann cells and fibroblasts were irregularly dispersed within a fibrous and/or myxoid background. Myelin fibrils were rare or absent.
In contrast, Schwann cells and fibroblasts in encapsulated neurofibromas were intraneural, enclosed within large hypertrophic nerves circumscribed by perineurium. Encapsulated neurofibromas included both single fascicle and multiple fascicle (plexiform) types. Dispersed or fascicular myelin fibrils were usually found in the central area of the nodules.
Chromatographic Identification of Granulated Mast Cells
Serial sections were cut from each tumor and deparaffinized. One section was stained with H&E, and a second section was stained for 30 sec with 0.1% toluidine blue, a metachromatic dye that identifies normal granulated mast cells (Wheater et al. 1993).
Immunohistochemical Identification of Mast Cells and Schwann Cells
c-Kit antibody immunohistochemistry identified all mast cells, whether or not they contained toluidine blue–positive granules. Serial sections were cut from nine neurofibromas (five diffuse and four encapsulated). One section of each tumor was stained with H&E (as a reference), one with toluidine blue (as above), and one for c-Kit. The final section was dual labeled for c-Kit and S100B protein, a Schwann cell marker.
For immunohistochemical staining, heat antigen retrieval was performed for 10 min at 70C in EDTA buffer (pH 6.0) after deparaffinization. c-Kit antibody (Zymed, South San Francisco, CA) or S100B protein antibody (Dako Cytomation, Mississauga, Canada) was diluted 1:400, and slides were incubated overnight at room temperature. ABC Elite and Nova Red (Vector Laboratories Canada, Inc., Burlington, Canada) were used to identify c-Kit-positive cells in sections stained solely for c-Kit. Two secondary antibodies (conjugated with Alexa 488 or Alexa 568 [Invitrogen Canada, Inc., Burlington, Canada]) identified cells positive for both c-Kit and S100B protein. Using a confocal microscope, we scanned five to eight fields with c-Kit-positive cells to look for dual-labeled cells in each tumor.
Neurofibroma Mast Cell Density and Distribution
Two investigators (M.S. and T.T.) independently counted the absolute number of mast cells in toluidine blue–stained sections in each of the 49 neurofibromas studied. The number of toluidine blue–positive mast cells in a portion of each neurofibroma was visually assessed at ×400 magnification and recorded. To compare mast cells to other tumor characteristics described below, the number of mast cells was also expressed and statistically analyzed on a semi-quantitative scale (0, 1–5, 6–10, and >10 per field). In addition, each specimen was scanned in its entirety to assess whether there was clustering of mast cells in certain regions or around particular landmarks.
Mast Cell Overall Cellularity, Vascularity, and Lymphocytic Infiltration
Each H&E section was also graded on a semi-quantitative scale in terms of three other variables. Five to eight fields representative of each tumor were assessed with respect to (1) cellularity at 200× magnification on a 3-point scale (<30%, 30–60%, or >60% of the field composed of nuclei, excluding lymphocytes); (2) vascularity at 200× magnification on a 3-point scale (<15%, 15–30%, or >30% of the field composed of small blood vessels), and (3) lymphocytic infiltration at 400× magnification on a 4-point scale (≤5%, 6–20%, 21–30%, or >30% of the total field composed of lymphocytic nuclei). Lymphocytes were identified by their characteristic small, densely packed nuclei.
Statistical Analysis
SPSS version 11.0 was used for all statistical calculations (SPSS, Inc., an IBM Company, Chicago, IL). Kendall’s correlation was calculated to determine the relationship between neurofibroma type, vascularity, cellularity, lymphocytic infiltration, and mast cell density. The Mann-Whitney U test was performed to determine if there was a significant difference in mast cell distribution between the two types of neurofibromas. The median test and Wilcoxon two-sample test were performed to determine if there was a significant difference in the proportion of mast cells as a fraction of the total cell number between the two types of neurofibromas. A p-value ≤0.05 was considered statistically significant.
Results
We studied the density and distribution of mast cells in 49 neurofibromas from 37 NF1 patients. Thirty-two of the neurofibromas (from 27 individuals) were classified histopathologically as diffuse neurofibromas. Fifteen of the neurofibromas (from 9 individuals) were classified as encapsulated neurofibromas. Two neurofibromas (from 2 individuals) containing a mix of diffuse and encapsulated components were excluded from the statistical analysis. Overall cellularity, vascularity, and lymphocytic infiltration of the neurofibromas were also considered. Figure 1 shows examples of diffuse and encapsulated neurofibromas with representative patterns of mast cell distribution, cellularity, vascularity, and lymphocytic infiltration.
Figure 1.

Images of typical diffuse and encapsulated neurofibromas. A diffuse neurofibroma (A) and encapsulated neurofibromas (C) stained with hematoxylin and eosin at 100× magnification. A section adjacent to (A and C) stained with toluidine blue at 100× magnification in diffuse neurofibromas (B) and encapsulated neurofibromas (D). Mast cells (*); blood vessels (arrow); lymphocytes (L).
Mast Cell Number and Distribution within Neurofibromas
There were two consistent differences between encapsulated and diffuse neurofibromas with regard to mast cell numbers and distribution. First, encapsulated neurofibromas had significantly fewer mast cells than diffuse neurofibromas (p = 0.021) (Figs. 1 and 2). Second, encapsulated neurofibromas were more likely to have mast cells located at the periphery, whereas mast cells were evenly distributed throughout diffuse neurofibromas (Fig. 3). There were no obvious mast cell clusters around particular structures in the tumors, except for clustering at the edges of encapsulated neurofibromas (Fig. 3). Areas of encapsulated neurofibroma seen within a “mixed” encapsulated and diffuse tumor contained very few mast cells, although the surrounding diffuse portion contained many mast cells (Fig. 3C,D).
Figure 2.

Quantification of histological differences distinguishing diffuse and encapsulated neurofibromas. Cellularity (A) and vascularity (B) estimated on a 3-point scale with 3 being the highest and lymphocytic infiltration (C) and mast cell density (D) estimated on a 4-point scale with 4 being the highest. Black boxes, diffuse neurofibromas; white boxes, encapsulated neurofibromas.
Figure 3.

Mast cell distributions within neurofibromas. An encapsulated neurofibroma (and its overlying epineurium or perineurium) stained with hematoxylin and eosin (A) and toluidine blue (B) at 200× magnification. A neurofibroma with both diffuse (d) and encapsulated components (e) stained with hematoxylin and eosin (C) and toluidine blue (D) at 50× magnification. Mast cells (*).
By toluidine blue staining, the average number of mast cells was 123/9000 µm2 (range, 5–911/9000 µm2) in encapsulated neurofibromas and 7390/9000 µm2 (range, 0–15,500/9000 µm2) in diffuse neurofibromas. To address whether this difference in mast cells density was associated with a higher overall cellularity in diffuse neurofibromas, we counted the number of mast cells and the number of other nuclei per field in multiple fields of each of seven encapsulated and nine diffuse neurofibromas. Mast cells accounted for 0.73 ± 0.97% (mean ± standard deviation) of 4186 total nuclei counted in the less cellular encapsulated neurofibromas and 4.67 ± 3.95% of 5062 total nuclei counted in the more cellular diffuse neurofibromas. The difference in these proportions is highly statistically significant (p < 0.0005, median test; p < 0.05, Wilcoxon two-sample test). Thus, at least some of the higher mast cell density of diffuse neurofibromas is accounted for by an overall higher cellularity in general. For both types of neurofibromas, mast cell density was positively correlated with overall tumor vascularity (Kendall’s τ = 0.513, p < 0.001) and negatively correlated with lymphocytic infiltration (Kendall’s τ = −0.317, p = 0.021). Neurofibroma mast cells did not cluster around blood vessels or within areas of lymphocytic infiltration.
Relationship of Granulated and Non-granulated Mast Cells
To ensure that the differences in mast cell density did not reflect only the indolent, not-yet-activated granulated mast cells stained with toluidine blue, we used c-Kit immunostaining to identify all mast cells—granulated and degranulated—in selected neurofibromas. Consistent with earlier work using either immunostaining (Giorno and Claman 1988) or electron microscopy (Giorno et al. 1989), we documented that the number of c-Kit-positive mast cells was higher than the number of toluidine blue–positive cells in each of the tumors studied, suggesting that the mast cells within neurofibromas have been activated.
There was a strong correlation between toluidine blue and c-Kit staining (Kendall’s τ = 0.894, p < 0.001). As expected from the toluidine blue results, the total number of c-Kit-positive cells was significantly lower in encapsulated neurofibromas than in diffuse neurofibromas (p = 0.014). There was no difference in the ratio of toluidine blue/c-Kit-positive mast cells in encapsulated and diffuse neurofibromas. Confocal imaging and dual immunolabeling with antibodies to c-Kit and S100B proteins in adjacent sections of nine neurofibromas showed no colocalization of these two proteins (Fig. 4).
Figure 4.
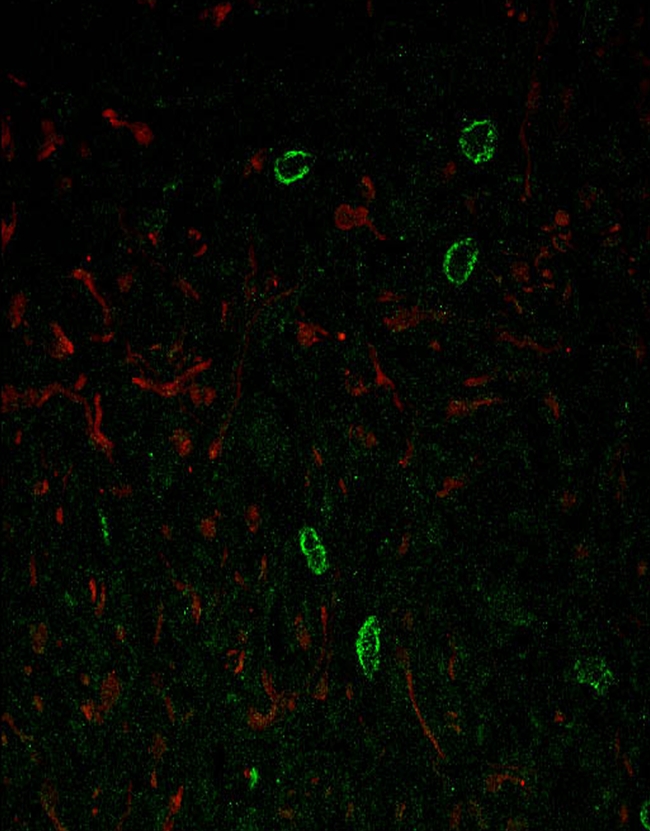
Confocal image of a diffuse neurofibroma stained to detect S100 protein and c-Kit at 400× magnification. S100 protein-positive Schwann cells stain red and c-Kit-positive mast cells stain green.
Cellularity
There was a significant correlation between cellularity and histopathological tumor type (Kendall’s τ = −0.384, p = 0.007). Diffuse neurofibromas had higher and more uniform cellularity, and encapsulated neurofibromas displayed more dense fibrotic tissue and areas of degeneration in the central portion of the neurofibroma, although not at the periphery.
Vascularity
Blood vessels within encapsulated neurofibromas were larger than those found in diffuse neurofibromas, which typically had many small vessels (Fig. 1). Blood vessels were evenly distributed throughout both diffuse and encapsulated neurofibromas. Overall, vascularity was not significantly correlated with tumor type (Kendall’s τ = −0.243, p = 0.085).
Lymphocytic Infiltration
The proportions of lymphocytes within encapsulated neurofibromas and diffuse neurofibromas were not significantly different (Kendall’s τ = 0.217, p = 0.142). Lymphocytes were generally distributed evenly within encapsulated neurofibromas (Fig. 1) but were more localized in diffuse neurofibromas.
Discussion
Mast cells are characteristic cellular components of neurofibromas, including those of patients with NF1. NF1-associated neurofibromas have been subclassified in several different ways on the basis of various clinical, radiological, or histopathological features (Crowe et al. 1956; Harkin and Reed 1968; Korf and Rubenstein 2005; Masson 1970; Riccardi 1992; Wiesteler and Radner 1994; Woodruff 1999). We used a classical histopathological scheme that differentiates neurofibromas into two broad categories—encapsulated and diffuse (Masson 1970)—to show for the first time that these two types of NF1-associated neurofibromas differ in the number and distribution of mast cells.
We observed a higher proportion of mast cells as a fraction of all cells in diffuse neurofibromas compared to encapsulated neurofibromas. Mast cells were found throughout diffuse neurofibromas but were restricted to the periphery of encapsulated neurofibromas. The observed peripheral restriction of mast cells in nodular neurofibromas could be due to limited migration of mast cells into the tumors or to mast cells that were present within the nerve before the tumor formed and were pushed to the periphery with tumor development. Other unknown factors might also be responsible.
Our findings are consistent with those of several NF1 mouse model studies. For example, using a Cre transgene under the control of the Schwann cell Krox20 promoter, Zhu and coworkers (2002) produced a homozygous knockout of Nf1 in Schwann cells while maintaining an Nf1 heterozygous state in all other cells, including mast cells. Neurofibromas developed only if cells other than Schwann cells were heterozygous for Nf1—not when the other cells were all wild type for Nf1. These authors thus demonstrated both that mast cells participate in Nf1 knockout mouse neurofibroma development and that the participating mast cells must be heterozygous for an Nf1 mutation. These conclusions were corroborated in 2008 by Yang and coworkers, who made mice with Nf1−/− Schwann cells but Nf1+/+ in all other cell types and then transfused the animals with Nf1 +/− bone marrow. These mice developed neurofibromas with extensive infiltration of the transfused marrow-derived mast cells. When these mice were crossed with mice carrying homozygous mutations in c-Kit, thereby inhibiting mast cell activation, there was no histological evidence of neurofibroma formation.
In studies, we found that neurofibromas with high cellularity also had a larger number of blood vessels. Lymphocytes were observed in some neurofibromas, although the proportion of lymphocytes varied substantially from one neurofibroma to another. Lymphocytic infiltration was not restricted to perivascular regions of neurofibromas or to areas of necrosis. Only one neurofibroma included in this study showed evidence of necrosis, and this area was infiltrated with lymphocytes.
Preliminary studies exploring the efficacy of treating NF1 patients with the oral mast cell blocker, ketotifen (Riccardi 1987, 1993), and the Nf1 conditional knockout mouse described above with imatinib mesylate, an inhibitor of c-Kit (Yang et al. 2008), are very encouraging. These studies emphasize the importance of mast cells in neurofibroma growth and suggest the possibility that mast cell inhibition might be useful in treating neurofibromas in people with NF1.
In summary, we have documented a difference in the density and distribution of mast cells between the two different types of neurofibromas associated with NF1. This difference is consistent with clinical observations that different kinds of neurofibromas have different natural histories, and these differences may have therapeutic implications.
Footnotes
The author(s) declared no potential conflicts of interest with respect to the authorship and/or publication of this article.
The author(s) received no financial support for the research and/or authorship of this article.
References
- Bienenstock J, MacQueen G, Sestini P, Marshall JS, Stead RH, Perdue MH. 1991. Mast cell/nerve interactions in vitro and in vivo. Am Rev Respir Dis. 143:S55–S58 [DOI] [PubMed] [Google Scholar]
- Bienenstock J, Tomioka M, Matsuda H, Stead RH, Quinonez G, Simon GT, Coughlin MD, Denburg JA. 1987. The role of mast cells in inflammatory processes: evidence for nerve/mast cell interactions. Int Arch Allergy Appl Immunol. 82:238–243 [DOI] [PubMed] [Google Scholar]
- Crowe F, Schull W, Neel J. 1956. Multiple neurofibromatosis. Springfield, IL: Charles C Thomas [Google Scholar]
- Friedman JM. 1999. Epidemiology of neurofibromatosis type 1. Am J Med Genet. 89:1–6 [PubMed] [Google Scholar]
- Friedman JM, Riccardi VM. 1999. Clinical and epidemiological features. In Gutmann DH, MacCollin M, Riccardi VM, eds. Neurofibromatosis: phenotype, natural history, and pathogenesis. Baltimore: John Hopkins University Press; p. 26–86 [Google Scholar]
- Giorno R, Claman HN. 1988. Mast cells and neurofibromatosis. Neurofibromatosis. 1:100–104 [PubMed] [Google Scholar]
- Giorno R, Lieber J, Claman HN. 1989. Ultrastructural evidence for mast cell activation in a case of neurofibromatosis. Neurofibromatosis. 2:35–41 [PubMed] [Google Scholar]
- Harkin J, Reed R. 1968. Atlas of tumor pathology. Washington, DC: Armed Forces Institute of Pathology [Google Scholar]
- Isaacson P. 1976. Mast cells in benign nerve sheath tumours. J Pathol. 119:193–196 [DOI] [PubMed] [Google Scholar]
- Johnson MD, Kamso-Pratt J, Federspiel CF, Whetsell WO., Jr 1989. Mast cell and lymphoreticular infiltrates in neurofibromas: comparison with nerve sheath tumors. Arch Pathol Lab Med. 113:1263–1270 [PubMed] [Google Scholar]
- Korf B, Rubenstein A. 2005. Neurofibromatosis: a handbook for patients, families and health care professionals. 2nd ed. New York: Thieme Medical [Google Scholar]
- Masson P. 1970. Human tumors: histology, diagnosis and technique. 2nd ed. Detroit, MI: Wayne State University Press [Google Scholar]
- National Institutes of Health Consensus Development Conference Statement: neurofibromatosis 1988. Neurofibromatosis. 1:172–1783152465 [Google Scholar]
- Riccardi VM. 1981. Cutaneous manifestation of neurofibromatosis: cellular interaction, pigmentation, and mast cells. Birth Defects Orig Artic Ser. 17:129–147 [PubMed] [Google Scholar]
- Riccardi VM. 1987. Mast-cell stabilization to decrease neurofibroma growth: preliminary experience with ketotifen. Arch Dermatol. 123:1011–1016 [PubMed] [Google Scholar]
- Riccardi VM. 1992. An overview of NF-1: dysplasia and neoplasia. In Riccardi VM, ed. Neurofibromatosis: phenotype, natural history and pathogenesis. Baltimore: Johns Hopkins University Press; p. 18–39 [Google Scholar]
- Riccardi VM. 1993. A controlled multiphase trial of ketotifen to minimize neurofibroma-associated pain and itching. Arch Dermatol. 129:577–581 [PubMed] [Google Scholar]
- Riccardi VM, Wald JS. 1987. Discounting an adverse maternal effect on severity of neurofibromatosis. Pediatrics. 79:386–393 [PubMed] [Google Scholar]
- Wheater P, Burkitt H, Daniels V. 1993. Functional histology: a text and colour atlas. New York: Churchill Livingstone [Google Scholar]
- Wiesteler O, Radner H. 1994. Pathology of neurofibromatosis 1 and 2. In Huson S, Hughes R, eds. The neurofibromatoses: a pathogenetic and clinical overview. London: Chapman & Hall Medical; p. 135–159 [Google Scholar]
- Woodruff JM. 1999. Pathology of tumors of the peripheral nerve sheath in type 1 neurofibromatosis. Am J Med Genet. 89:23–30 [DOI] [PubMed] [Google Scholar]
- Yang FC, Ingram DA, Chen S, Zhu Y, Yuan J, Li X, Yang X, Knowles S, Horn W, Li Y, et al. 2008. Nf1-dependent tumors require a microenvironment containing Nf1+/–– and c-kit-dependent bone marrow. Cell. 135:437–448 [DOI] [PMC free article] [PubMed] [Google Scholar]
- Zhu Y, Ghosh P, Charnay P, Burns DK, Parada LF. 2002. Neurofibromas in NF1: Schwann cell origin and role of tumor environment. Science. 296:920–922 [DOI] [PMC free article] [PubMed] [Google Scholar]