Abstract
Background
Circulating endothelial cells (CECs) have been proposed to predict patient response to antiangiogenic cancer therapy. However, contradictory reports and inconsistency in the phenotypic identification of CECs have led us to compare three cell populations with partially overlapping phenotype in cancer patients receiving chemotherapy and the antiangiogenic agent bevacizumab.
Methods
Patients (n = 20) with locally advanced pancreatic cancer were monitored during 16 weeks of neoadjuvant treatment with gemcitabine and bevacizumab. Detection of circulating cell populations was based on the marker combination CD45, CD31, and CD146; levels of viable and dead (7-aminoactinomycin D-positive) cells were evaluated by flow cytometry in 2-week intervals.
Results
We were able to discriminate and concomitantly monitor three cell populations elevated in cancer patients. Whereas CECs were defined as CD45- CD31+ CD146+, the distinct populations of CD45- CD31- CD146+ and CD45- CD31high CD146- cells were partly positive for CD3 and CD41, respectively. CECs and CD45- CD31- CD146+ cells increased during therapy; the rise in dead cells was positively correlated with patient response or survival. Conversely, CD45- CD31high CD146- cells decreased in neoadjuvant treatment. A highly significant correlation was established for improved patient response and a minor decrease in viable cell counts.
Conclusions
Flow cytometric CEC analysis based on CD45, CD31, and CD146 requires careful discrimination between blood cell populations with overlapping phenotype showing hallmarks of activated T cells and large platelets. However, these three cell populations show distinct regulation during cancer therapy, and their concomitant analysis may offer extended prognostic and predictive information.
Introduction
Antiangiogenic treatment has gained importance in cancer therapy during the last decade [1]. Thus, bevacizumab, a neutralizing monoclonal antibody to proangiogenic vascular endothelial growth factor (VEGF) has shown benefit as single agent or in combination with standard chemotherapy in various types of cancer [2–4]. However, a remarkable number of patients do not respond to VEGF-targeted therapy [5,6]. Therefore, markers to identify patients most likely to profit from antiangiogenic treatment are urgently needed [7,8].
Among the potential biomarkers that have been tested in the context of anti-VEGF therapy, circulating endothelial cells (CECs) have shown promising results [9]. Of note, a multitude of detection methods have been applied for CEC enumeration, which greatly limits comparability. This is reflected by an enormous heterogeneity in the reported blood levels of CECs and their ascribed potential to predict patient survival and therapy response [10–13].
Flow cytometric detection and immunomagnetic bead isolation of CECs in whole blood samples are the most commonly applied CEC quantitation methods in clinical studies. Whereas immunomagnetic bead isolation is more readily standardized, analysis by flow cytometry offers the advantage to discriminate between cell populations with distinct antigen expression levels and therefore yields more detailed information on cell subsets and their predictive potential. In particular, the lack of an endothelial cell-specific marker and the antigen overlap with other blood cells have raised major concerns that CEC detection might include cells of nonendothelial origin. CEC identification was frequently based on the marker combinations CD45- CD146+ CD31+ or CD45- CD146+ CD34+. It was subsequently found that large platelets (CD45- CD146- CD31+ CD34+) and activated T cells (CD45+ CD146+ CD31+ CD34-) share antigenic determinants that may interfere with CEC evaluation [14–17]. This has recently led to the development of advanced flow cytometry protocols including platelet discriminators such as DNA stains and refined gating strategies to eliminate contaminating cell populations and focus on CEC detection [18,19].
In 2006 to 2008, we conducted a clinical trial with locally advanced pancreatic cancer patients and monitored CEC blood levels during neoadjuvant treatment with bevacizumab and gemcitabine. CEC detection was based on the original flow cytometry protocol (CD45- CD146+ CD31+) established by Mancuso et al. [20]. While the procedure has meanwhile been revised [19], we found that the original protocol offers the possibility to discriminate between three cell populations of distinct phenotype which carry hallmarks of T cells, large platelets, and CECs, respectively. We hypothesized that the three cell populations show distinct regulation during therapy, and we aimed to establish whether careful discrimination between these subsets might improve the predictive and prognostic information of CEC monitoring.
Materials and Methods
Study Collectives and Study Design
Twenty previously untreated patients with locally advanced, non-metastatic pancreatic cancer (UICC stage III [T4, any N, M0]: tumor has spread beyond the pancreas into nearby large blood vessels [T4], there may be spread to regional lymph nodes [any N], but no distant metastasis [M0]) were enrolled in the study. Exclusion criteria comprised stage IA to IIB and stage IV disease, any prior systemic cancer treatment, major surgery within the last 28 days, a history of bleeding or coagulation disorders, as well as other malignant diseases within the last 5 years.
Patients were randomly assigned to two treatment arms. Both groups received 1000 mg/m2 gemcitabine on days 1, 8, and 15 of four consecutive 4-week cycles. Group 1 (four women and five men; median age = 65 years, range = 43–77 years) started with the biweekly addition of 5 mg/kg bevacizumab in week 3 of the second cycle. Patients in group 2 (five women and six men; median age = 62 years, range = 52–80 years) received bevacizumab from the beginning of chemotherapy. The fourth cycle did not include bevacizumab, providing a gap of at least 8 weeks between the last antibody dose and pancreatic surgery. Blood samples for CEC and VEGF monitoring were drawn from patients at 2-week intervals during the entire neoadjuvant treatment period. Levels of the tumor marker CA-19-9 were determined by routine hospital analysis. Furthermore, one-time blood samples were taken from a control collective of 30 healthy volunteers comprising 11 women and 19 men, with a median age of 58 years, ranging from 45 to 74 years.
The clinical study was registered in the public registry EudraCT (no. 2005-004519-32). The study protocol and the analysis of blood samples were approved by the institutional ethics committee; all patients and healthy volunteers gave written informed consent.
Assessment of VEGF Blood Concentrations
Platelet-poor plasma was prepared as previously reported by us [21]. In brief, peripheral blood was drawn into prechilled tubes containing citrate, theophylline, adenosine, and dipyridamole; was immediately placed on ice; and further processed within 30 minutes. After an initial centrifugation step at 1000g and 4°C for 10 minutes, the plasma supernatant was subjected to further centrifugation at 10,000g and 4°C for 10 minutes (to remove remaining platelets). Plasma samples were analyzed by a commercially available enzyme-linked immunosorbent assay for VEGF-A (Quantikine; R&D Systems [Minneapolis, MN] or Invitrogen Corp [Camarillo, CA]), which exhibits the capacity to detect bevacizumab-bound VEGF-A with reduced sensitivity.
Immunostaining and Flow Cytometric Detection of CECs
Three milliliters of peripheral blood was drawn in EDTA tubes, and 200 µl was subjected to immunostaining with anti-human CD45-PC5 (Immunotech, Beckman Coulter, Brea, CA), CD31-fluorescein isothiocyanate (Immunotech), CD146-phycoerythrin (Chemicon, Billerica, MA), and 7-aminoactinomycin D (7-AAD; Immunotech). Addition of CD3-PC7 (Immunotech) or CD41-PC7 (Immunotech) was applied in a limited set of analyses. After a “lyse-no-wash” procedure with VersaLyse reagent (Immunotech), the samples were analyzed with an FC500 flow cytometer (Beckman Coulter) for the detection of three cell populations: 1) CD45- CD31+ CD146+, 2) CD45- CD31- CD146+, and 3) CD45- CD31high CD146-. To evaluate cell viability 7-AAD was applied. In total, 500,000 blood cells were analyzed by flow cytometry, and cell counts of the three identified cell populations are given in relation to the 500,000 measured blood cells. Flow cytometric data were subsequently processed with Kaluza Analysis 1.0 software (Beckman Coulter).
Evaluation of Response
Objective tumor response to neoadjuvant treatment was evaluated by computed tomography or magnetic resonance imaging and was defined in categories of progressive disease, stable disease, or partial remission according to Response Evaluation Criteria in Solid Tumors (RECIST). Overall survival of patients was assessed in a 2-year follow-up period (with 1 patient alive at the time of study closure).
Statistical Analysis
Statistical analyses were carried out with SPSS 17.0.1 Software (SPSS, Inc, Chicago, IL) and were based on nonparametric tests for correlation (Spearman test, two-sided) and differences between treatment groups (Mann-Whitney U test, two-sided) or time points of analysis (Wilcoxon test, two-sided). For the assessment of treatment-related changes in parameter levels, regression analysis was performed for all time points of blood sampling per patient. The slope (incline) k as determined by regression analysis, as well as the baseline and end point measurements of the three cell populations were separately evaluated for correlation with treatment response and patient survival (Spearman test, two-sided). Data are generally presented by box plot illustration; outliers and extreme values are not depicted.
Results
Flow Cytometric Identification of Three Blood Cell Populations with Distinct CD45, CD31, and CD146 Phenotype
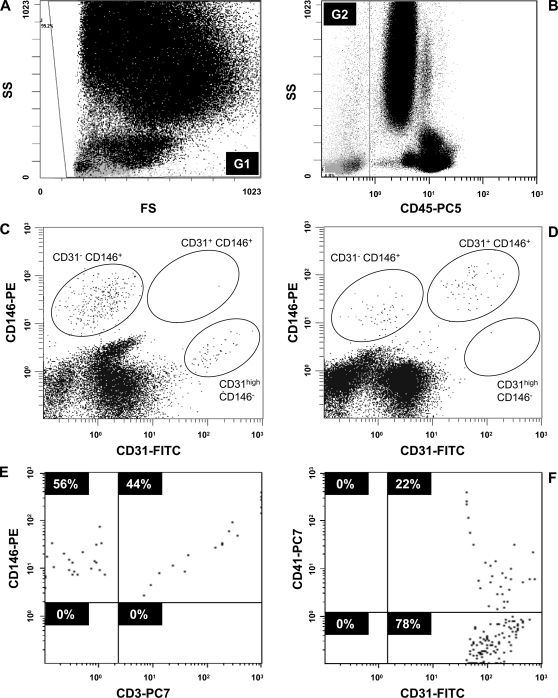
Peripheral blood cells were stained with antibodies directed to CD45, CD31, and CD146. Cells were not discriminated based on forward or side scatter properties but were gated according to CD45 detection (Figure 1, A and B). When CD45-negative cells were evaluated for surface expression of CD31 and CD146, three distinct cell populations became apparent characterized by double-positive CD31+ CD146+ or single-positive CD31- CD146+ and CD31high CD146- phenotypes. Furthermore, the proportion of viable (7-AAD-negative) and dead (7-AAD-positive) cells was established for each cell type. The prevalence of cell populations differed between healthy individuals and tumor patients under therapy (Figure 1, C and D) and was subject to subsequent investigation.
Figure 1.
Flow cytometric discrimination of blood cell populations based on CD45, CD31, and CD146 detection. Immunostaining of peripheral blood with 7-AAD, fluorescein isothiocyanate-labeled anti-CD31, phycoerythrin-labeled anti-CD146, and PC5-labeled anti-CD45 antibodies was followed by erythrolysis and flow cytometry. A total of 500,000 blood cells were evaluated in gate G1 of forward and side scatter analysis (A) and were investigated for CD45 expression (B). The CD45-negative population was defined by gate G2. Further assessment of CD31 and CD146 expression was based on G2 gating (in C and D). The detection of three distinct cell populations with CD45- CD31+ CD146+, CD45- CD31- CD146+, and CD45- CD31high CD146- phenotype was compared for blood obtained from a healthy individual (C) and a pancreatic cancer patient undergoing chemotherapy (D). Blood samples from five healthy subjects were further stained with PC7-labeled anti-CD3 (E) or anti-CD41 (F) antibodies. The analyses are presented as gated on the CD45- CD31- CD146+ cell subset (E) and the CD45- CD31high CD146- population (F), respectively.
In addition, when antibodies to CD3 or CD41 were included in the analysis to further characterize the three cell populations (Figure 1, E and F), we found the CD45- CD31- CD146+ subset to be largely positive for CD3, whereas the two other cell populations were negative for CD3 expression. Comparably, the CD45- CD31high CD146- cells presented partially positive for CD41. Thus, in contrast to the proposed CEC population (CD45- CD31+ CD146+ cells), T-cell characteristics (CD3) were found for the CD45- CD31- CD146+ subset, and hallmarks of platelets (CD41) were detected within the CD45- CD31high CD146- population. It should be noted that CD45- CD31high CD146- cells represented a distinctive subset of the general platelet population that was detected by CD45- CD31low CD146- marker expression (Figure 1, C and D).
Comparison of Pancreatic Cancer Patients and Healthy Controls
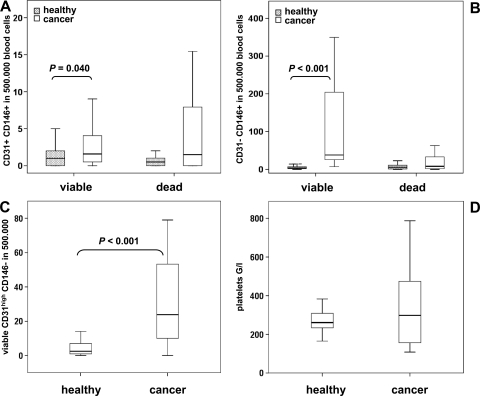
The three defined cell populations were evaluated in 16 untreated patients with locally advanced pancreatic cancer and 30 age-matched healthy volunteers. Comparing the two collectives a 2.3-fold elevation of median CD45- CD31+ CD146+ cell count was apparent in cancer patients (P = .046) corresponding to 2 and 4.5 events in 500,000 blood cells in healthy subjects and patients, respectively. When evaluated separately for viable and dead CD45- CD31+ CD146+ cells (Figure 2A), both fractions showed a broader distribution in cancer patients, with viable cell concentrations being significantly higher in disease (P = .040).
Figure 2.
Comparison of blood cell populations in healthy individuals and pancreatic cancer patients. Blood levels of CD45- CD31+ CD146+ (A), CD45- CD31- CD146+ (B), and CD45- CD31high CD146- (C) cells were determined in 30 healthy volunteers and 16 pancreatic cancer patients before therapy. When applicable, viable and dead cell populations were discriminated based on 7-AAD staining. The total platelet count was established for both groups (D). Data are illustrated by box plot; significant differences between cancer patients and healthy volunteers are indicated.
Similarly, viable CD45- CD31- CD146+ cells were remarkably elevated in cancer patients resulting in a 5.4-fold increase of total cell count (Figure 2B; P < .001) from median levels of 11 to 60 CD45- CD31- CD146+ cells per 500,000 blood cells. Dead CD45- CD31- CD146+ cells did not differ significantly between groups.
In line with these results, CD45- CD31high CD146- cells were found to be significantly (9.5-fold; P < .001) elevated in cancer patients. A median count of 24 per 500,000 blood cells was recorded for tumor patients as opposed to 2.5 per 500,000 blood cells in healthy volunteers (Figure 2C). Of note, 7-AAD generally did not stain CD45- CD31high CD146- cells, which may indicate a lack of dead cells or a lack of nuclear DNA (being a hallmark of platelets). Thus, we compared overall platelet counts in healthy individuals and cancer patients but found no significant difference between groups (Figure 2D).
Parameter Changes during Pancreatic Cancer Therapy
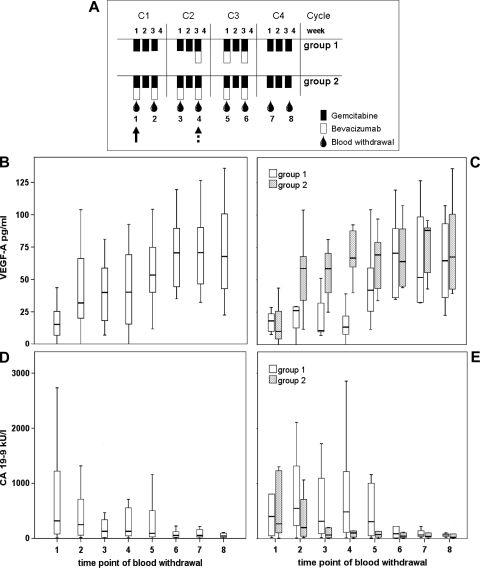
To investigate the time course of these blood cell populations in cancer therapy, 20 patients with locally advanced pancreatic cancer were randomized into two treatment arms (Figure 3A). Both study groups received neoadjuvant gemcitabine therapy on days 1, 8, and 15 of four consecutive 4-week cycles. Group 2 received biweekly addition of bevacizumab from treatment start, whereas group 1 had a delayed onset of bevacizumab therapy in week 3 of cycle 2. Blood samples were collected at 2-week intervals during the neoadjuvant treatment period to closely monitor therapy-induced changes in blood cell populations. VEGF and CA-19-9 concentrations were determined to further assess the therapeutic impact.
Figure 3.
Blood levels of VEGF-A and CA-19-9 in pancreatic cancer patients undergoing neoadjuvant therapy. (A) Schematic representation of study design and blood sampling time points 1 to 8: The onset of bevacizumab administration is indicated by a dashed and solid arrow for treatment groups 1 and 2, respectively. Plasma concentrations of VEGF (B, C) and CA-19-9 (D, E) according to blood collection schedule are illustrated by box plot for all patients n = 20 (B, D) or for the individual treatment groups n1 = 9 and n2 = 11 (C, E). Please note that VEGF and CA-19-9 data have been presented in the context of another article relating to this study [34].
VEGF levels were found to increase rapidly on the first bevacizumab administration (P = .002), which has previously been described as a pharmacodynamic response to VEGF inactivation [22,23]. The rise in VEGF plasma concentration was observed at time points 5 and 2 for treatment groups 1 and 2, respectively, corresponding to the differential initiation of bevacizumab therapy in the treatment arms (Figure 3, B and C). With respect to the tumor marker CA-19-9, a significant decrease in blood concentration was evident (P = .006 for starting and end point), but no significant difference between groups was observed (Figure 3, D and E).
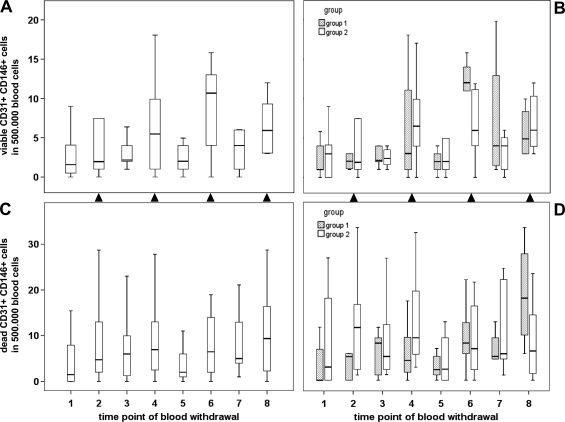
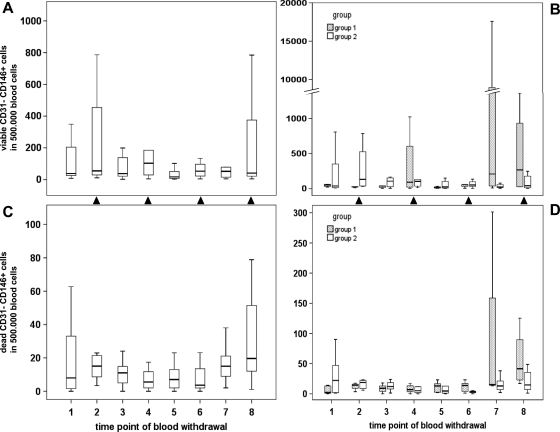
In contrast to the tumor marker decline, a substantial increase in viable CD45- CD31+ CD146+ cells was observed during pancreatic cancer therapy (Figure 4) as evidenced by a positive correlation with blood withdrawal time points (P = .003, k = 0.278). Of interest, cell counts seemed to closely follow the chemotherapy schedule, as they increased after chemotherapy administration and decreased after therapy breaks. To more appropriately reflect these chemotherapy-associated effects, cell measurements were assigned to two categories based on gemcitabine administration: median values of viable CD45- CD31+ CD146+ cells (Figure 4, A and B) established by blood sampling 1 week after gemcitabine administration (time points 2, 4, 6, and 8) ranged at 4.0 per 500,000 blood cells and were significantly higher than cell counts recorded before therapy or after chemotherapy breaks (time points 1, 3, 5, and 7), with a median value of 2.5 cells per 500,000 blood cells (P = .019). A comparable trend was observed for dead CD45- CD31+ CD146+ cells (Figure 4, C and D), as underlined by a significant correlation between dead and viable cell counts (P < .001, k = 0.420). However, chemotherapy-induced fluctuations were less pronounced for dead cells and did not reach statistical significance. Correspondingly, viable but not dead CD45- CD31+ CD146+ cells showed an inverse correlation with the tumor marker CA-19-9 (P = .009, k = -0.251). No significant difference in parameter fluctuations was observed between treatment arms 1 and 2. However, when the analysis was limited to the first four sampling points of chemotherapy without (group 1) or with (group 2) bevacizumab supplementation, a significantly higher level of dead (P = .005) but not of viable CD45- CD31+ CD146+ cells was recorded after bevacizumab administration.
Figure 4.
Effects of neoadjuvant treatment on circulating CD45- CD31+ CD146+ cells in pancreatic cancer patients. The time course of viable (A, B) and dead (C, D) cells is presented by box plot for the entire study collective n = 20 (A, C) or separately for treatment arms n1 = 9 and n2 = 11 (B, D). Time points of blood withdrawal after gemcitabine administration are indicated by closed triangles placed between plots.
The impact of therapy on circulating CD45- CD31- CD146+ cells was moderate and comparable between treatment groups (Figure 5). Again, viable cell counts were significantly higher (P = .031) after chemotherapy administration (median of 65 in 500,000 blood cells) than after treatment breaks (median of 34 in 500,000 blood cells) and showed a positive correlation with the fluctuations of viable CD45- CD31+ CD146+ cells (P = .002, k = 0.289). A similar trend for dead CD45- CD31- CD146+ cells was illustrated in the correlation between dead and viable CD45- CD31- CD146+ cell counts (P = .001, k = 0.308).
Figure 5.
Effects of neoadjuvant treatment on circulating CD45- CD31- CD146+ cells in pancreatic cancer patients. Viable (A, B) and dead (C, D) cell counts as established for the indicated time points of blood withdrawal are presented by box plot for the entire study collective n = 20 (A, C) or separately for treatment arms n1 = 9 and n2 = 11 (B, D). Sampling points after gemcitabine administration are indicated by closed triangles placed between plots.
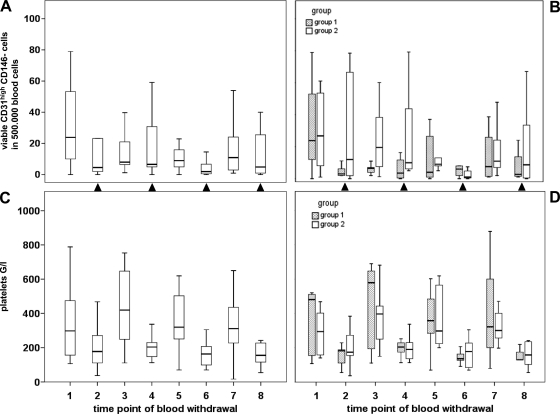
Remarkably, CD45- CD31high CD146- cells were inversely affected by chemotherapy, that is, cells decreased after chemotherapy administration and seemed to partially recover after chemotherapy breaks (Figure 6, A and B). This pattern of regulation was reflected in a significant difference (P = .017) of CD45- CD31high CD146- cell counts for samples obtained after chemotherapy (median of 6 cells per 500,000 blood cells) as opposed to therapy breaks (median of 11 cells per 500,000 blood cells). The general trend of CD45- CD31high CD146- blood levels to decrease during neoadjuvant treatment was reflected in a weak (inverse) correlation with sampling time points (P = .049, k = -0.184). Overall, no differences relating to treatment group were observed, and cells recorded were exclusively negative for 7-AAD. When comparing the overall fluctuations of platelet counts during therapy (Figure 6, C and D), a similar but more pronounced “drop-and-rebound” pattern according to chemotherapy schedule was evident (P < .001 for samples with or without preceding gemcitabine administration).
Figure 6.
Effects of neoadjuvant treatment on circulating CD45- CD31high CD146- cells and on general platelet counts in pancreatic cancer patients. The time course of viable (7-AAD-negative) CD45- CD31high CD146- cells (A, B) and blood platelet counts (C, D) is illustrated by box plot for the entire study collective n = 20 (A, C) or separately for treatment arms n1 = 9 and n2 = 11 (B, D). Time points of blood withdrawal after gemcitabine administration are indicated by closed triangles placed between plots.
Predictive and Prognostic Value of Blood Cell Populations
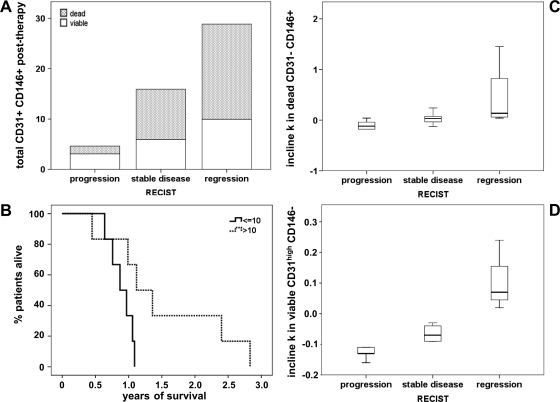
As we had monitored three distinct cell populations based on their CD45, CD31, and CD146 phenotypes, it was of interest to further compare their ability to predict therapy response (Figure 7) or overall survival. Nineteen of 20 patients had died at the time of study closure (with a median survival time of 12 months irrespective of treatment arm), and 16 patients were evaluated for therapy response according to RECIST criteria. Whereas five patients had progressive disease after neoadjuvant treatment, seven patients presented with stable disease and four study participants showed partial regression.
Figure 7.
Association of blood cell populations with treatment response or survival. Posttherapy levels of total (dead and viable) CD45- CD31+ CD146+ cells are presented by stacked bar plot according to treatment response (A). On the basis of the posttherapy levels of dead CD45- CD31+ CD146+ cells, patients were divided into two groups with high (>10) versus low (≤10) CEC counts per 500,000 blood cells, and the corresponding survival curves are plotted (B). The calculated parameter incline (k) during therapy is illustrated by box plot for dead CD45- CD31- CD146+ (C) and viable CD45- CD31high CD146- cells (D) in relation to treatment response according to RECIST criteria.
Higher levels of total or dead cell counts for the CD45- CD31+ CD146+ population as recorded at the end of neoadjuvant chemotherapy were found to correlate with improved patient response (Figure 7A; P = .047, k = 0.638). Correspondingly, the number of dead cells but not the viable CD45- CD31+ CD146+ cell count after therapy was associated with a longer survival time (Figure 7B; P = .042, k = 0.594).
Comparably, the rise in dead but not in viable CD45- CD31- CD146+ cells (as evaluated by the parameter incline during therapy) showed a highly significant, positive correlation with therapy response (Figure 7C; P = .004, k = 0.681). Of note, the initial increase within the first 2 weeks of therapy was also positively associated with treatment response (P = .044, k = 0.615).
The most striking correlation with therapy response, however, was observed for the CD45- CD31high CD146- cell population (Figure 7D). The parameter incline during therapy was positively associated with neoadjuvant treatment response (P = .001, k = 0.752), that is, an enhanced patient response was reflected in a minor decrease of circulating CD45- CD31high CD146- cells.
Discussion
The addition of bevacizumab to chemotherapy has shown benefit in several neoplastic entities. Unfortunately, only a proportion of patients seem to profit from antiangiogenic treatment, and markers to identify responders are urgently needed. CECs have shown promising results in this context. However, their enumeration is hampered by the phenotypic overlap with other blood cell populations. On the basis of an established flow cytometry protocol, we have been able to discriminate and concomitantly monitor three cell subsets with “CEC-like” phenotype. These cell populations showed differential regulation in response to treatment and distinct predictive potential. Our results may help to explain the heterogeneity in clinical CEC reports and further indicate that the differential evaluation of these cell populations offers improved predictive information.
With respect to the three blood cell populations with overlapping phenotype, CECs were defined as CD45- CD31+ CD146+. They are known to originate from destabilized vessels at tumor sites, and CEC release is further aggravated by chemotherapy-induced vessel injury. With the marker combination of CD45- CD31+ CD146+, the inclusion of endothelial progenitor cells cannot be entirely ruled out. However, based on the observation that endothelial progenitors may express low levels of CD45 and generally represent a small fraction (<5%) of CD146+ CECs [24], the contribution of endothelial progenitor cells to the established CEC counts is presumably minor.
We further found a population of CD45- CD31- CD146+ cells to largely carry the CD3 antigen, which is in accordance with previous reports on CD146 expression by activated T cells [25]. They may thus comprise a CD45-negative or CD45dim T-lymphocyte population [26] not excluded by CD45 gating. This T-cell subset seems to be activated in the tumor presence and to be further increased and affected on tumor damage by cancer therapy. In addition, mesenchymal progenitors [27] have been characterized by the marker expression of CD45- CD31- CD146+ and may thus contribute to the CD3- portion of this cell population.
In contrast, the CD45- CD31high CD146- cell subset presented partly positive for the platelet marker CD41, was consistently negative for DNA staining by 7-AAD and generally followed the platelet course during cancer therapy. As recently suggested by Strijbos et al. [15], flow cytometric measurement of CD45- CD31high cells may thus primarily detect a subset of large platelets which are a hallmark of cancer-related thrombocytopenia. It should be noted, however, that CD41 expression on CD45- CD31high CD146- cells was not homogeneous, indicating that this cell population may vary in the extent of CD41 expression or may comprise other cell types.
All three cell populations were found to be significantly elevated in pancreatic cancer patients compared with healthy controls. The increase was primarily based on viable (7-AAD-negative) cells, whereas dead cell populations generally showed a similar tendency without statistical significance. Levels of CECs were moderately elevated (2.3-fold), whereas a pronounced increase was recorded for CD45- CD31- CD146+ (5.4-fold) and CD45- CD31high CD146- cells (9.5-fold), resulting in median concentrations of 4.5, 60, and 24 cells per 500,000 investigated blood cells, respectively. When expressed in cell counts per milliliter blood, median levels of 68, 805 and 344 were determined for CECs, CD45- CD31- CD146+ and CD45- CD31high CD146- cells in pancreatic cancer patients. (The number of detected CECs was low, and samples with zero events per 500,000 analyzed blood cells corresponding to 150 to 200 µl of whole blood were occasionally recorded. Because these samples would be misrepresented by deducing the number of CECs per ml blood, data were generally given as determined for 500,000 investigated blood cells.) In literature, CECs have repeatedly been described to be elevated in tumor patients, and advanced detection protocols have recorded concentrations of 60 to 1800 predominantly viable CECs per milliliter depending on tumor entity and progression [19]. The comparably moderate, 2.3-fold elevated CEC level determined in our study (68 cells per milliliter) may thus reflect the local stage of disease and is in agreement with a 2.7-fold CEC increase recently reported for pancreatic cancer patients [28]. In contrast, CD45- CD31+ CD146- large platelets were proposed to reach substantially higher blood concentrations [15], as reflected in our CD45- CD31high CD146- cell count of 344 events per milliliter.
The determined pretreatment levels of the three cell populations did not correlate with survival or response to therapy—a finding that is supported by a number of other studies evaluating baseline CEC values in cancer patients [10–12]. In contrast, significant correlations of pretreatment CEC blood levels with patient prognosis and/or therapy response were reported by others and may relate to the difference in type of cancer or CEC detection method applied [29–32]. Furthermore, we would like to note that the number of study participants (n = 20) may be limiting for detecting small sample variations. However, the tight monitoring of parameter changes during therapy (with eight sampling time points) has yielded a more comprehensive and conclusive evaluation of treatment related effects. Thus, parameter regulation during therapy has been assessed based on multiple measurements and by calculating the linear slope (incline) in regression analysis.
With respect to treatment-related changes in the investigated parameters, we first evaluated blood levels of VEGF and CA-19-9. We confirmed the previously documented increase in plasma VEGF on bevacizumab administration [22,23] and a continuous decrease in CA-19-9 levels throughout the neoadjuvant treatment. No significant difference in tumor marker decline was observed between treatment arms with three versus six doses of bevacizumab supplementation to gemcitabine chemotherapy. Similarly, no substantial difference between treatment groups was apparent for the time course of the investigated blood cell populations.
CECs and CD45- CD31- CD146+ cells showed an overall increase in response to the combination therapy, with coregulation of viable and dead cell populations. However, the viable cell populations were more affected by a pronounced rebound (drop) phenomenon in chemotherapy breaks. In contrast, the number of dead CECs was significantly higher on bevacizumab supplementation to gemcitabine treatment. When evaluated for their predictive potential, the therapy-induced increase in dead (rather than viable) CECs and CD45- CD31- CD146+ cells showed a positive correlation with patient benefit. Of particular interest, the immediate rise in dead CD45- CD31- CD146+ cells within the first 2 weeks of therapy was positively correlated with treatment response and warrants further investigation as an early marker of response prediction.
A comparable and selective increase in dead (apoptotic) CECs has previously been reported for responding breast cancer patients under antiangiogenic, metronomic chemotherapy [11]. Similarly, a higher increase in CECs was associated with a clinical benefit for patients with gastrointestinal tumors receiving anti-VEGF receptor treatment [33]. With respect to CD45- CD31- CD146+ cells, clinical monitoring has not been actively pursued. However, Duda et al. [17] reported a general increase of CD146+ CD3+ (CD45-/+) cells in rectal cancer patients after bevacizumab administration.
The subset of CD45- CD31high CD146- cells showed an opposite tendency to decrease during neoadjuvant treatment of pancreatic cancer patients. Similar to the overall platelet count, a distinct drop and rebound pattern was recorded for CD45- CD31high CD146- cells in association with gemcitabine administration and chemotherapy breaks. However, the diagnostic and predictive potential of CD45- CD31high CD146- cells was clearly distinct from the general platelet population because overall platelet counts were not significantly elevated in cancer patients and the therapy-related changes were not associated with patient benefit. In contrast, an improved response to treatment showed a highly significant correlation with a minor decrease in CD45- CD31high CD146- cell concentrations during therapy. A comparable population of CD45- CD31bright CD146- cells has previously been reported to decrease after bevacizumab therapy for rectal cancer patients [17], and cell levels after combined treatment with bevacizumab and chemoradiotherapy were found to correlate with patient response [13].
In conclusion, we have monitored three cell populations with overlapping phenotype based on a standard protocol for CEC detection by flow cytometry. Whereas the distinct subsets have shown features of CECs (CD45- CD31+ CD146+), T cells (CD45- CD31- CD146+), and platelets (CD45- CD31high CD146-), their changes during cancer therapy rather than a comprehensive characterization of cell types has been the focus of this investigation. We found them to be differentially regulated by chemotherapy in combination with bevacizumab and to exhibit distinct predictive potential. The diversity in literature regarding CEC up-or down-regulation during cancer therapy and the associated prognostic and predictive evidence might in part be explained by a differential focus on or by the lack of discrimination between these cell populations. Thus, rather than distinguishing CECs from cell populations with overlapping phenotype, such as platelets, which have been effectively and successfully achieved by novel detection methods [19], the novelty of the described study is given in the concomitant monitoring of CECs with two CEC-like cell populations that have shown a distinct prognostic and predictive potential.
Abbreviations
- 7-AAD
7-aminoactinomycin D
- CEC
circulating endothelial cell
- VEGF
vascular endothelial growth factor
Footnotes
This work was supported by the Austrian National Bank (OeNB grant no. 12072 issued to S.F. Schoppmann). The clinical study was sponsored by Roche Pharmaceuticals, whereas the conducted biomarker analysis did not receive financial support by the company.
References
- 1.Gasparini G, Longo R, Fanelli M, Teicher BA. Combination of antiangiogenic therapy with other anticancer therapies: results, challenges, and open questions. J Clin Oncol. 2005;23:1295–1311. doi: 10.1200/JCO.2005.10.022. [DOI] [PubMed] [Google Scholar]
- 2.Sandler A, Gray R, Perry MC, Brahmer J, Schiller JH, Dowlati A, Lilenbaum R, Johnson DH. Paclitaxel-carboplatin alone or with bevacizumab for non-small-cell lung cancer. N Engl J Med. 2006;355:2542–2550. doi: 10.1056/NEJMoa061884. [DOI] [PubMed] [Google Scholar]
- 3.Hurwitz H, Fehrenbacher L, Novotny W, Cartwright T, Hainsworth J, Heim W, Berlin J, Baron A, Griffing S, Holmgren E, et al. Bevacizumab plus irinotecan, fluorouracil, and leucovorin for metastatic colorectal cancer. N Engl J Med. 2004;350:2335–2342. doi: 10.1056/NEJMoa032691. [DOI] [PubMed] [Google Scholar]
- 4.Miller K, Wang M, Gralow J, Dickler M, Cobleigh M, Perez EA, Shenkier T, Cella D, Davidson NE. Paclitaxel plus bevacizumab versus paclitaxel alone for metastatic breast cancer. N Engl J Med. 2007;357:2666–2676. doi: 10.1056/NEJMoa072113. [DOI] [PubMed] [Google Scholar]
- 5.Kindler HL, Niedzwiecki D, Hollis D, Sutherland S, Schrag D, Hurwitz H, Innocenti F, Mulcahy MF, O'Reilly E, Wozniak TF, et al. Gemcitabine plus bevacizumab compared with gemcitabine plus placebo in patients with advanced pancreatic cancer: phase III trial of the Cancer and Leukemia Group B (CALGB 80303) J Clin Oncol. 2010;28:3617–3622. doi: 10.1200/JCO.2010.28.1386. [DOI] [PMC free article] [PubMed] [Google Scholar]
- 6.Van Cutsem E, Vervenne WL, Bennouna J, Humblet Y, Gill S, Van Laethem JL, Verslype C, Scheithauer W, Shang A, Cosaert J, et al. Phase III trial of bevacizumab in combination with gemcitabine and erlotinib in patients with metastatic pancreatic cancer. J Clin Oncol. 2009;27:2231–2237. doi: 10.1200/JCO.2008.20.0238. [DOI] [PubMed] [Google Scholar]
- 7.Bertolini F, Mancuso P, Shaked Y, Kerbel RS. Molecular and cellular biomarkers for angiogenesis in clinical oncology. Drug Discov Today. 2007;12:806–812. doi: 10.1016/j.drudis.2007.08.011. [DOI] [PubMed] [Google Scholar]
- 8.Jain RK, Duda DG, Willett CG, Sahani DV, Zhu AX, Loeffler JS, Batchelor TT, Sorensen AG. Biomarkers of response and resistance to antiangiogenic therapy. Nat Rev Clin Oncol. 2009;6:327–338. doi: 10.1038/nrclinonc.2009.63. [DOI] [PMC free article] [PubMed] [Google Scholar]
- 9.Mancuso P, Bertolini F. Circulating endothelial cells as biomarkers in clinical oncology. Microvasc Res. 2010;79:224–228. doi: 10.1016/j.mvr.2010.02.007. [DOI] [PubMed] [Google Scholar]
- 10.Bidard FC, Mathiot C, Degeorges A, Etienne-Grimaldi MC, Delva R, Pivot X, Veyret C, Bergougnoux L, de Cremoux P, Milano G, et al. Clinical value of circulating endothelial cells and circulating tumor cells in metastatic breast cancer patients treated first line with bevacizumab and chemotherapy. Ann Oncol. 2010;21:1765–1771. doi: 10.1093/annonc/mdq052. [DOI] [PubMed] [Google Scholar]
- 11.Mancuso P, Colleoni M, Calleri A, Orlando L, Maisonneuve P, Pruneri G, Agliano A, Goldhirsch A, Shaked Y, Kerbel RS, et al. Circulating endothelial-cell kinetics and viability predict survival in breast cancer patients receiving metronomic chemotherapy. Blood. 2006;108:452–459. doi: 10.1182/blood-2005-11-4570. [DOI] [PMC free article] [PubMed] [Google Scholar]
- 12.Strijbos MH, Gratama JW, Schmitz PI, Rao C, Onstenk W, Doyle GV, Miller MC, de Wit R, Terstappen LW, Sleijfer S. Circulating endothelial cells, circulating tumour cells, tissue factor, endothelin-1 and overall survival in prostate cancer patients treated with docetaxel. Eur J Cancer. 2010;46:2027–2035. doi: 10.1016/j.ejca.2010.03.030. [DOI] [PubMed] [Google Scholar]
- 13.Willett CG, Duda DG, di Tomaso E, Boucher Y, Ancukiewicz M, Sahani DV, Lahdenranta J, Chung DC, Fischman AJ, Lauwers GY, et al. Efficacy, safety, and biomarkers of neoadjuvant bevacizumab, radiation therapy, and fluorouracil in rectal cancer: a multidisciplinary phase II study. J Clin Oncol. 2009;27:3020–3026. doi: 10.1200/JCO.2008.21.1771. [DOI] [PMC free article] [PubMed] [Google Scholar]
- 14.Khan SS, Solomon MA, McCoy JP., Jr Detection of circulating endothelial cells and endothelial progenitor cells by flow cytometry. Cytometry B Clin Cytom. 2005;64:1–8. doi: 10.1002/cyto.b.20040. [DOI] [PubMed] [Google Scholar]
- 15.Strijbos MH, Kraan J, den Bakker MA, Lambrecht BN, Sleijfer S, Gratama JW. Cells meeting our immunophenotypic criteria of endothelial cells are large platelets. Cytometry B Clin Cytom. 2007;72:86–93. doi: 10.1002/cyto.b.20156. [DOI] [PubMed] [Google Scholar]
- 16.Dignat-George F, Sabatier F, Blann A, Woywodt A. Detection of circulating endothelial cells: CD146-based magnetic separation enrichment or flow cytometric assay? J Clin Oncol. 2007;25:e1–e2. doi: 10.1200/JCO.2006.07.7677. [DOI] [PubMed] [Google Scholar]
- 17.Duda DG, Cohen KS, di Tomaso E, Au P, Klein RJ, Scadden DT, Willett CG, Jain RK. Differential CD146 expression on circulating versus tissue endothelial cells in rectal cancer patients: implications for circulating endothelial and progenitor cells as biomarkers for antiangiogenic therapy. J Clin Oncol. 2006;24:1449–1453. doi: 10.1200/JCO.2005.04.2861. [DOI] [PMC free article] [PubMed] [Google Scholar]
- 18.Goon PK, Watson T, Stonelake PS, Lip GY. The quest for circulating endothelial cell standardization: the peril of platelets. Cytometry B Clin Cytom. 2007;72:416. doi: 10.1002/cyto.b.20355. [DOI] [PubMed] [Google Scholar]
- 19.Mancuso P, Antoniotti P, Quarna J, Calleri A, Rabascio C, Tacchetti C, Braidotti P, Wu HK, Zurita AJ, Saronni L, et al. Validation of a standardized method for enumerating circulating endothelial cells and progenitors: flow cytometry and molecular and ultrastructural analyses. Clin Cancer Res. 2009;15:267–273. doi: 10.1158/1078-0432.CCR-08-0432. [DOI] [PubMed] [Google Scholar]
- 20.Mancuso P, Burlini A, Pruneri G, Goldhirsch A, Martinelli G, Bertolini F. Resting and activated endothelial cells are increased in the peripheral blood of cancer patients. Blood. 2001;97:3658–3661. doi: 10.1182/blood.v97.11.3658. [DOI] [PubMed] [Google Scholar]
- 21.Brostjan C, Bayer A, Zommer A, Gornikiewicz A, Roka S, Benko T, Yaghubian R, Jakesz R, Steger G, Gnant M, et al. Monitoring of circulating angiogenic factors in dendritic cell-based cancer immunotherapy. Cancer. 2003;98:2291–2301. doi: 10.1002/cncr.11776. [DOI] [PubMed] [Google Scholar]
- 22.Brostjan C, Gebhardt K, Gruenberger B, Steinrueck V, Zommer H, Freudenthaler H, Roka S, Gruenberger T. Neoadjuvant treatment of colorectal cancer with bevacizumab: the perioperative angiogenic balance is sensitive to systemic thrombospondin-1 levels. Clin Cancer Res. 2008;14:2065–2074. doi: 10.1158/1078-0432.CCR-07-4081. [DOI] [PubMed] [Google Scholar]
- 23.Willett CG, Boucher Y, Duda DG, di Tomaso E, Munn LL, Tong RT, Kozin SV, Petit L, Jain RK, Chung DC, et al. Surrogate markers for antiangiogenic therapy and dose-limiting toxicities for bevacizumab with radiation and chemotherapy: continued experience of a phase I trial in rectal cancer patients. J Clin Oncol. 2005;23:8136–8139. doi: 10.1200/JCO.2005.02.5635. [DOI] [PubMed] [Google Scholar]
- 24.Nakatani K, Takeshita S, Tsujimoto H, Kawamura Y, Tokutomi T, Sekine I. Circulating endothelial cells in Kawasaki disease. Clin Exp Immunol. 2003;131:536–540. doi: 10.1046/j.1365-2249.2003.02091.x. [DOI] [PMC free article] [PubMed] [Google Scholar]
- 25.Elshal MF, Khan SS, Takahashi Y, Solomon MA, McCoy JP., Jr CD146 (Mel-CAM), an adhesion marker of endothelial cells, is a novel marker of lymphocyte subset activation in normal peripheral blood. Blood. 2005;106:2923–2924. doi: 10.1182/blood-2005-06-2307. [DOI] [PubMed] [Google Scholar]
- 26.Matejuk A, Afentoulis M. Association of CD45(dim)VLA-4 (+) cells with the NKT cell lineage and their selective expression of IL-13, IP-15, and CCR3 transcripts. Arch Immunol Ther Exp (Warsz) 2006;54:183–191. doi: 10.1007/s00005-006-0021-3. [DOI] [PubMed] [Google Scholar]
- 27.Sacchetti B, Funari A, Michienzi S, Di Cesare S, Piersanti S, Saggio I, Tagliafico E, Ferrari S, Robey PG, Riminucci M, et al. Self-renewing osteoprogenitors in bone marrow sinusoids can organize a hematopoietic microenvironment. Cell. 2007;131:324–336. doi: 10.1016/j.cell.2007.08.025. [DOI] [PubMed] [Google Scholar]
- 28.Sabbaghian MS, Rothberger G, Alongi AP, Gagner JP, Goldberg JD, Rolnitzky L, Chiriboga L, Hajdu CH, Zagzag D, Basch R, et al. Levels of elevated circulating endothelial cell decline after tumor resection in patients with pancreatic ductal adenocarcinoma. Anticancer Res. 2010;30:2911–2917. [PubMed] [Google Scholar]
- 29.Calleri A, Bono A, Bagnardi V, Quarna J, Mancuso P, Rabascio C, Dellapasqua S, Campagnoli E, Shaked Y, Goldhirsch A, et al. Predictive potential of angiogenic growth factors and circulating endothelial cells in breast cancer patients receiving metronomic chemotherapy plus bevacizumab. Clin Cancer Res. 2009;15:7652–7657. doi: 10.1158/1078-0432.CCR-09-1493. [DOI] [PubMed] [Google Scholar]
- 30.Dellapasqua S, Bertolini F, Bagnardi V, Campagnoli E, Scarano E, Torrisi R, Shaked Y, Mancuso P, Goldhirsch A, Rocca A, et al. Metronomic cyclophosphamide and capecitabine combined with bevacizumab in advanced breast cancer. J Clin Oncol. 2008;26:4899–4905. doi: 10.1200/JCO.2008.17.4789. [DOI] [PubMed] [Google Scholar]
- 31.Goon PK, Lip GY, Stonelake PS, Blann AD. Circulating endothelial cells and circulating progenitor cells in breast cancer: relationship to endothelial damage/dysfunction/apoptosis, clinicopathologic factors, and the Nottingham Prognostic Index. Neoplasia. 2009;11:771–779. doi: 10.1593/neo.09490. [DOI] [PMC free article] [PubMed] [Google Scholar]
- 32.Ko AH, Venook AP, Bergsland EK, Kelley RK, Korn WM, Dito E, Schillinger B, Scott J, Hwang J, Tempero MA. A phase II study of bevacizumab plus erlotinib for gemcitabine-refractory metastatic pancreatic cancer. Cancer Chemother Pharmacol. 2010;66:1051–1057. doi: 10.1007/s00280-010-1257-5. [DOI] [PubMed] [Google Scholar]
- 33.Norden-Zfoni A, Desai J, Manola J, Beaudry P, Force J, Maki R, Folkman J, Bello C, Baum C, DePrimo SE, et al. Blood-based biomarkers of SU11248 activity and clinical outcome in patients with metastatic imatinib-resistant gastrointestinal stromal tumor. Clin Cancer Res. 2007;13:2643–2650. doi: 10.1158/1078-0432.CCR-06-0919. [DOI] [PubMed] [Google Scholar]
- 34.Starlinger P, Brugger P, Schauer D, Sommerfeldt S, Tamandl D, Kuehrer I, Schoppmann SF, Gnant M, Brostjan C. Myelosuppression of thrombocytes and monocytes is associated with a lack of synergy between chemotherapy and anti-VEGF treatment. Neoplasia. 2011;13:419–427. doi: 10.1593/neo.101508. [DOI] [PMC free article] [PubMed] [Google Scholar]


