

Abstract
Collapsing multiple variants into one variable and testing their collective effect is a useful strategy for rare variant association analysis. Direct collapsing, however, is not valid or may significantly lose power when a group of variants to be collapsed have heterogeneous effects on target traits (i.e. some positive and some negative). This could be especially true for quantitative traits (such as blood pressure and body mass index), regardless of whether subjects are sampled randomly from a population or selectively from two extreme tails of the trait distribution. To deal with this problem, we propose a novel, data-driven method, the P-value Weighted Sum Test (PWST), which allows each variant to be individually weighted according to the evidence of association from the data itself. Specifically, both significance and direction of individual variant effects are used to calculate a single weighted sum score based on rescaled left-tail p-values from single-variant analysis, after which a permutation test of association is performed between the score and the trait. Our simulation under different sampling strategies shows that PWST significantly increases statistical power when there are heterogeneous variant effects. The appeal of the PWST approach is illustrated in an application to sequence data by detecting the collective effect of variants in the peroxisome proliferator-activated receptor alpha (PPARα) gene on triglycerides (TG) response to fenofibrate treatment from 300 subjects in the GOLDN study.
Keywords: rare variant, collapsing, heterogeneous effects, sum test, quantitative trait
INTRODUCTION
Rare genetic variants have been recognized as one of important sources contributing to human complex disease-related traits, and advances of DNA genotyping and sequencing technologies in recent years have been facilitating the identification of disease-associated rare variants (RVs) [Cohen et al., 2004; Cohen et al., 2006; Ahituv et al., 2007; Ji et al., 2008; Buxbaum, 2009; Haller et al., 2009; Ingram et al., 2009; Knight et al., 2009; Morris et al., 2009; Nejentsev et al., 2009; Romeo et al., 2009; Sabatelli et al., 2009]. The expected distribution of RVs includes many with extremely low frequencies, and this, coupled with limited sample sizes, usually makes the power of single RV analysis too low. To increase the power by testing the collective effect of multiple RVs rather than effects of individual variants, a useful strategy of collapsing multiple RVs into one group variable has been proposed and different collapsing methods developed [Morgenthaler and Thilly, 2007; Li and Leal, 2008; Madsen and Browning, 2009; Han and Pan, 2010; Morris and Zeggini, 2010; Price et al., 2010; Ionita-Laza et al., 2011; Neale et al., 2011; Pan and Shen, 2011]. Although most early applications focused on binary traits from case-control or extreme-tail experimental designs, collapsing methods have also been applied to quantitative traits [Morris and Zeggini, 2010; Price et al., 2010]. Direct collapsing, however, is not valid or may significantly lose power when a collapsed group (e.g. a gene) contains variants with heterogeneous (i.e. some positive, some neutral, and some negative) effects on a trait. This could be true for many complex-disease-related traits, such as blood pressure, lipids, and body mass index, regardless of whether subjects are randomly sampled from population or selectively from extreme tails of trait distribution. In fact, we expect from population genetics theory that most genetic variation will be neutral [Kimura, 1968], so at the very least, simple collapsing will often, if not most times, represent a dilution of the true few RV signals. There are even examples of bi-directional variants within the same gene. For example, the proprotein convertase subtilisin/kexin type 9 serine protease gene (PCSK9) have been reported to have RVs significantly associated with both high and low plasma levels of low-density lipoprotein cholesterol (LDL-C) [Kotowski et al., 2006]. If we simply collapse all variants together regardless of the effect direction, the collective effect of the PCSK9 gene on LDL-C might not be detectable (or at least show a reduction in power). Methods to address this issue have not been well established, especially for direct analysis of quantitative traits without binarization.
Under the framework of a linear sum test, we propose a novel method, P-value Weighted Sum Test (PWST), which builds a weighted sum score for multiple RVs by using a weight that takes both significance and direction of individual variants’ effects into account, and then tests association between the score and target trait. Because we use a permutation test to assess significance, the PWST has the correct type-I error in all cases. Due to the strategy of incorporating direction information into analysis, the PWST has significantly more power when (but not limited) there are heterogeneous effects in data, as compared with other collapsing tests. We demonstrate this and other statistical properties of PWST using both simulated and real data of quantitative trait. We also investigate how different sampling strategies influence the power of PWST. Although PWST is applicable to both binary and quantitative traits, we focus on quantitative traits (without binarizaztion) in this paper.
METHODS
A GENERALIZED FRAMEWORK
With slight modification, most existing methods for a collapsing test of multiple RVs can be generalized as a weighted sum score test based on a linear model [Han and Pan, 2010],
| (1) |
Y is the observed quantitative trait (or logit-transformed conditional probability for binary trait), α the grand mean (or intercept), β the collective effect coefficient, m the number of RVs in a genetic unit (usually a gene) of interest, wi the weight of variant i, gi the number (0, 1 or 2) of minor allele of variant i, ε the residual effect. The Σwigi part in the model is the weighted sum score of multiple variants, denoted by S.
Most existing RV collapsing methods can be viewed as special instances of this model. For example, Morgenthaler and Thilly’s cohort allelic sums test (CAST) method [Morgenthaler and Thilly, 2007] is equivalent to setting wi =1 for all RVs; Similarly, Li and Leal’s CMC method [Li and Leal, 2008] sets wi =1 for all RVs but limits S=1 if S>1; Madsen and Browning’s weighted sum statistic (WSS) approach [Madsen and Browning, 2009] calculates wi based-on allele frequency in controls; Han and Pan’s adaptive sum (aSum) test [Han and Pan, 2010] recodes genotypes (equivalent to choosing wi = 1 or −1) according to the direction of estimated logistic regression coefficient and a pre-defined cutoff of p-value. Among these methods, only Han and Pan’s aSum test has tackled the problem of heterogeneous effects under a context of logistic regression of binary trait, and it requires arbitrary significance cutoff that may reduce the power if inappropriately chosen.
P-VALUE WEIGHTED SUM TEST (PWST)
To deal with the issue of heterogeneous effects of different RVs on a quantitative trait, we propose a data driven approach which calculates the weight wi below based on p-values from a single-variant test.
| (2) |
where ti is the statistic for individual variant i and p(t ≤ ti) is the left-tail p-value based on the distribution of t. Finally, wi is the re-scaled left-tail p-value from the single-variant test, with a range from −1 to 1 and a center of 0, reflecting both importance (or significance) and direction of effect (either increasing or decreasing trait values) of a variant. It is very similar in scale to Pearson’s correlation coefficient, but more generally applicable to any test that can produce left-tail p-values sensitive to effect direction. For example, for either a quantitative or a binary trait, we can utilize the Wald t-test
| (3) |
where bi is the estimated regression coefficient of variant i and sbi is the estimated standard error of bi.
As the key feature of the proposed method distinguishing from others is calculating wi based on direction-sensitive p-value, we refer to it as p-value weighted sum test (PWST). Here, we summarize the PWST procedure of application. First, obtain ti in (3) and the corresponding degree of freedom (DF) for each variant i, and calculate the weight wi based on (2). Then calculate the weighted sum score S=Σwigi of all included RVs for each subject. Finally, fit S and Y into model (1) and test the association between S and Y with a null hypothesis of β=0.
Because wi already contains information extracted from the observed data, re-feeding it into model (1) may result in large inflation of false positives if a regular test (based on a theoretic distribution, such as t-test) is used. We propose to determine the significance using permutation, where the p-value is obtained by repeating the analysis of model (1) many times on randomly permutated Y and calculating the fraction of pj ≤ p0. Here, pj is the p-value from each permutation and p0 from the regular test using non-permutated data. The weight, wi, is still obtained by regular analysis without permutation.
In terms of weighting, our method has similarity with a recently published method [Ionita-Laza et al., 2011] which also uses p-value related statistic as weight. The difference is that our method includes all RVs in one test whereas Ionita-Laza’s method tests positive and negative groups of RVs separately and then takes the minimum of p-values of the two tests. Ionita-Laza’s method was originally developed for case-control data, we modified it for quantitative data by 1) splitting RVs into positive and negative groups according to the sign of regression coefficient, 2) replacing Poisson distribution based p-values with p-values obtained by regression analysis of individual variants, 3) using logarized p-value, -log(p), as weight to calculate sum score for each individual, 4) fitting linear regression model (1) to the sum score and trait and calculating two p-values for the positive and negative groups separately, and 5) taking the minimum (denoted by pmin) of the two p-values and obtaining the final p-value for pmin by permutation. For the convenience of discussion, we refer to the modified procedure above as Separate P-value Weighted Sum Test (SPWST).
SIMULATED DATA
To investigate the statistical properties of PWST, we simulated data under a variety of parameter configurations, which is focused on only quantitative traits.
Under the assumption of Hardy-Weinberg equilibrium, we simulated genotypes of 1000 subjects for 20 or 30 RVs with an average minor allele frequency (MAF) of 0.0025 and different combinations of numbers of neutral, positive and/or negative variants. We simulated a quantitative trait for each subject according to a normal distribution with variance of 1 and mean of du, where d is the difference between the numbers of positive and negative variants in a subject, u is the additive genetic effect of RV randomly drawn from a normal distribution with mean of 0.8 and standard deviation of 0.4 (resulting in an approximate average heritability of 0.004 for individual RVs, and a total heritability of 0.04~0.08 for 10~20 RVs in the simulation). Finally, 300 subjects were sampled from the 1000 subjects according to three different experimental designs: 1) random sampling, 2) two-tail sampling (150 subjects with highest trait values and 150 lowest) and 3) two-tail and central sampling (100 from the highest, 100 from the lowest and 100 from the central portion). For the convenience of discussion, we refer to the three designs above as RDM, LR and LRC (here RDM means random; L, R and C mean left-tail, right-tail and central, respectively). We repeated simulation 2000 times for each configuration. For each replication, data under the null (i.e. all RVs are non-causal) were also simulated.
REAL DATA
The PWST was applied to PPARα resequencing data from 300 Caucasian subjects who participated in the Genetics of Lipid Lowering and Diet Network (GOLDN) Study [Smith et al., 2008]. The transcription factor PPARα is the molecular target of the triglyceride lowering treatment fenofibrate. When PPARα is activated by a ligand, including fenofibrate, genes involved in lipid metabolism are upregulated [Chapman, 2003]. The current study utilizes data from 150 low responders and 150 high responders to fenofibrate after treatment for 3 weeks at 160 mg/day. The resequencing strategy was based on technology for amplification of exons and flanking intronic sequences that include intronic splice sites. A total of 73 variants with an average MAF of 0.048 were discovered and 26 rare ones with MAF<0.01 were used for the purpose of method comparison.
METHODS FOR COMPARISON
We applied PWST to the simulated data, counting false positives and true positives for each analysis. False positive rate (FPR) and true positive rate (TPR, or power) were estimated by taking the average over 2000 replications and plotted as receiver operating characteristic (ROC) curves. As a comparison, we included the results from SPWST, CMC, WSS and aSum tests (for the convenience of presentation, we didn’t include the results from CAST, because it’s very similar to CMC. Its ROC curves are nearly identical and overlapped with CMC’s). Since these methods were originally proposed for the analysis of binary data from case-control design and the simulated data here is quantitative, we replaced their binary-data-based significance testing approaches with linear regression and only adopted their methods for weighting and collapsing genotypes. Because it requires control data, WSS was applied only to the LRC design, by treating subjects from the central portion as controls and subjects from either left or right tail as cases, and performing left-central and right-central analyses separately. Besides simulations, we also compared these methods using the real data described above. For all methods, 10000 permutations were used to obtain p-values.
RESULTS
The results presented here focus on two important statistical properties, type-1 error and power, of the proposed PWST method, in comparison with other methods, under different RV configurations and different study designs.
TYPE-1 ERROR
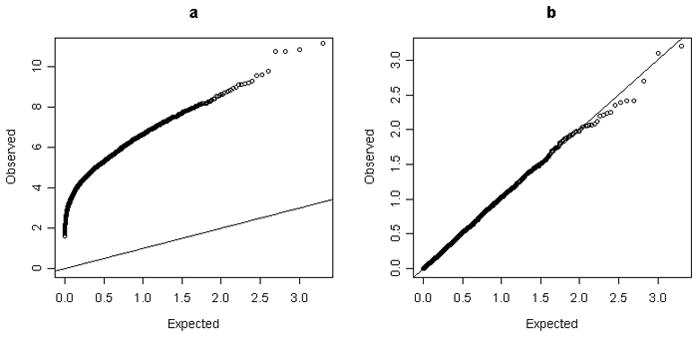
As weighted sum test methods (including PWST, SPWST, WSS and aSum) use observed data twice (one for calculating the weighted sum, one for assessing the significance test of the sum), direct testing may result in significant inflation of type error. According to our simulation under the null, the inflation factors of the uncorrected regular test were as high as 1.372 ~ 18.441 (Table I), which is not surprising, as there is overfitting to the data. By the use of the permutation test, the inflation factors were reduced to 0.987 ~ 1.041 (all close to 1) and the real type-1 error rates are consistent with the pre-defined significance levels of 0.05 and 0.01 (Table I), indicating no significant inflations. As a more detailed presentation, the quantile vs quantile (Q-Q) plots for the PWST method also illustrate that the high inflation can be well controlled by permutation test (Fig. 1). Since a permutation test produces non-inflated type-1 error and thus makes it comparable between different methods and different designs, we use it for power and ROC analysis in next section.
Table I.
Inflation factors and type-1 error rates of CMC, WSS, aSum, SPWST and PWST using uncorrected test and permutation test under 3 different experiment designs
| Testing methods | Experiment design | Inflation factor (and type-1 error rate at 0.05 and 0.01 significance levels) * |
||||
|---|---|---|---|---|---|---|
| CMC | WSS | aSum | SPWST | PWST | ||
| Uncorrected Regular Test | RDM | 1.008 (0.051,0.012) | NA | 2.591 (0.161,0.056) | 18.441 (0.995, 0.929) | 8.848 (0.999, 0.889) |
| LR | 1.050 (0.048,0.008) | NA | 2.294 (0.095,0.023) | 18.121 (0.993,0.938) | 8.420 (0.990,0.859) | |
| LCR | 1.030 (0.045,0.009) | 1.372 (0.095,0.025) | 2.511 (0.120,0.035) | 18.362 (0.994,0.927) | 8.543 (1.000,0.897) | |
|
| ||||||
| Final Permutation test | RDM | 1.041 (0.054,0.012) | NA | 0.999 (0.051,0.010) | 0.999 (0.045,0.012) | 1.001 (0.054,0.010) |
| LR | 1.006 (0.052,0.011) | NA | 1.002 (0.052,0.011) | 1.005 (0.050,0.011) | 1.030 (0.053,0.011) | |
| LCR | 1.018 (0.051,0.011) | 1.013 (0.051,0.010) | 0.987 (0.0530,0.010) | 0.993 (0.050,0.011) | 1.004 (0.051,0.011) | |
Each value is calculated from 2000 p-values obtained by simulations under the null.
Fig. 1.
POWER
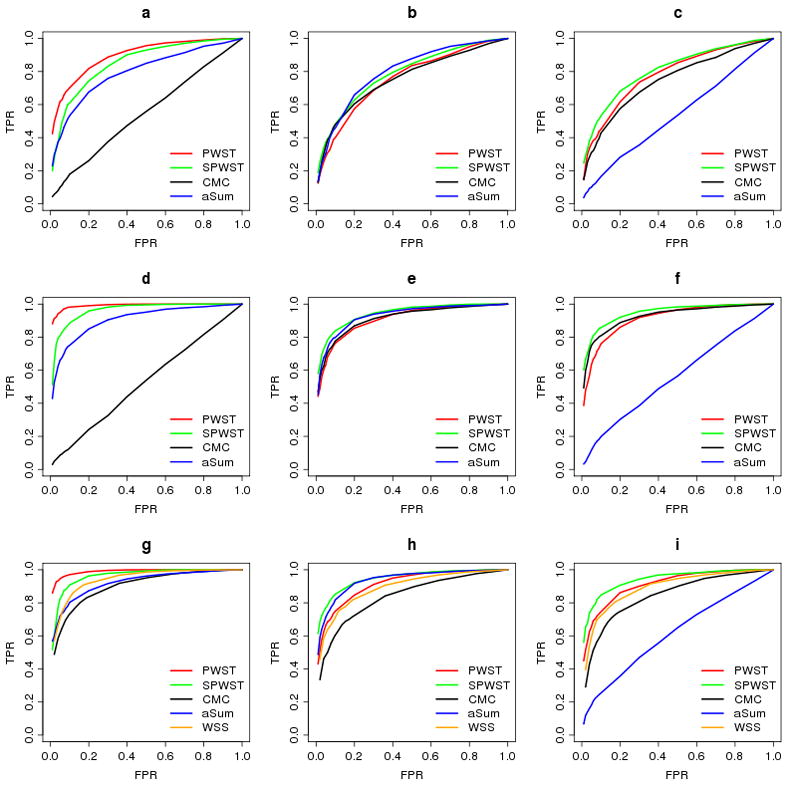
From the ROC curves (Fig. 2) obtained from the simulated data, it is seen that, as expected, PWST outperforms other methods when there are both positive-effect and negative-effect variants in the same gene (Fig. 2a,2d,1g). It is close to or better than other methods (except SPWST) in all other situations simulated. SPWST performs the best when effects of RVs come from the same direction. As another method taking effect direction into account, aSum performs differently for different effect directions because of its asymmetric weighting rule. Its power increases when there are only positive effects (Fig. 2a,2b,2d,2g,2h), and decreases when there are only negative effects (Fig. 2c,2f,2i). As a direct collapsing method, CMC assumes that the effects of all variants are in the same direction and doesn’t take different directions into account. When heterogeneous effects happen in the data, the power of CMC substantially decreases to nearly as low as the level of FPR (Fig. 2a,2d), due to the counteraction of opposite effects. Although the LCR sampling design significantly improves the power of CMC by treating central group as common control and two tails as separate cases, more power can be reached by PWST and SPWST (Fig. 2g,2h,2i), even there is no anti-direction effects.
Fig. 2.
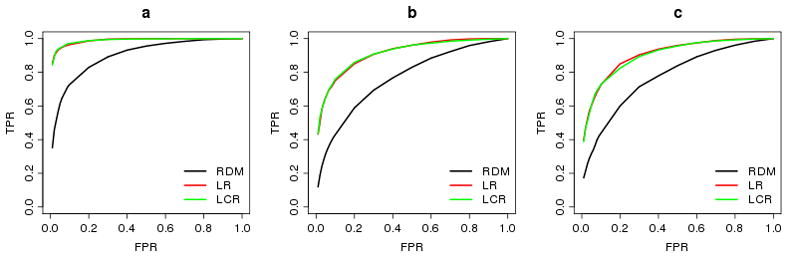
Overall, PWST is a powerful method, especially when there are anti-direction effects in data. Comparing the ROC curves of PWST for different experiment designs (Fig. 3), it can be seen that the LR and LCR designs have similar power, both higher than the RDM design.
Fig. 3.
APPLICATION
We applied PWST to the RVs of the PPARα gene, to detect their collective association with TG response to fenofibrate (as a quantitative trait). The p-value for the 13 non-intronic RVs in the gene is 0.0048, more significant than 0.0475 for all the 26 RVs that include both intronic and non-intronic (Table II). Combining the statistical result and clinical fact that fenofibrate is an effective treatment for hypertriglyceridemia by targeting PPARα, it is very likely that exonic RVs of PPARα are associated with TG response to fenofibrate treatment.
Table II.
P-values from CAST, CMC, WSS, aSum, SPWST and PWST, applied to the PPARα data with 10000 permutations
| Method | P-value for 26 variants a | P-value for 12 variants b |
|---|---|---|
| CAST | 0.7366 | 0.1836 |
| CMC | 0.6315 | 0.1824 |
| WSS c | 0.2843 | 0.0564 |
| WSS d | 0.4549 | 0.8452 |
| aSum | 0.5042 | 0.0604 |
| SPWST | 0.3604 | 0.2335 |
| PSWT | 0.0457 | 0.0048 |
Test for 26 rare variants with MAF<0.01, including both intronic and non-intronic variants;
Test for 12 rare variants with MAF<0.01, including only non-intronic variants;
Low TG responders are used to estimate allele frequency for weighting;
High TG responders are used to estimate allele frequency for weighting.
As a comparison, we also applied CMC, WSS, aSum and SPWST methods to the PPARα data. None of them produced significant p-value below 0.05 (Table II), indicating relatively higher power of PWST in this application. We observed in the data that among the 13 non-intronic variants of PPARα, there are 8 variants with increasing effects and 5 with decreasing effects on TG response. Their individual one-sided p-values tend to be distributed in two tails (none falls between 0.25 and 0.71, which is very unlikely under the null), indicating bidirectional effects in the data (Supplementary Table 1). This confirms our simulation result that PWST may provide extra statistical power when there are bi-directional effects. More details about rare variants in this gene can be found in Supplementary Table 1 and elsewhere (Irvin et al., in preparation).
DISCUSSION
The motivation for collapsing multiple RVs for analysis is based on the biological hypothesis that different RVs in the same genetic unit may have similar (or at least related) functions contributing to the same trait, as well as on the statistical consideration that testing the collective effect of multiple RVs can be more powerful than testing them individually. Although these ideas have been supported by some published data from real experiments and simulations, in practice the power of collapsing analysis is affected and determined (and could be more complicated) by many factors, such as genotyping error, numbers of functional and nonfunctional variants, effect size, direction of effect, sample size, sampling strategy, collapsing and testing methods. As a result, one of the most important issues of collapsing analysis is misclassification of collapsed variants, including functional misclassification (FM) and directional misclassification (DM). FM means including nonfunctional (neutral) variants in analysis and DM treating the effects of different variants as in the same direction whereas they could be in opposite directions. Compared with FM, DM can be more problematic to collapsing analysis, because 1) filtering variants based upon their annotation and functional prediction from genomic databases and bioinfomatic tools (such as SIFT and PolyPhen) may help with FM, but we usually do not know the biology well enough to filter for DM (indeed that is usually why we are doing the experiment), and 2) when DM happens in data, it reduces power much more significantly than FM, which can be seen from our simulation (Fig. 2).
To deal with both issues in a way that does not require any pre-filtering of variants, we have developed the PWST method by constructing a weighted sum test which takes into account both significance and direction information on effects of individual variants. We have demonstrated that our method significantly increases the power of detecting genetic unit with heterogeneous variants, and performs close to or better than direct collapsing methods even with no heterogeneous variants (i.e. no DM problem) in data. We have further observed that splitting RVs into positive and negative groups and testing the two groups separately using a PWST-like method (SPWST, a modified quantitative version of Ionita-Laza’s method) can achieve more power when variant effects are from single direction. In practice, since we don’t know whether or not there are bi-direction effects in observed data, it would be a good choice to combine the results from both PWST and SPWST.
A major advantage of PWST is that it requires no specific biological assumptions for observed data. For example, it is not necessary to assume the association between variant rarity and disease risk (required by the WSS method), or to assume the same effect direction for all (or most) functional variants (required by the CMC and WSS methods). PWST adaptively learns and estimates effect importance and direction for individual variants from observed data per se, and then use these learnt information as weight to construct a collective test. This data-adaptive strategy makes PWST more powerful, more flexible to different traits and different experimental designs, and more robust to the violation of particular assumptions.
The key feature of PWST is weighting individual variants by the use of a rescaled p-value which reflects both significance and direction of variant effect on trait. Essentially, PWST is a general data-adaptive weighting strategy (not a particular method) for sum test. It can be easily implemented with any methods that can obtain left-tail p-values sensitive to effect direction. For example, the linear regression used in this paper for quantitative traits can be replaced with logistic regression for binary traits, and covariates can be as well included in the model.
We have demonstrated the application of PWST to a real dataset using a fixed MAF cutoff of 0.01, which is arbitrary and may not be optimal. Theoretically, PWST can be used for testing a group of variants with any MAFs. To optimized it, PWST can be incorporated with some variable-threshold procedures [Price et al., 2010; Pan and Shen, 2011], and further investigation of the PWST-based variable-threshold procedures is warranted.
Supplementary Material
Acknowledgments
Contract grant sponsor: NIH; Contract grant Number: R01HL091357.
We thank Drs. Robert Straka, Jim Hixson and Jose Ordovas for generating the real resequencing data and clinical data, thank Ms. Shiow Jiuan (Rosa) Lin for assisting in data QC and preparation, and thank Drs. Warwick Daw and Aldi Kraja for constructive discussion and suggestion on statistical methods.
References
- Ahituv N, Kavaslar N, Schackwitz W, Ustaszewska A, Martin J, Hebert S, Doelle H, Ersoy B, Kryukov G, Schmidt S, et al. Medical sequencing at the extremes of human body mass. Am J Hum Genet. 2007;80(4):779–91. doi: 10.1086/513471. [DOI] [PMC free article] [PubMed] [Google Scholar]
- Buxbaum JD. Multiple rare variants in the etiology of autism spectrum disorders. Dialogues Clin Neurosci. 2009;11(1):35–43. doi: 10.31887/DCNS.2009.11.1/jdbuxbaum. [DOI] [PMC free article] [PubMed] [Google Scholar]
- Chapman MJ. Fibrates in 2003: therapeutic action in atherogenic dyslipidaemia and future perspectives. Atherosclerosis. 2003;171(1):1–13. doi: 10.1016/s0021-9150(03)00156-4. [DOI] [PubMed] [Google Scholar]
- Cohen JC, Kiss RS, Pertsemlidis A, Marcel YL, McPherson R, Hobbs HH. Multiple rare alleles contribute to low plasma levels of HDL cholesterol. Science. 2004;305(5685):869–72. doi: 10.1126/science.1099870. [DOI] [PubMed] [Google Scholar]
- Cohen JC, Pertsemlidis A, Fahmi S, Esmail S, Vega GL, Grundy SM, Hobbs HH. Multiple rare variants in NPC1L1 associated with reduced sterol absorption and plasma low-density lipoprotein levels. Proc Natl Acad Sci U S A. 2006;103(6):1810–5. doi: 10.1073/pnas.0508483103. [DOI] [PMC free article] [PubMed] [Google Scholar]
- Haller G, Torgerson DG, Ober C, Thompson EE. Sequencing the IL4 locus in African Americans implicates rare noncoding variants inasthma susceptibility. J Allergy Clin Immunol. 2009;124(6):1204–9. e9. doi: 10.1016/j.jaci.2009.09.013. [DOI] [PMC free article] [PubMed] [Google Scholar]
- Han F, Pan W. A data-adaptive sum test for disease association with multiple common or rare variants. Hum Hered. 2010;70(1):42–54. doi: 10.1159/000288704. [DOI] [PMC free article] [PubMed] [Google Scholar]
- Ingram CJ, Raga TO, Tarekegn A, Browning SL, Elamin MF, Bekele E, Thomas MG, Weale ME, Bradman N, Swallow DM. Multiple rare variants as a cause of a common phenotype: several different lactase persistence associated alleles in a single ethnic group. J Mol Evol. 2009;69(6):579–88. doi: 10.1007/s00239-009-9301-y. [DOI] [PubMed] [Google Scholar]
- Ionita-Laza I, Buxbaum JD, Laird NM, Lange C. A new testing strategy to identify rare variants with either risk or protective effect on disease. PLoS Genet. 2011;7(2):e1001289. doi: 10.1371/journal.pgen.1001289. [DOI] [PMC free article] [PubMed] [Google Scholar]
- Ji W, Foo JN, O’Roak BJ, Zhao H, Larson MG, Simon DB, Newton-Cheh C, State MW, Levy D, Lifton RP. Rare independent mutations in renal salt handling genes contribute to blood pressure variation. Nat Genet. 2008;40(5):592–9. doi: 10.1038/ng.118. [DOI] [PMC free article] [PubMed] [Google Scholar]
- Kimura M. Evolutionary rate at the molecular level. Nature. 1968;217(5129):624–6. doi: 10.1038/217624a0. [DOI] [PubMed] [Google Scholar]
- Knight HM, Pickard BS, Maclean A, Malloy MP, Soares DC, McRae AF, Condie A, White A, Hawkins W, McGhee K, et al. A cytogenetic abnormality and rare coding variants identify ABCA13 as a candidate gene in schizophrenia, bipolar disorder, and depression. Am J Hum Genet. 2009;85(6):833–46. doi: 10.1016/j.ajhg.2009.11.003. [DOI] [PMC free article] [PubMed] [Google Scholar]
- Kotowski IK, Pertsemlidis A, Luke A, Cooper RS, Vega GL, Cohen JC, Hobbs HH. A spectrum of PCSK9 alleles contributes to plasma levels of low-density lipoprotein cholesterol. Am J Hum Genet. 2006;78(3):410–22. doi: 10.1086/500615. [DOI] [PMC free article] [PubMed] [Google Scholar]
- Li B, Leal SM. Methods for detecting associations with rare variants for common diseases: application to analysis of sequence data. Am J Hum Genet. 2008;83(3):311–21. doi: 10.1016/j.ajhg.2008.06.024. [DOI] [PMC free article] [PubMed] [Google Scholar]
- Madsen BE, Browning SR. A groupwise association test for rare mutations using a weighted sum statistic. PLoS Genet. 2009;5(2):e1000384. doi: 10.1371/journal.pgen.1000384. [DOI] [PMC free article] [PubMed] [Google Scholar]
- Morgenthaler S, Thilly WG. A strategy to discover genes that carry multi-allelic or mono-allelic risk for common diseases: a cohort allelic sums test (CAST) Mutat Res. 2007;615(1–2):28–56. doi: 10.1016/j.mrfmmm.2006.09.003. [DOI] [PubMed] [Google Scholar]
- Morris AP, Zeggini E. An evaluation of statistical approaches to rare variant analysis in genetic association studies. Genet Epidemiol. 2010;34(2):188–93. doi: 10.1002/gepi.20450. [DOI] [PMC free article] [PubMed] [Google Scholar]
- Morris AP, Zeggini E, Lindgren CM. Identification of novel putative rheumatoid arthritis susceptibility genes via analysis of rare variants. BMC Proc. 2009;3(Suppl 7):S131. doi: 10.1186/1753-6561-3-s7-s131. [DOI] [PMC free article] [PubMed] [Google Scholar]
- Neale BM, Rivas MA, Voight BF, Altshuler D, Devlin B, Orho-Melander M, Kathiresan S, Purcell SM, Roeder K, Daly MJ. Testing for an unusual distribution of rare variants. PLoS Genet. 2011;7(3):e1001322. doi: 10.1371/journal.pgen.1001322. [DOI] [PMC free article] [PubMed] [Google Scholar]
- Nejentsev S, Walker N, Riches D, Egholm M, Todd JA. Rare variants of IFIH1, a gene implicated in antiviral responses, protect against type 1 diabetes. Science. 2009;324(5925):387–9. doi: 10.1126/science.1167728. [DOI] [PMC free article] [PubMed] [Google Scholar]
- Pan W, Shen X. Adaptive tests for association analysis of rare variants. Genet Epidemiol. 2011 doi: 10.1002/gepi.20586. [DOI] [PMC free article] [PubMed] [Google Scholar]
- Price AL, Kryukov GV, de Bakker PI, Purcell SM, Staples J, Wei LJ, Sunyaev SR. Pooled association tests for rare variants in exon-resequencing studies. Am J Hum Genet. 2010;86(6):832–8. doi: 10.1016/j.ajhg.2010.04.005. [DOI] [PMC free article] [PubMed] [Google Scholar]
- Romeo S, Yin W, Kozlitina J, Pennacchio LA, Boerwinkle E, Hobbs HH, Cohen JC. Rare loss-of-function mutations in ANGPTL family members contribute to plasma triglyceride levels in humans. J Clin Invest. 2009;119(1):70–9. doi: 10.1172/JCI37118. [DOI] [PMC free article] [PubMed] [Google Scholar]
- Sabatelli M, Eusebi F, Al-Chalabi A, Conte A, Madia F, Luigetti M, Mancuso I, Limatola C, Trettel F, Sobrero F, et al. Rare missense variants of neuronalnicotinic acetylcholine receptor altering receptor function are associated with sporadic amyotrophic lateral sclerosis. Hum Mol Genet. 2009;18(20):3997–4006. doi: 10.1093/hmg/ddp339. [DOI] [PubMed] [Google Scholar]
- Smith JA, Arnett DK, Kelly RJ, Ordovas JM, Sun YV, Hopkins PN, Hixson JE, Straka RJ, Peacock JM, Kardia SL. The genetic architecture of fasting plasma triglyceride response to fenofibrate treatment. Eur J Hum Genet. 2008;16(5):603–13. doi: 10.1038/sj.ejhg.5202003. [DOI] [PMC free article] [PubMed] [Google Scholar]
Associated Data
This section collects any data citations, data availability statements, or supplementary materials included in this article.