

Abstract
Gliomas are highly invasive, lethal brain tumors. Tumor-associated proteases play an important role in glioma progression. Annexin A2 is overexpressed in many cancers and correlates with increased plasmin activity on the tumor cell surface, which mediates degradation of extracellular matrix and promotes neoangiogenesis to facilitate tumor growth. In this study, we used two glioma cell lines, mouse GL261–EGFP and rat C6/LacZ, as well as stable clones transfected with an annexin A2 knockdown construct. We find that the annexin A2 knockdown decreased glioma cell migration in vitro and decreased membrane-bound plasmin activity. In vivo, we injected the glioma cells into the rodent brain and followed glioma progression. Knockdown of annexin A2 in glioma cells decreased tumor size and slowed tumor progression, as evidenced by decreased invasion, angiogenesis, and proliferation, as well as increased apoptosis in the tumor tissue of the annexin A2 knockdown group. Moreover, we report that the levels of expression of annexin A2 in human glioma samples correlate with their degree of malignancy. Together, our findings demonstrate that inhibition of annexin A2 expression in glioma cells could become a new target for glioma therapy.
Introduction
Malignant gliomas are primary CNS tumors arising from glial cells. As one of the deadliest cancers, glioblastoma multiforme (GBM) is associated with a median survival time of only 1 year, even with aggressive surgical resection combined with irradiation and chemotherapy (Stupp et al., 2005). Although many therapeutic approaches have been explored, there has been no major improvement in survival over the past 30 years (Legler et al., 1999; DeAngelis, 2001). Gliomas are highly invasive, and the microscopic infiltrative loci outside of tumor mass contribute to most of the tumor relapse after surgery (Tsatas and Kaye, 2003). It is well documented that glioma-released proteases, such as plasminogen activator (PA), matrix metalloproteinases (MMPs), and lysosomal cathepsins, play critical roles in glioma invasion (Levicar et al., 2003; Rao, 2003).
The role of the PA/plasmin system in tumor growth, invasion, and angiogenesis has been widely studied (McMahon and Kwaan, 2008). The two distinct forms of PA, urokinase type PA (uPA) and tissue PA (tPA), convert the enzymatically inactive zymogen plasminogen into the active serine protease plasmin (Collen, 1999). Plasmin is a potent protease capable of direct breakdown of many extracellular matrix (ECM) components, including fibronectin, laminin, and proteoglycans. Plasmin also facilitates tumor invasion and angiogenesis (Danø et al., 1985; DeClerck et al., 1997; Mignatti and Rifkin, 1993) and can activate MMPs and growth factors, which contribute to ECM degradation and tumor expansion (Carmeliet et al., 1997; McColl et al., 2003).
Annexin A2 is a component of the (A2–p11) cell surface complex that binds both tPA and plasminogen on several cell types. The heterotetrameric complex brings the two ligands into close spatial proximity, thereby increasing the catalytic efficiency of tPA-dependent activation of plasminogen and also protecting them from their inhibitors (Hajjar et al., 1994; Kwon et al., 2005; Dassah et al., 2009).
Annexin A2 is overexpressed in many tumors, including breast cancer, pancreatic cancer, and gliomas (Reeves et al., 1992; Díaz et al., 2004; Sharma et al., 2006; Bao et al., 2009; Ohno et al., 2009), and has emerged as an attractive candidate receptor for increased plasmin generation on the tumor cell surface (Díaz et al., 2004; Sharma et al., 2006). However, most of these studies have been performed in cell culture systems, and little is known about the subsequent effects of annexin A2 manipulation on tumor development in vivo.
Recent studies showing the localization of annexin A2 in the pseudopodia of invasive glioma cells (Beckner et al., 2005) and the decreased migratory ability of human glioma cells during annexin A2 knockdown (Tatenhorst et al., 2006) make this protein an interesting candidate for targeted therapy for glioma patients. In this study, we used two rodent glioma cell lines, GL261–EGFP and C6/LacZ, and annexin A2 knockdown (annA2KD) clones to study the effects of annexin A2 on glioma migration, proliferation, apoptosis, invasion, and angiogenesis in vivo. We showed that reduced annexin A2 expression in glioma cells slowed glioma progression by inhibiting tumor invasion and angiogenesis. These data suggest that modulation of tumor-related protease activity may lead to new strategies in glioma therapy.
Materials and Methods
Cell lines.
GL261, a chemically induced glioma cell line from C57BL/6 mice, and CRL-2541, a mouse astrocyte cell line, were obtained from American Type Culture Collection. Both cell line were cultured in DMEM with 10% heat-inactivated fetal bovine serum (FBS) and 1 mm sodium pyruvate (Fisher Mediatech). The GL261 cells were transfected with pEGFP–N1 using Lipofectamine (Invitrogen) and then selected with 500 μg/ml neomycin (Geneticin; Invitrogen) to generate the stable cell lines GL261–EGFP. Then GL261–EGFP cells were transfected with an RNAi construct, pSuper/blast-annA2i, which targets sequences 148–166 and 692–710 of the mouse annexin A2 mRNA open reading frame. Positive transfectants were selected with 10 μg/ml blasticidin (InvivoGen) and 500 μg/ml neomycin, and the stable cell lines GL261–EGFP–annA2KD showing decreased expression of annexin A2 were generated and confirmed by Western blot.
C6 rat glioma cells (Benda et al., 1968) were purchased from American Type Culture Collection (C6; catalog #CCL-107) and propagated as described in DMEM without pyruvate but containing 10% FBS, 2 mm l-glutamine, 100 U/ml penicillin, 100 μg/ml streptomycin, and 0.25 μg/ml amphotericin B (Benda et al., 1968; Amberger et al., 1998). C6 glioma cells bearing the Escherichia coli LacZ gene and the Tn5 neomycin resistance cassette (C6/LacZ; catalog #CRL-2199; American Type Culture Collection) were provided by Dr. Myrna Rosenfeld (Department of Neurology, University of Arkansas Medical Center, Little Rock, AR) (Lampson et al., 1992, 1993) and propagated in the same medium supplemented with 100 mm sodium pyruvate.
Annexin A2 sense- and antisense-transfected cells.
To prepare a full-length sense annexin A2 construct (Huang et al., 1986) in the pcDNA3.1/Hygro(+) plasmid, a 1011 bp BamHI–XhoI fragment of the human annexin A2 cDNA was excised from pBluescript KS+ (Hajjar et al., 1994) and subcloned in the sense orientation into the BamHI–XhoI sites of the pcDNA3.1/Hygro(+) expression vector (Invitrogen). Because the human and rat coding sequences are 90% identical at the nucleotide level (Huang et al., 1986; Upton and Moss, 1994), the use of a human construct introduces only 102 of 1030 (10%) nucleotide substitutions. To create the pcDNA3.1/Hygro(+) antisense vector, the same fragment was subcloned into KpnI and XhoI sites in the antisense orientation. The integrity of both constructs was verified by sequencing in both directions.
β-Galactosidase-expressing C6 cells were transferred to six-well plates (4 × 10⁵ cells per well, 18 h), transfected in serum-free DMEM with SuperFect (Qiagen) containing 3.5 μg of sense or antisense pcDNA3.1/Hygro(+) vector (3 h), washed, fed with complete medium, and allowed to recover for 48 h. Transfected cells were then selected in hygromycin B (15 d, 500 μg/ml), cloned by limiting dilution, and propagated into individual cell lines. Expression of β-galactosidase was assessed by incubating subclones of glutaraldehyde-fixed (0.25%, 15 min, 37°C), adherent, sense- and antisense-transfected cells in a buffer consisting of 1 mm MgCl2, 150 mm NaCl, 3.3 mm K4Fe(CN)6, 3.3 mm K3Fe(CN)6, 60 mm Na2HPO4, and 40 mm NaH2PO4, containing 2% (w/v) 5-bromo-4-chloro-3-indolyl-β-d-galactopyranoside (X-gal) (24 h, 37°C). Typically, ∼95% of cells in a given subclone were positive for β-galactosidase activity.
Sense- and antisense-transfected cells were enumerated manually in a double-blind manner using a hemocytometer. Cell proliferation was also estimated immunocytochemically by incorporation of 5-bromo-2-deoxyuridine (BrdU) using a fluorescein-conjugated monoclonal antibody (Roche Diagnostics).
Membrane-bound tPA activity.
Membrane proteins from the GL261–EGFP and GL261–EGFP–annA2KD cells were extracted (Díaz et al., 2004). Briefly, confluent cells were lysed in buffer I (20 mm Tris HCl, pH 6.8, 3 mm MgCl2, 50 mm NaCl, 300 mm sucrose, and 1% Triton X-100) without protease inhibitors. After centrifugation (13,000 × g), the supernatants containing cytoplasmic proteins were transferred to new tubes, and the pellets containing membrane proteins were dissolved in buffer II (50 mm Tris HCl, pH 8, 150 mm NaCl, 1% NP-40, and 10 mm EGTA). Then the protein concentrations were measured by the Bio-Rad Bradford detergent-compatible (DC) assay.
To measure tPA activity, an amidolytic assay was used following an established protocol (Nolin et al., 2008). Duplicate protein samples (25 μl) were added to the reaction mixture containing plasminogen, S-2251 (a chromogenic plasmin substrate), and amiloride (a uPA inhibitor). The rate of plasmin formation is measured at 405 nm after incubation for 2 h at room temperature; the spectrophotometric signal is directly proportional to plasmin activity. Different amounts of recombinant tPA (Genentech) were used to generate a standard curve. tPA activity in each sample was calculated based on the standard curve and normalized to the total protein in each sample. The experiments were repeated three times.
Radioligand binding assays.
Plasminogen and tPA were radiolabeled according to the lactoperoxidase method (Martin et al., 1976). Binding assays were conducted as described previously (Hajjar et al., 1986, 1987).
Scratch-migration assay.
GL261–EGFP, GL261–EGFP–annA2KD, and CRL-2541 cells were seeded in triplicate on 60 mm culture dishes at 1.5 × 10⁶ cells per dish. Forty-eight hours after plating, the cells reached 80% confluence. A vertical scratch through the plate was made gently using a pipette tip. After washing with PBS, the cells were incubated in DMEM containing 10% FBS for an additional 24 h. Migrated cells were defined as cells that moved into the scratch and detached away from the cell monolayer. Cell migration was evaluated by counting the total number of migrated cells within three random fields between the scratch edges on each plate (Wesolowska et al., 2008). Each experiment was repeated three times. To evaluate the direction of migrating cells, cells were stained with rhodamine-conjugated phalloidin (1:200; Invitrogen) and anti-annexin A2 IgG (BD Transduction Laboratories) to evaluate bundling of actin filaments. To evaluate the expression and localization of tPA and annexin A2 on the surface of migrating cells, cells were stained with antibodies directed against tPA (Santa Cruz Biotechnology) and annexin A2.
In vitro migration assays through ECM substrates.
Invasion assays were conducted using porous tissue culture inserts (25 mm polycarbonate membrane, 8 μm pore size; BD Biosciences Discovery Labware) coated (21°C, 60 min) with collagen I (200 μg/ml) or laminin (from Engelbreth–Holm–Swarm mouse tumors; A, B1, B2 chains; 100 μg/ml) (Repesh, 1989; Rosenthal et al., 1998). C6 cells were harvested with trypsin–EDTA, washed, resuspended in 5% FBS-containing DMEM, and plated at a density of 4 × 10⁴ cells per well. All inserts were placed for 12 h (37°C) in 12-well plates containing medium preconditioned by C6 glioma cells for 48 h (Repesh, 1989). After cells on the upper surface were removed by gentle scraping, the membranes were fixed in 100% methanol (−20°C, 15 min), stained with hematoxylin (50%, 21°C, 5 min), and mounted in Permount. Cells that migrated to the under surface were counted at 200× by two observers in a double-blind manner.
In vivo mouse glioma model.
Wild-type mice, 12–16 weeks of age C57BL/6 (wt), were purchased from The Jackson Laboratory. Annexin A2-null (annA2KO) mice on the C57BL/6 background (K.A.H.) were also used. All animal procedures were approved by the Stony Brook University Institutional Animal Care and Use Committee. Mice were bred in-house under maximum isolation conditions on a 12 h light/dark cycle with food ad libitum. Mice were anesthetized with atropine (0.6 mg/kg, i.p.) and 2.5% Avertin (0.02 mg/g, i.p.), and then a midline incision was made on the scalp. At stereotactic coordinates of bregma, −1 mm anteroposterior and +2 mm mediolateral, a small burr hole was drilled in the skull. GL261–EGFP or GL261–EGFP–annA2KD cells (3 × 10⁴) were delivered in 1 μl of PBS at a depth of 3 mm over 2 min (El Andaloussi et al., 2006). After the needle was withdrawn, the incision was sutured and the mice were placed on a heated surface until fully recovered from anesthesia.
Tumor evaluation.
For each time point, mice were deeply anesthetized with 2.5% Avertin and transcardially perfused with 50 ml of PBS followed by 50 ml of 4% paraformaldehyde (PFA) in PBS. The brains were removed and postfixed in 4% PFA/PBS for 6 h at 4°C, followed by 30% sucrose at 4°C until fully dehydrated. The brains were then frozen embedded in optimal cutting temperature compound (Tissue-Tek) and sectioned using a Leica cryostat. A series of 10–15 25 μm coronal sections encompassing the entire tumor was generated for each animal.
To measure tumor size, random serial sections were selected from each animal, and the GFP-positive tumor area was measured using NIS-Elements software. Tumor volume was calculated as tumor area × section thickness × number of sections.
To quantify tumor invasion, five sections from each of five randomly chosen samples were captured under the fluorescent microscope. The invasive front of the tumor was defined as the area in which isolated GFP-positive glioma cells were found mixed with surrounding normal brain tissue or in which gliomas showed pseudopodia-like structures. To evaluate tumor invasion, we used two parameters, maximal invasion distance and percentage of invasion (invasive area/total tumor area × 100) (Guillamo et al., 2009).
To evaluate tumor angiogenesis, five sections from each of five randomly chosen samples were labeled with immunofluorescent tomato lectin (Sigma; endothelial cells and microglia/macrophage marker) and CD45 antibody (BD Pharmingen; macrophage marker). Blood vessels were identified based on lectin-positive, CD45-negative staining and morphology. The samples were first screened at lower magnification (10×) to find angiogenic “hotspots” with high vascular density, in which blood vessel number and diameter were quantified with NIS-Elements software under higher magnification (20×) (Pistolesi et al., 2004; Campa et al., 2008).
Brain sections were also immunostained with Ki67 antibody (Abcam) and phospho-histone H3 (p-histone H3) antibody (Cell Signaling Technology) to screen for proliferation and with activated caspase-3 antibody (Sigma) to identify apoptotic cells. Apoptosis was confirmed by TUNEL assay using the ApopTag red in situ apoptosis detection kit (Millipore), according to the protocol of the manufacturer. For quantification, five randomly selected samples per group were used, and at least 15 fields in different sections of the same sample were captured by confocal microscopy.
In vivo rat glioma model.
To perform quantitative analyses of tumor infiltration in brain, a rat model of tumor implantation was used (Lampson et al., 1992, 1993). All studies were approved by the Institutional Animal Care and Use Committee of Weill Cornell Medical Center. Sasco-Fisher male rats (∼250 g; Charles River) were anesthetized with ketamine (90 mg/kg, i.p.) and xylazine (4 mg/kg, i.p.). Stably transfected C6/LacZ cells (4 × 10⁶ cells/ml sterile PBS) were maintained on ice. For each rat, a small midline sagittal incision was made, and a 2-mm-diameter burr hole created stereotactically 2.5 mm lateral to the midline at bregma and to a depth of 6 mm below the dural surface. Stably transfected C6/LacZ cells (2 × 10⁴ in 5 μl of sterile PBS) were delivered into the right caudate–putamen using a 25 gauge Hamilton syringe and stereotactic frame (injection rate, 1 μl/min; David Kopf Instruments) (San-Galli et al., 1989; Meneses et al., 1999). As assessed by trypan blue exclusion, cells maintained 99% viability at the end of the procedure.
Either sense- or antisense-transfected cells were implanted into a total of seven or eight rats in each of three separate experiments. All injected animals survived until they were killed on day 14. Tumors were identified in 17 of 21 animals (78.0 ± 6.3%, n = 3), 9 of 11 receiving antisense-transfected and 8 of 10 receiving sense-transfected cells. After the animals were killed with pentobarbital (100 mg/kg, i.p.) followed by extensive perfusion with 4% paraformaldehyde (Lampson et al., 1992), brains were removed, incubated in 30% sucrose (18 h, w/v; PBS), and frozen over liquid N2 (Meneses et al., 1999).
For analysis of tumor dissemination, coronal cryosections (9 μm) were stained with Mayer's modified hematoxylin (100%, 2 min) at 150 μm intervals. Intervening sections, fixed in glutaraldehyde (0.25%, 37°C, 15 min), washed eight times with PBS, and incubated with X-gal substrate in a humidified chamber (37°C, 6–24 h). To distinguish between intrinsic eukaryotic and transfected β-galactosidase activity, all staining reactions were performed at pH 7.4 (Pederson et al., 1995). For each brain, the section containing maximal tumor cross-sectional area, as judged by β-galactosidase staining, was chosen for quantitative digital image analysis (Lampson et al., 1993). The section was imaged in its entirety using an Axiovert 35 light microscope (Carl Zeiss) equipped with a digital camera (Sensys; Roper Scientific) and RGB filter (Microcolor). Areas occupied by primary and disseminated tumor foci were outlined in a blinded manner using a preselected cutoff, and images acquired and digitized via MetaMorph (Molecular Devices). The sum of all areas of tumor, not contiguous with the primary tumor, were recorded (Lampson et al., 1993).
Analysis of human tumors.
A pilot study of annexin A2 expression in human glioma tissues was performed. Nine patients with primary glioma who underwent surgical resection from 2000 to 2009 at the Stony Brook University Medical Center (Stony Brook, NY) were selected. Patient clinical information was provided by the Cancer Registry of Stony Brook University Medical Center, which reported data about patient age, sex, treatment, tumor recurrence, and survival. Use of archival surgical pathology specimens for immunohistochemical studies (Committees on Research Involving Human Subjects protocol 94651) was approved by the Institution Review Board of Stony Brook University Medical Center. Representative tissue blocks from each case were assembled from the archival collections from Department of Pathology and were graded according to World Health Organization standards, as grade I (pilocytic astrocytoma, three cases), grade II (one case), grade III (anaplastic astrocytoma, one case), and grade IV (GBM, four cases) tumors.
Five-micrometer, Formalin-fixed, paraffin-embedded tissue sections were deparaffinized in xylenes and graded alcohol solutions, and antigen retrieval was performed in citrate buffer (20 mmol/L, pH 6.0) at 120°C for 10 min. After treatment with 3% H2O2 for 5 min to quench endogenous peroxidase activity, sections were incubated with blocking serum (Vectastain Elite ABC kit; Vector Laboratories), blotted, and incubated (1 h, room temperature) with non-immune mouse IgG (1:200; Zymed Laboratories) or monoclonal mouse antibody against annexin A2 (1:200; Zymed Laboratories). After washing with Tris-buffered saline plus Tween 20 for 5 min, sections were incubated with biotinylated universal secondary antibody (Vectastain Elite) at room temperature for 30 min, followed by incubation with avidin/biotin enzyme complex (Vectastain Elite) for 30 min. Annexin A2 staining was visualized by using 3,3′-diaminobenzamidine tetrahydrochloride (Dako), and then sections were counterstained with hematoxylin, cleared, and mounted with glass coverslips. Pictures of five randomly selected fields from each case were taken using NIS-Elements software. The intensity of annexin A2 staining was quantified with the NIH Image J with color-deconvolution plugin, which removed the color of hematoxylin staining. The overall immunohistochemistry intensity was normalized to the total area.
Statistical analyses.
The statistical significance between two groups was determined using Student's t test. For comparison of more than two groups, one-way ANOVA followed by a Bonferroni–Dunn test was used. The Kaplan–Meier survival curve was calculated with MedCalc software. Data were expressed as mean ± SEM. The statistical significance is either described in the figure legends or indicated with asterisks: *p < 0.05; **p < 0.01; ***p < 0.001.
Results
Knockdown of annexin A2 in glioma cells decreases membrane-bound tPA activity
We used GL261, a mouse astrocytoma cell line, to investigate glioma progression. Annexin A2 and plasminogen were expressed at higher levels in the GL261 glioma cells than in control mouse astrocytic or microglial cell lines or primary astrocytes (Fig. 1A). tPA was also expressed in GL261, and its enzymatic activity could be detected both intracellularly and in the GL261 medium, as it got secreted from the cells (Fig. 1B). Immunofluorescent staining of the GL261 cell surface revealed colocalization of tPA and annexin A2 primarily in pseudopodia-like structures (Fig. 1C). We generated a stable, GFP-expressing cell line, GL261–EGFP, as described previously (Zhai et al., 2011), and then knocked down annexin A2 expression using stably transfected shRNA, selecting three clones for subsequent experiments. As shown in Figure 1, C and D, annexin A2 was abundantly expressed in GL261–EGFP cells but reduced to 20.0, 19.2, and 9.9% of wild-type GL261–EGFP in GL261–EGFP–annA2KD clones 2, 3, and 4, respectively. Knockdown of annexin A2 by shRNA did not affect proliferation of the cell lines (Fig. 1F).
Figure 1.
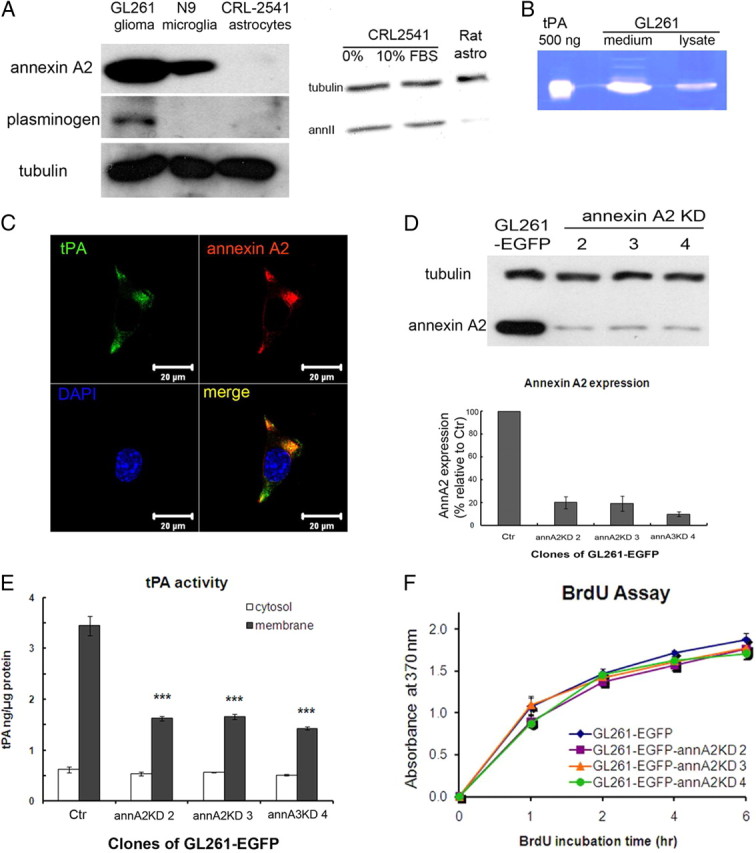
GL261 expresses tPA, plasminogen, and annexin A2, and knockdown of annexin A2 expression in glioma cells decreases membrane-bound tPA activity. A, Left, Annexin A2 and plasminogen expression was detected by Western blot. Annexin A2 is overexpressed in GL261 compared with microglia and astrocytes. Plasminogen is expressed by GL261 but not microglia or astrocytes. Right, Expression of annexin A2 in control CRL2541 cells and primary rat astrocytes. Thirty micrograms of protein extracts were loaded on each lane, and the exposure time was 10 min. Note that the expression in rat cells is very low. B, Zymography of GL261 lysate (10 μg) and conditioned medium (20 μl) shows that tPA is expressed and secreted by GL261. C, Immunofluorescent staining of GL261 cell membrane with tPA and annexin A2 antibodies showed colocalization of these two proteins. D, Annexin A2 expression levels for GL261–EGFP and GL261–EGFP–annA2KD clones were evaluated by Western blot and normalized to α-tubulin levels. E, An amidolytic assay was used to measure tPA activity in membrane and cytoplasmic protein fractions of GL261–EGFP clones. F, GL261–EGFP–annA2KD clones had similar proliferation rate as GL261–EGFP. The cell proliferation rate was measured by BrdU incorporation rate (n = 3).
Because annexin A2 is a key component of a surface receptor for tPA and plasminogen on endothelial and cancer cells (Hajjar et al., 1994; Díaz et al., 2004; Sharma et al., 2006), we next examined whether knockdown of annexin A2 would reduce the level of tPA/plasminogen on the glioma cell surface. Using a quantitative amidolytic assay, we found that ∼85% of the detectable cellular tPA activity was associated with the membrane fraction of control glioma cells. In contrast, decreased expression of annexin A2 reduced the level of membrane-associated tPA activity by 52–58.5%, whereas tPA activity in the cytoplasmic fraction remained unchanged (Fig. 1E).
C6 rat glioma cells were used in parallel to generalize the findings. The cells express annexin A2, as documented using immunofluorescence, flow cytometric analysis, and immunoblotting (Fig. 2A,B,E). Moreover, [125I]plasminogen could be shown to bind to the C6 glioma cells in a dose-dependent manner that plateaued at an input concentration of 200 nm (Fig. 2C). Similarly, [125I]tPA showed saturable-specific binding to C6 glioma cells with a Kd of 34 ± 9 nm (Fig. 2D). Approximately 80% of tPA binding was inhibited in the presence of a 50-fold excess of unlabeled tPA. These data indicated that both plasminogen and tPA bound to C6 cells in a saturable and specific manner, establishing a mechanism through which plasmin could be generated locally at the cell surface.
Figure 2.
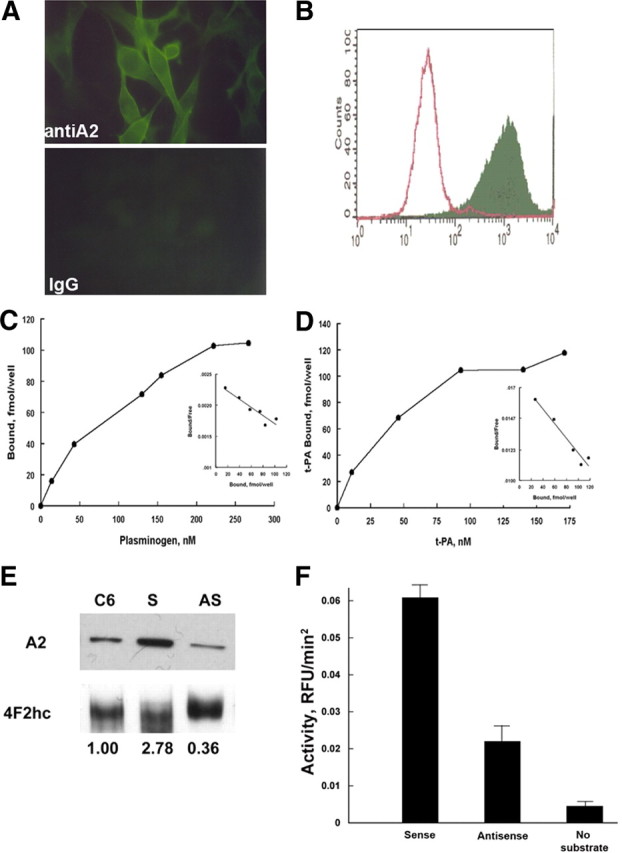
C6 glioma cells express annexin A2. A, Immunofluorescence. C6 glioma cells, propagated on chamber slides, were fixed in methanol (5 min, −20°C), blocked with 0.2% BSA in PBS (10 min, 21°C), and incubated with either mouse monoclonal anti-A2 (Zymed Laboratories; 1:100, 72 h, 4°C; top panel) or non-immune isotype-matched IgG (Zymed Laboratories; 1:100, 72 h, 4°C; bottom panel). After two washes in PBS, primary antibody reactivity was detected with FITC-labeled goat anti-mouse IgG (1:250, 60 min, 21°C). B, Flow cytometric analyses. C6 cells were incubated with polyclonal pre-immune (open peak) or anti–annexin A2 IgG (solid peak) (70 μg/ml, 4°C, 60 min) followed by fluorescein isothiocyanate-conjugated goat anti-rabbit IgG (30 μg/ml, 4°C, 30 min; Cappel Laboratories), fixed in 2% paraformaldehyde (2 min, 21°C), and analyzed in a BD Biosciences flow cytometer (FACS Calibur). C6 glioma cells propagated in 24-well tissue culture plates were incubated with [125I]plasminogen (24,900 cpm/pmol) (C) or [125I]t-PA (503,000 cpm/pmol) in HBS containing 3 mm CaCl2, 1 mm MgCl2, and 5 mg/dl BSA (200 μl/well, 4°C, 60 min) over a range of concentrations (0–267 and 0–174 nm, respectively) (D). After sampling unbound ligand, cells were washed and solubilized, and bound radioactivity was counted. Scatchard analyses were performed as described previously (insets). E, Characterization of annexin A2 expression in stably transfected C6/LacZ glioma cells. Whole-cell lysates from annexin A2 sense- and antisense-transfected C6/LacZ cells were immunoblotted with monoclonal anti-annexin A2 IgG or polyclonal anti-4F2hc (21°C, 60 min) (Jacovina et al., 2001), using enhanced chemiluminescence (GE Healthcare). Annexin A2 expression was estimated after normalizing to the 4F2hc loading control using the Sigma gel scanning program (Jandel Scientific, version 1.0). F, Plasmin generation. Transfected C6/LacZ cells were incubated with plasminogen and t-PA, and plasmin generation was estimated as AFC-81 hydrolysis.
C6/LacZ cells stably transfected with sense and antisense annexin A2 constructs were assessed for cell growth changes. As in the mouse glioma line, decreased levels annexin A2 did not affect the proliferation or apoptosis rates of these cells (data not shown). However, we did note a 55 ± 8% (n = 4) decrease in tPA-dependent plasminogen activation on the surface of the C6 cells (Fig. 2F) that was comparable with that seen in the GL261–EGFP–annA2KD cells.
These results demonstrated that the annA2KD clones exhibit reduced tPA activity, suggesting that cell surface plasmin generation is also impaired, resulting in lowered matrix-degrading potential.
Knockdown of annexin A2 decreases glioma migration in culture
Decreasing annexin A2 expression reduces migration of the human glioma cells U87MG and U373MG in vitro (Tatenhorst et al., 2006). In agreement with this report, we found, using scratch-motility/migration assays, that annA2KD clones display significantly reduced motility/migration activity (Fig. 3A,B). Because BrdU incorporation had revealed that these clones proliferated at rates similar to those of wild-type cells (Fig. 1F), the decreased motility/migration by the annA2KD cell lines cannot be attributed to differences in cell numbers.
Figure 3.
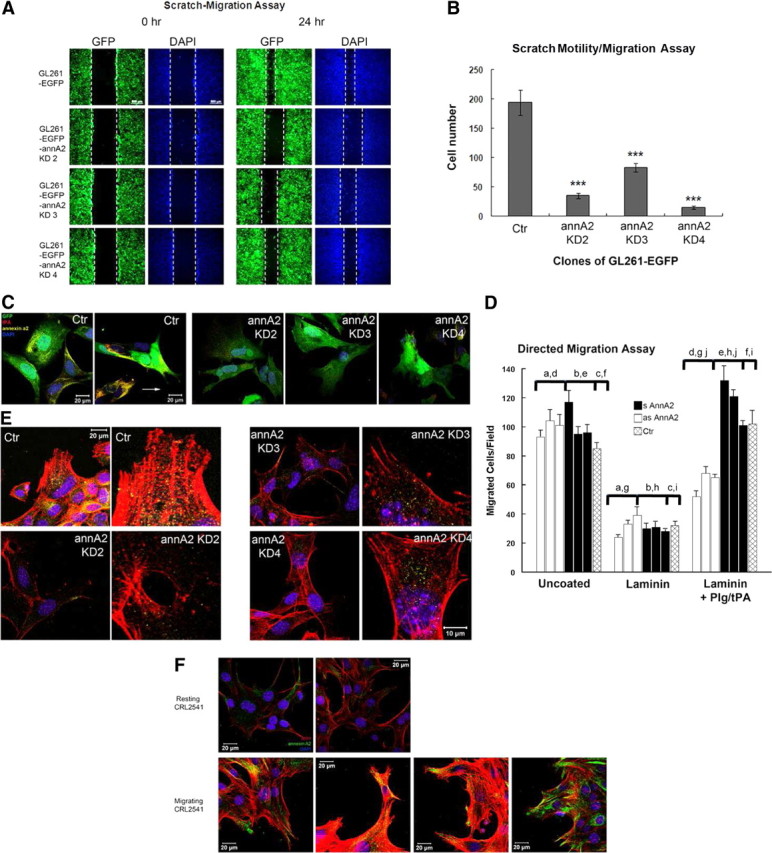
Knockdown of annexin A2 decreases glioma cell migration in culture. A scratch-migration assay was performed to evaluate cell migration. Representative images from each clone at 0 and 24 h are shown in A. White dashed lines indicate the edges of the scratch. B, Migrated cells between scratch edges in three random fields from each plate were enumerated (n = 3). C, The migrating cells were stained with antibodies against tPA and annexin A2 to examine their expression and colocalization. D, Directed migration. Three separate clones of annexin A2 antisense-transfected C6 cells (open bars), as well as annexin A2 sense-transfected C6 cells (filled bars) and nontransfected C6 cells (cross-hatched bars) were plated on laminin-coated porous filter inserts, incubated with plasminogen (100 nm) and t-PA (10 nm), and analyzed after 12 h as described in Materials and Methods. Shown are mean ± SE values for three separate experiments. Comparisons designated by a–d and g–j are all statistically significant at the p < 0.01 level. Comparisons e and f show no significant difference. GL261 cells (E) and resting or activated CRL2541 astrocytes (F) were labeled with rhodamine-conjugated phalloidin and stained with anti-annexin A2 to detect the morphology of actin filaments and the direction of migration. Blue, DAPI to visualize nuclei.
We next evaluated whether tPA and annexin A2 interact on the surface of migrating glioma cells by staining nonpermeabilized cells with antibodies against both molecules (Fig. 3C). In control GL261–EGFP cells, annexin A2 and tPA colocalized with each other on pseudopodia-like structures that extended in the direction of migration. In the annA2KD group, however, expression of both molecules was decreased and did not concentrate on pseudopodia-like structures.
To further explore the mechanism of reduced migration in annA2KD glioma cells, we performed two sets of experiments. First, leupeptin, a serine and cysteine protease inhibitor, was added to the scratch-motility/migration culture medium at the beginning of the assay, but no effect on GL261 motility was observed over the subsequent 24 h (data not shown); this result indicated that the mechanism underlying the reduced motility was unrelated to proteolysis. Conversely, when the C6 glioma cells were plated on filters that had been coated with collagen I or laminin, migration was dependent on proteolytic activity: directed migration to the undersurface in response to conditioned medium was strikingly enhanced in the presence of plasminogen and tPA (Table 1). Both collagen I and laminin constituted an effective barrier to directed C6 cell migration, blocking ∼64% of migration in response to C6 cell conditioned medium. This blockade was overcome during addition of plasminogen and tPA to the culture medium, establishing that migration was proteolysis dependent. In the presence of anti-annexin A2 IgG, but not anti-annexin A1 IgG, plasminogen/tPA-mediated migration was inhibited to the level seen in the absence of any matrix barrier. Migration was also blocked completely by the plasmin inhibitors leupeptin and α2-plasmin inhibitor. ε-Aminocaproic acid, an agent that prevents the association of plasminogen with annexin A2, was equally as effective as anti-annexin A2 and blocked ∼65% of migration. Addition of a neutralizing IgG directed against tPA was also highly effective in blocking 58% of migration, whereas amiloride, a selective uPA inhibitor, blocked only 30%. Interestingly, anti-tPA IgG and amiloride together blocked 87% of C6 cell migration. Three MMP inhibitors, finally, o-phenanthroline, TIMP-1, and TIMP-2, each had little or no effect on C6 cell-directed migration.
Table 1.
Effect of inhibitors on plasmin-dependent C6 glioma cell-directed migration
| Condition | % of control (Lam/P/t or Col/P/t) |
|---|---|
| Uncoated | 1.0 |
| Collagen I | 1.0 |
| Col/P/t | 100.0 |
| Col/P/t + anti-annA1 | 104.3 |
| Col/P/t + anti-annA2 | 41.5 |
| Lam | 1.0 |
| Lam/P/t | 100.0 |
| Lam/P/t + anti-annA1 | 134.7 |
| Lam/P/t + anti-annA2 | 45.9 |
| Lam/P/t + Leup, 150 μm | 10.1 |
| Lam/P/t + α2-PL, 500 nm | 8.2 |
| Lam/P/t + EACA, 10 mm | 46.0 |
| Lam/P/t + anti-tPA, 100 nm | 42.0 |
| Lam/P/t + Amil, 200 μm | 70.0 |
| Lam/P/t + Amil + anti-tPA | 12.9 |
| Lam/P/t + o-Phen, 200 μg/ml | 90.0 |
| Lam/P/t + TIMP1, 2 μg/ml | 112.3 |
| Lam/P/t + TIMP2, 2 μg/ml | 108.6 |
C6 glioma cells were plated on laminin- or collagen I-coated porous filter inserts and incubated, as described, with or without plasminogen and tPA, and with or without monoclonal anti-annexin A2, anti-annexin A1 IgG (50 μg/ml), or other inhibitors. n = 3–4. Col, Collagen; P, plasminogen; t, tPA; Lam, laminin; Leup, leupeptin; α2-PL, α2 anti-plasmin; EACA, ϵ-aminocaproic acid; Amil, amiloride; o-Phen, o-phenanthroline.
However, whereas parental C6 cells and the three lines of sense-transfected C6 cells (Fig. 3D, black bars) were able to breach the laminin barrier in the presence of plasminogen and tPA, all three antisense-transfected C6 cell lines (Fig. 3D, white bars) exhibited very limited ability to do so, indicating that C6 cells that express low levels of annexin A2 demonstrate impaired ability to traverse a laminin barrier.
One possible mechanism to explain these findings would be that the cell migration in the scratch assay was mediated by annexin A2/actin filament interactions. We therefore stained migrating cells with antibody to detect annexin A2 (yellow) and phalloidin (red) to visualize F-actin (Fig. 3E). In wild-type (Ctr) cells, the actin filaments bundled in the direction of migration, and annexin A2 was concentrated at the base of the actin filaments, indicating that annexin A2 may be involved in determining the direction of migration. In the annexin A2-depleted glioma cells, there was a decrease in actin bundling and no obvious colocalization/concentration of annexin A2 in the migrating cells. Similar results were also observed in CRL-2541 astrocytes (Fig. 3F). In resting astrocytes, the expression level of annexin A2 was very low. During activation by scratch wound, the migrating reactive astrocytes exhibited significant actin bundling as well as upregulation and enrichment of annexin A2 around actin filaments. These results suggest that the knockdown of annexin A2 may affect bundling of actin filaments, thereby reducing the migratory activity of glioma cells.
Knockdown of annexin A2 on glioma cells reduces glioma progression in vivo
We examined the effects of annA2KD on glioma growth in vivo. Equal numbers of GL261–EGFP and GL261—EGFP–annA2KD clone 4 cells were injected into mouse brains. Clone 4 was selected for these experiments because it exhibited the lowest annexin A2 expression. Tumor volume was measured on days 10, 15, and 20 (Fig. 4A). We found that glioma size in the annA2KD group was significantly reduced (54.5% decreased) compared with the wild-type group at day 20. We also injected wild-type and annA2KD cells into annA2KO mice and found that tumor volumes were similar to those observed for each cell line in wt mice (Fig. 4C), indicating that potential annexin A2 expression by tumor stromal cells has no effect on glioma growth.
Figure 4.

Knockdown of annexin A2 on glioma cell impairs tumor progression in vivo, but lack of annexin A2 in stromal cells has no effect on glioma growth. A, Tumor volumes were measured at 10, 15, and 20 d after tumor cell injection (n = 8, from 4 independent injections). B, Kaplan–Meier survival curves of tumor-bearing mice (p = 0.0003, n = 10). Tumor size (C) and MVD (D) were measured 15 d after tumor injection into wt and annA2KO mice (wt mice: tumor size, n = 8; MVD, n = 5; annA2 KO mice: n = 2).
We also followed body mass and host survival time as indices of glioma progression in tumor-bearing mice. On day 20, weight loss was less in the annA2KD group compared with the wild-type animals (95 vs 88% of day 0 weight; data not shown). By that time, the wild-type mice were very sick and beginning to die. Kaplan–Meier survival curves revealed that the annA2KD group survived significantly longer than the wild-type group (median survival time: wild-type group, 24 d; annA2KD group, 27.5 d; Fig. 4B), suggesting that the expression level of annexin A2 correlates with tumor invasiveness and overall prognosis. This hypothesis is consistent with previous immunohistochemistry studies of human glioma specimens (Reeves et al., 1992; Roseman et al., 1994).
Knockdown of annexin A2 decreases the proliferation index in glioma tissue
We investigated possible mechanisms for the smaller tumor size observed in the annA2KD group. Because annexin A2 has been reported to stimulate cancer cell proliferation in vitro (Huang et al., 2008; Bao et al., 2009; Zhang et al., 2009), we first evaluated the proliferation index in glioma samples by immunofluorescent staining with antibodies directed against Ki67 and p-histone H3. We quantified the number of proliferating cells in glioma tissue as well as GFP+ glioma cells. Ki67 is a marker for cells that are actively cycling (Allegranza et al., 1991), and we found that there were more Ki67+ cells in the wild-type tumors than in the annA2KD tumors, especially on days 10 and 20 (Fig. 5A,B,D) (see Fig. 7A). However, the number of Ki67+GFP+ cells was similar in both groups (Fig. 5C). These data were confirmed with p-histone H3 staining, which labeled all the mitotic cells (Fig. 5D) (see Fig. 7B) (Colman et al., 2006). As we saw with quantification of Ki67, there were more p-histone H3+ cells in the wild-type group on days 10 and 15 (Fig. 5E), whereas the number of p-histone H3+GFP+ cells was similar to that in the annA2KD group (Fig. 5F). Together, these data suggested that the decreased annexin A2 expression in glioma cells led to reduced proliferation of stromal cells but not glioma cells themselves. This result was also reflected in an in vitro BrdU incorporation assay (Fig. 1F). These data indicated that overexpression of annexin A2 in glioma cells may regulate the dynamics of the tumor microenvironment.
Figure 5.
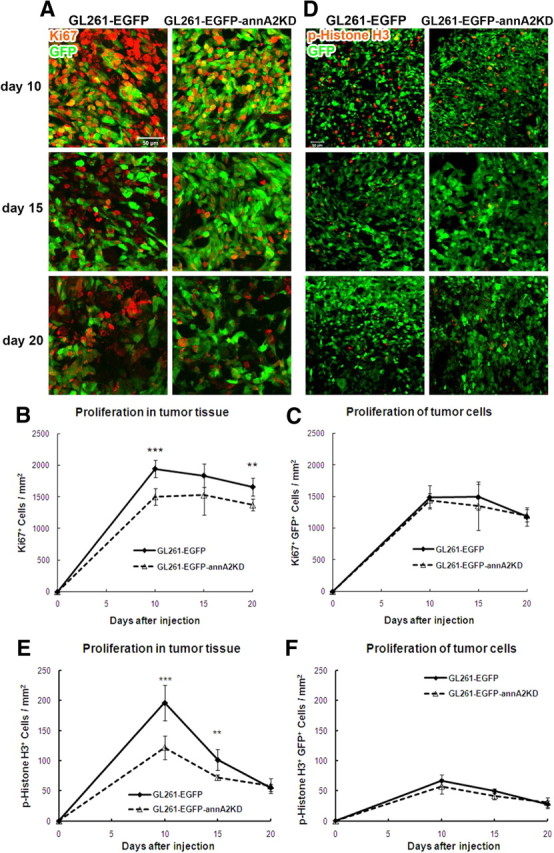
Animals receiving annA2KD glioma display less proliferation within the tumor tissue. Proliferation of tumor tissue and cells was quantified after Ki67 (A–C) and p-histone H3 (D–F) immunofluorescent staining (n = 5).
Figure 7.
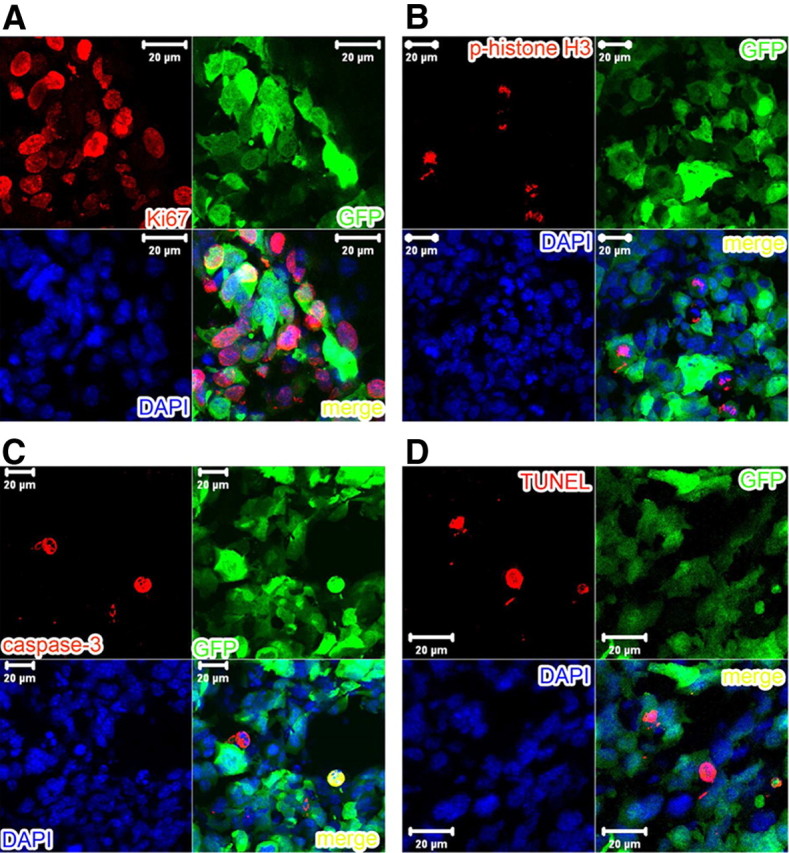
Higher-magnification pictures of immunofluorescent staining with Ki67 (A), p-histone H3 (B), and activated caspase-3 (C) antibodies as well as TUNEL assay (D) to demonstrate the cell specificity.
Knockdown of annexin A2 increases glioma apoptosis
We next evaluated apoptosis in glioma samples using immunofluorescent staining for activated caspase-3 antibody and the TUNEL assay. Caspase-3 is activated in apoptotic cells by caspase-8 and caspase-9 via extrinsic and intrinsic pathways (Salvesen, 2002). Staining of activated caspase-3 revealed that there were more apoptotic cells in tumor tissue and among GFP+ tumor cells in the annA2KD group than in the wild-type group at all time points (Figs. 6A–C, 7C). These findings were further confirmed by TUNEL assay, which marks DNA fragmentation in apoptotic cells (Figs. 6D, 7D) (Gavrieli et al., 1992). Quantification of TUNEL+ cells (all apoptotic cells, Fig. 6E) and TUNEL+GFP+ cells (apoptotic glioma cells, Fig. 6F) showed that, compared with the wild-type group, apoptosis was increased in both tumor tissue and tumor cells themselves in annA2KD glioma samples. This suggested that annexin A2 may regulate glioma growth by decreasing apoptosis.
Figure 6.
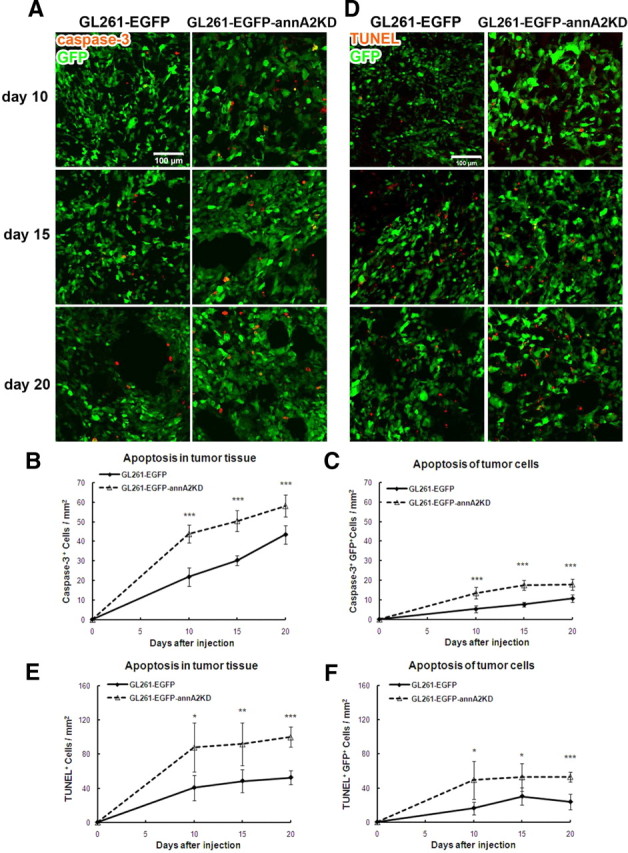
Knockdown of annexin A2 in glioma cells increases glioma apoptosis. The degree of apoptosis of tumor tissue and cells was quantified after activated caspase-3 immunofluorescent staining (A–C) and TUNEL assay (D–F) (n = 5).
Knockdown of annexin A2 decreases glioma invasion
The PA/plasminogen system plays an important role in tumor invasion, a key step in tumor growth (Rella et al., 1993; Stack et al., 1999; Díaz et al., 2004; Goh et al., 2005). Because annA2KD clones had decreased activity for membrane-bound tPA (Fig. 1E), we investigated whether annexin A2 could affect glioma invasion in vivo. To evaluate tumor invasion, we examined the both percentage of invasive area and the maximal invasion distance. Based on the morphology of GFP+ tumor area, the invasive areas were outlined and normalized to total tumor area (Fig. 8A). Quantification revealed that, on days 10 and 15, tumors in the wild-type group had significantly higher percentage of invasive areas than those in the annA2KD group (Fig. 8B). The difference between these two groups became smaller at day 20. This may be attributable to possible reversion of the GL261–EGFP–annA2KD cells to a wt phenotype after a certain period of time. When we incubated the GL261–EGFP–annA2KD4 cells without blasticidin selection for 20 d (to mimic the in vivo conditions), annexin A2 levels increased from 10 to 30% of wt at approximately day 10 and remained stable for the remaining 10 d. Such increase in annA2 expression levels may be the reason of the transient effects. Because of the very large difference in total tumor area, the tumors in the wild-type group were twice as large as those in the annA2KD group, which in turn made the percentage of invasive area relatively smaller. We noted that wild-type glioma cells invaded more distally from the tumor mass than the annA2KD glioma cells (Fig. 8C). In addition to the main invading fronts, diffuse infiltrating cells were also noted within the brain parenchyma for both the GL261–EGFP cells (Fig. 8D) and C6 glioma cells (data not shown), reminiscent of the invasive nature of human gliomas into the brain tissue. Similar findings have been reported in the literature (Eyüpoglu et al., 2005).
Figure 8.
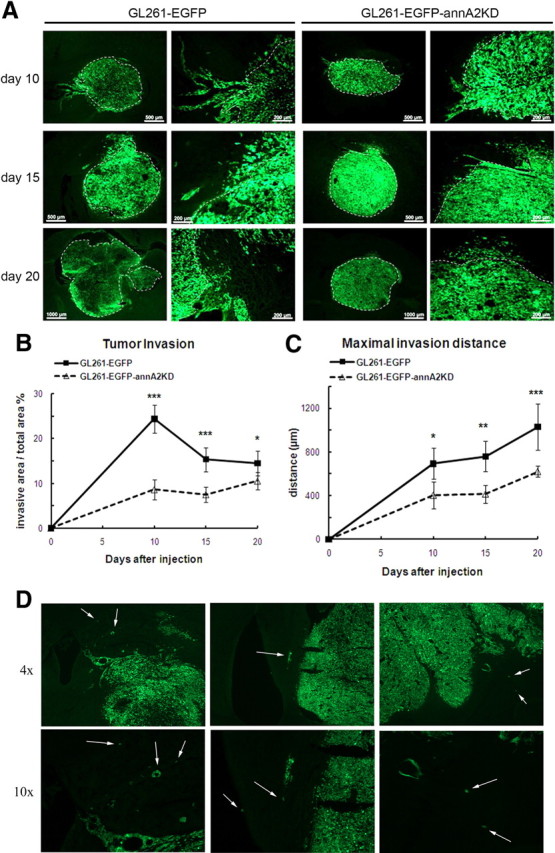
Knockdown of annexin A2 decreases glioma invasion in vivo. Tumor invasion was quantified by measuring the invasive front as a percentage of total tumor area (A, B) as well as maximal invasion distance (C) (n = 5). White dashed lines define the border between tumor mass and invasive area. D, Diffuse infiltration of glioma cells into the brain parenchyma. Arrows point to infiltrating tumor cells.
Because annexin A2 is a cell surface receptor for tenascin-C (Chung and Erickson, 1994; Chung et al., 1996), an important extracellular matrix molecule mediating cancer invasion (Deryugina and Bourdon, 1996; Jahkola et al., 1998; Hancox et al., 2009), we evaluated whether tenascin-C might used in this system to promote invasiveness. Our results indicated that the expression level of tenascin peaked at day 10 but quickly decreased thereafter. When comparing the fluorescent intensities, no obvious differences were found between the wild-type and annA2KD groups (data not shown).
In the C6 glioma model, we similarly observed a profound reduction in the maximal cross-sectional area occupied by disseminated tumor microfoci arising from antisense C6 primary tumors compared with those arising from sense C6 tumors (43 ± 3 vs 100 ± 10 μm2, n = 8 and 9, respectively; p < 0.001). Together, these results suggest that annexin A2 promotes glioma invasion, possibly through the PA/plasminogen system.
Knockdown of annexin A2 decreased glioma angiogenesis
The PA/plasminogen/annexin A2 system is known to promote neoangiogenesis, a critical step in cancer development (Stephens et al., 1998). In breast cancer, for example, annexin A2 expressed on the surface of invasive cancer cells correlated with cancer neovascularization (Sharma et al., 2010). Therefore, we further investigated whether annexin A2 might regulate angiogenesis in gliomas by measuring microvessel density (MVD) and blood vessel diameters. In the normal brain striatum, in which the tumor cells were injected, there were numerous small blood vessels (Fig. 9B, day 0) with an average diameter below 15 μm (data not shown). In the glioma tissue, MVD was lower than that of normal brain, but the blood vessel diameters increased over time as a result of blood vessel dilation and remodeling caused by glioma cells (Fig. 9B,C) (Winkler et al., 2009). When comparing the MVD of tumors from the wild-type and annA2KD groups, we found that wild-type tumors had significantly higher densities of microvessels than annA2KD tumors (Fig. 9A,B). Moreover, when MVD was sorted based on blood vessel diameter (small, <15 μm; intermediate, 15–50 μm; large, >50 μm), we found that the difference in MVD between the wild-type and annA2KD groups shifted from small to intermediate blood vessels (Fig. 9C), suggesting that annexin A2 may regulate glioma angiogenesis and affect patterning of tumor vasculature. MVD was also quantified in tumors from annA2KO mice but was found to be similar to that of wild-type mice (Fig. 4D), indicating that the regulation of angiogenesis by annexin A2 was tumor, rather than host, specific.
Figure 9.
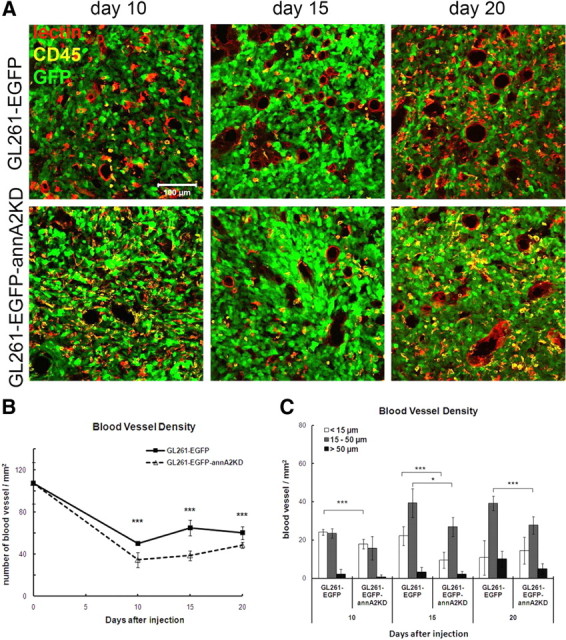
Knockdown of annexin A2 decreased glioma angiogenesis. A, The blood vessels were identified based on immunofluorescent staining of endothelial cells. B, MVD in glioma tissue was quantified by counting blood vessel number in twenty 20× fields. C, The blood vessel diameters were measured and used to sort MVD based on the sizes (n = 5).
Annexin A2 expression in human gliomas correlates with pathologic grade
Because previous research has shown that annexin A2 is expressed in gliomas (Reeves et al., 1992; Roseman et al., 1994; Nygaard et al., 1998), we performed a pilot study to examine human gliomas of various grades (Table 2) for evidence of annexin A2 expression (Fig. 10S). In normal control human cerebellum, the expression of annexin A2 was restricted to endothelial cells. In pilocytic astrocytomas (which are within the subcategory of astrocytomas defined by relative lack of infiltration), with biphasic features, stellate cells expressed minimal annexin A2, but the spindle cells were positive for annexin A2. In contrast, annexin A2 was expressed by most of the tumor cells in diffuse astrocytomas (grades II–IV). Of note, GBM cells displayed very high-level cytoplasmic/membrane expression of annexin A2 throughout the tumor and in association with blood vessels.
Table 2.
Clinical information for glioma patients from Stony Brook University Medical Center
| Case | Age | Sex | Diagnosis | Clinical follow-up duration | Outcome | Recurrence | Additional treatment |
|---|---|---|---|---|---|---|---|
| 1a | 10 | F | Pilocytic astrocytoma | 121 months | Alive | No | |
| 2 | 3 | M | Pilocytic astrocytoma | 108 months | Alive | No | |
| 3 | 4 | F | Pilocytic astrocytoma | 96 months | Alive | No | |
| 4 | 25 | F | Grade II astrocytoma | 120 months | Alive | No | |
| 5 | 59 | M | Glioblastoma multiforme | 18 months | Alive | No | Chemotherapy |
| 6 | 59 | M | Glioblastoma multiforme | 15 months | Alive | 12 months | Chemotherapy |
| 7 | 51 | F | Glioblastoma multiforme | 49 months | Deceased | 40 months, surgical resection; 3 months after second surgery | Chemotherapy |
| 8 | 57 | M | Glioblastoma multiforme | 13 months | Deceased | 10 months | |
| 9 | 68 | F | Anaplastic astrocytoma | 27 months | Deceased | 27 months |
aCase 1 is a recurrent pilocytic astrocytoma. The primary pilocytic astrocytoma underwent surgical resection 5 years before the tumor recurrence.
F, Female; M, male.
Figure 10.

Immunohistochemical localization of annexin in human gliomas. S (Stony Brook Cohort): A, normal cerebellum; B–D, grade I astrocytoma (pilocytic astrocytoma); E, grade II astrocytoma; F, grade III astrocytoma (anaplastic astrocytoma); G–J, Grade IV astrocytoma (GBM). Quantification of annA2 expression is shown below the panels (#p = 0.01). W (Weill Cornell Medical Center cohort): A, B, Placenta control; C, D, benign pilocytic astrocytoma (patient age, 2 years; sex, male); E, F, high-grade astrocytoma (patient age, 61 years; sex, male); G–L, highly invasive glioblastoma multiforme (G, H: patient age, 80 years: sex, female; I, J: patient age, 66 years; sex, male; K, L: patient age, 74 years; sex, female). Sections were stained with monoclonal anti-annexin A2 (A, C, E, G, I, K) or non-immune IgG (NI; B, D, F, H, J, L). Scale bar, 200 μm.
A second pilot study was performed in five cases (one pilocytic astrocytoma, one high-grade astrocytoma, and three GBM) from Weill Cornell Medical Center and showed similar results (Fig. 10W). These findings suggest that annexin A2 can be a useful biomarker for human gliomas.
Discussion
Cancer invasion is a complex process that includes adhesion of tumor cells to extracellular matrix proteins, proteolysis of extracellular matrix proteins by tumor-secreted proteases, and extracellular matrix remodeling (Zamecnik, 2005). Through these mechanisms, tumor cells create intercellular spaces for migration, an event that requires membrane synthesis and cytoskeletal rearrangements (Giese et al., 2003). During this process, overproduction of plasmin by the tumor cells and subsequent activation of other proteases, such as MMPs, results in localized degradation of ECM allowing tumor cell migration and invasion (McMahon and Kwaan, 2008).
Gliomas are highly infiltrative tumors that invade into and damage the surrounding normal brain tissue (Tsatas and Kaye, 2003). The overexpression of uPA, and proteins involved in its signaling pathway, have long been studied in the context of glioma invasion (Rao, 2003). However, little is known about the role of annexin A2, a cell surface receptor for tPA and plasminogen, in glioma invasion. Annexin A2 has been shown to be upregulated in many cancers, and its overexpression was found to be correlated to cancer invasion through the tPA/plasminogen system (Díaz et al., 2004; Sharma et al., 2006, 2010; Bao et al., 2009). A caveat of our study is that the mouse GL261 glioma model, although a “gold standard model for experimental glioma therapy” (Maes and Van Gool, 2011), does not mimic human glioblastoma in every respect. Although several of the mouse tumors depicted in Figure 8A appear to be well circumscribed, we do see areas of tumor cell extension beyond the main tumor margin, but these do not approach the extent of invasion seen in typical human tumors. In a study by Dai et al. (2001), two of the classic features of infiltrating human oligodendroglioma, perivascular and perineuronal invasion, were observed, but only at 12 weeks after tumor implantation. However, we feel that the GL261 model is valuable in examining the initial events in tumor invasion (10–20 d after implantation in our experiments). Our tumors were examined at relatively early time points. The C6 rat model we also used may more closely mimic human glioblastoma, because C6 typically exhibits “focal invasion into contiguous normal brain” and also harbors “changes in gene expression … similar to those reported in human gliomas” (Barth and Kaur, 2009). Interestingly, we found that attenuation of annexin A2 expression in this model also resulted in a dramatic reduction in disseminated tumor microfoci. We believe that the two gliomas used in our study represent approximations of the behavior of human gliomas and may have important relevance within the context of human glioblastoma infiltration, particularly at early stages that may set the stage for more extensive invasion at later time points.
In the pilot study of annexin A2 expression in human glioma specimens, we showed that diffuse astrocytomas (grades II–IV) had more annexin A2-positive cells and/or higher annexin A2 expression when compared with benign pilocytic astrocytoma, which have much less tumor infiltration. Other groups have reported elevated A2 expression in GBM compared with lower-grade anaplastic astrocytoma or astrocytoma (Reeves et al., 1992; Roseman et al., 1994; Iwadate et al., 2004), although in these reports the GBM samples were not stratified according to histologic subtype.
A recent, very large study, The Cancer Genome Atlas study (Verhaak et al., 2010), reported relatively little correlation between annexin A2 transcript levels and GBM subtype. However, this study did not, to our knowledge, compare annexin A2 transcript levels in GBM with those in less invasive forms of glioma. In addition, annA2 protein levels, which is what we examined, and those of its binding partner p11 might vary even if the transcript levels are unchanged as a result of potential variations in the rate of mRNA translation and protein stability. Our study shows that annA2 contributes to the invasive tumor behavior in two rodent models of astrocytic GBM. In the study by Verhaak et al., annA2 expression was higher in typical, rather than atypical, GBM subtypes, the former generally exhibiting mainly astrocytic features. In agreement with this, our findings also indicate high A2 expression in several examples of typical GBM. Therefore, it seems reasonable to hypothesize that annA2 may contribute to the invasive behavior of typical GBM in humans as well.
Our results indicated that glioma cells express and colocalize tPA and annexin A2 in cellular protrusions that resemble pseudopods. Moreover, knockdown of annexin A2 resulted in decreased tPA activity on the glioma cell plasma membrane. The decrease in PA activity in turn reduced the level of plasmin-related proteolytic activity at the tumor cell surface. In addition, on the surface of cancer cells, including breast cancer and gliomas, annexin A2 has been reported to serve as a receptor for cathepsin B, which also mediates cell surface proteolysis (Mai et al., 2000; Roshy et al., 2003). When we injected annA2KD glioma cells into rodent brain, we found that the lower expression of annexin A2 on glioma cells was associated with decreased tumor size and a less invasive phenotype in vivo. The mechanism by which annexin A2 might modulate the behavior and phenotype of invasive gliomas is not fully clarified; annexin A2 may facilitate glioma cell invasion via either the tPA/plasmin proteolytic system or by enhancement of the proangiogenic environment, or both. It has been well established that neoangiogenesis is essential to tumor development and that plasmin is a key component regulating angiogenesis through degradation of extracellular matrix proteins and activation of angiogenic growth factors and cytokines (Lijnen, 2001; Pepper, 2001). Annexin A2 has been shown to enable angiogenesis in vivo (Ling et al., 2004; Jacovina et al., 2009), and its overexpression in cancer correlates with the formation of neovasculature (Sharma et al., 2010).
Recent research on development of anti-angiogenic drugs for cancer also supports the essential role of annexin A2. For example, TM601, a synthetic form of the peptide chlorotoxin, is now being evaluated in clinical trials; TM601, which appears to inhibit tumor cell migration, invasion, and angiogenesis in vitro, targets annexin A2 in many cancers, including glioma, melanoma, pancreatic, prostate, and lung cancer (Soroceanu et al., 1999; Kesavan et al., 2010). In agreement with these results, our annA2KD gliomas displayed decreased angiogenesis, which was regulated by tumor-associated annexin A2. These data suggest that tumor-released proteases are essential for development of new blood vessels.
In addition to cell surface proteolysis, annexin A2 is also involved in cell transformation (Hayes et al., 2004). Annexin A2 is a Ca2+-dependent membrane-binding protein and exists either as a monomer or as a component of a heterotetrameric complex with S100A10 (Zobiack et al., 2001). The annexin A2 heterotetramer was found to localize on the cytoplasmic side of the cell membrane, in which it binds to actin filaments and modulates membrane organization and trafficking events (Kang et al., 1999; Hayes et al., 2004). In addition, annexin A2 is one of the major substrates of v-Src, which regulates cell motility and transformation, including actin dynamics, cytoskeleton rearrangement, and turnover of focal adhesions (Boschek et al., 1981; Meijne et al., 1997). v-Src phosphorylates annexin A2 at Tyr23, which inhibits the binding of the annexin A2 heterotetramer to actin filaments (Hubaishy et al., 1995). In fact, cell transformation as well as v-Src trafficking and membrane targeting appears to be absent in cells lacking annexin A2, suggesting that annexin A2 also functions as a regulator for v-Src (Hayes and Moss, 2009). Similarly, our results showed that the migrating reactive astrocytes had higher levels of annexin A2 when compared with resting astrocytes, which is consistent with previous reports (Eberhard et al., 1994). Moreover, annexin A2 was enriched around actin bundles, indicating that annexin A2 is involved in regulation of actin filament organization. Migrating glioma cells with depleted annexin A2 had reduced bundling of actin filaments, a possible mechanism for decreased migratory activity observed in annA2KD glioma cells. Moreover, because glioma cells can bind tPA and plasminogen on their surface and locally generate plasmin, the decreased cell surface- and annexin A2-associated targeted proteolytic activity is most likely necessary for the invasiveness of the glioma cells.
Several studies have shown that knockdown of annexin A2 in cancer cells inhibits cell proliferation in vitro (Huang et al., 2008; Bao et al., 2009; Zhang et al., 2009). Contrary to these data, our annA2KD glioma cells, whether derived from mouse GL261 or rat C6 cells, showed proliferation rates similar to that of wild-type cells both in vitro and in vivo. One possible reason for the discrepancy is that we used stable cell lines in this study, whereas most of the previous research used transient expression systems. During the selection of a stable cell line, poorly growing clones were likely eliminated, whereas the remaining clones replicated at a rate similar to that of wild-type cells. We conclude that the difference in tumor progression observed between wild-type and annA2KD groups was most likely attributable to differences in proteolysis rather than proliferation.
In annA2KD glioma samples, we found that there were fewer proliferating stromal cells but a higher rate of glioma cell apoptosis, possibly because of decreased tumor angiogenesis, which is essential for nutrient transport to tumor cells and tumor expansion (Pepper, 1997). Alternatively, it has been reported that annexin A2 is involved in cell cycle regulation (Chiang et al., 1993); dysregulation of the cell cycle could be another, probably indirect, mechanism contributing to the increased apoptosis in annA2KD tumors.
Together, our data demonstrate that annexin A2 enhances glioma cell motility, migration, and invasion, as well as the associated angiogenesis, most likely via activation of the localized tPA/plasminogen proteolytic system. The changes in motility/migration are accompanied by changes in actin cytoskeleton dynamics. The results are consistent with the observation that high-grade human tumors express anti-annexin A2-immunoreactive material especially along their invading edges. Together, these results strongly suggest a central role for annexin A2 in the rapid clinical progression of human high-grade glioma and suggest that inhibition of annexin A2 in gliomas may offer a novel therapeutic strategy.
Footnotes
This work was supported by NIH Grants R01 NS 42168 (S.E.T.), K08 CA87896 (S.A.), and R01 042493, P01 046403, and R01 090895 (K.A.H.) and American Cancer Society Grant PF-00-009-01-CSM (S.A.). We thank Diandra Ayala and Dorothy Konomos for their initial work with the GL261 cells, members of the Tsirka laboratory, Lois Lampson and Lynette M. Phillips for helpful discussions, and Leona Cohen-Gould and Stephanie Burke for assistance with tissue processing.
References
- Allegranza A, Girlando S, Arrigoni GL, Veronese S, Mauri FA, Gambacorta M, Pollo B, Dalla Palma P, Barbareschi M. Proliferating cell nuclear antigen expression in central nervous system neoplasms. Virchows Arch A Pathol Anat Histopathol. 1991;419:417–423. doi: 10.1007/BF01605076. [DOI] [PubMed] [Google Scholar]
- Amberger VR, Hensel T, Ogata N, Schwab ME. Spreading and migration of human glioma and rat C6 cells on central nervous system myelin in vitro is correlated with tumor malignancy and involves a metalloproteolytic activity. Cancer Res. 1998;58:149–158. [PubMed] [Google Scholar]
- Bao H, Jiang M, Zhu M, Sheng F, Ruan J, Ruan C. Overexpression of Annexin II affects the proliferation, apoptosis, invasion and production of proangiogenic factors in multiple myeloma. Int J Hematol. 2009;90:177–185. doi: 10.1007/s12185-009-0356-8. [DOI] [PubMed] [Google Scholar]
- Barth RF, Kaur B. Rat brain tumor models in experimental neuro-oncology: the C6, 9L, T9, RG2, F98, BT4C, RT-2 and CNS-1 gliomas. J Neurooncol. 2009;94:299–312. doi: 10.1007/s11060-009-9875-7. [DOI] [PMC free article] [PubMed] [Google Scholar]
- Beckner ME, Chen X, An J, Day BW, Pollack IF. Proteomic characterization of harvested pseudopodia with differential gel electrophoresis and specific antibodies. Lab Invest. 2005;85:316–327. doi: 10.1038/labinvest.3700239. [DOI] [PubMed] [Google Scholar]
- Benda P, Lightbody J, Sato G, Levine L, Sweet W. Differentiated rat glial cell strain in tissue culture. Science. 1968;161:370–371. doi: 10.1126/science.161.3839.370. [DOI] [PubMed] [Google Scholar]
- Boschek CB, Jockusch BM, Friis RR, Back R, Grundmann E, Bauer H. Early changes in the distribution and organization of microfilament proteins during cell transformation. Cell. 1981;24:175–184. doi: 10.1016/0092-8674(81)90513-4. [DOI] [PubMed] [Google Scholar]
- Campa C, Kasman I, Ye W, Lee WP, Fuh G, Ferrara N. Effects of an anti-VEGF-A monoclonal antibody on laser-induced choroidal neovascularization in mice: optimizing methods to quantify vascular changes. Invest Ophthalmol Vis Sci. 2008;49:1178–1183. doi: 10.1167/iovs.07-1194. [DOI] [PubMed] [Google Scholar]
- Carmeliet P, Moons L, Lijnen R, Baes M, Lemaître V, Tipping P, Drew A, Eeckhout Y, Shapiro S, Lupu F, Collen D. Urokinase-generated plasmin activates matrix metalloproteinases during aneurysm formation. Nat Genet. 1997;17:439–444. doi: 10.1038/ng1297-439. [DOI] [PubMed] [Google Scholar]
- Chiang Y, Schneiderman MH, Vishwanatha JK. Annexin II expression is regulated during mammalian cell cycle. Cancer Res. 1993;53:6017–6021. [PubMed] [Google Scholar]
- Chung CY, Erickson HP. Cell surface annexin II is a high affinity receptor for the alternatively spliced segment of tenascin-C. J Cell Biol. 1994;126:539–548. doi: 10.1083/jcb.126.2.539. [DOI] [PMC free article] [PubMed] [Google Scholar]
- Chung CY, Murphy-Ullrich JE, Erickson HP. Mitogenesis, cell migration, and loss of focal adhesions induced by tenascin-C interacting with its cell surface receptor, annexin II. Mol Biol Cell. 1996;7:883–892. doi: 10.1091/mbc.7.6.883. [DOI] [PMC free article] [PubMed] [Google Scholar]
- Collen D. The plasminogen (fibrinolytic) system. Thromb Haemost. 1999;82:259–270. [PubMed] [Google Scholar]
- Colman H, Giannini C, Huang L, Gonzalez J, Hess K, Bruner J, Fuller G, Langford L, Pelloski C, Aaron J, Burger P, Aldape K. Assessment and prognostic significance of mitotic index using the mitosis marker phospho-histone H3 in low and intermediate-grade infiltrating astrocytomas. Am J Surg Pathol. 2006;30:657–664. doi: 10.1097/01.pas.0000202048.28203.25. [DOI] [PubMed] [Google Scholar]
- Dai C, Celestino JC, Okada Y, Louis DN, Fuller GN, Holland EC. PDGF autocrine stimulation dedifferentiates cultured astrocytes and induces oligodendrogliomas and oligoastrocytomas from neural progenitors and astrocytes in vivo. Genes Dev. 2001;15:1913–1925. doi: 10.1101/gad.903001. [DOI] [PMC free article] [PubMed] [Google Scholar]
- Danø K, Andreasen PA, Grøndahl-Hansen J, Kristensen P, Nielsen LS, Skriver L. Plasminogen activators, tissue degradation, and cancer. Adv Cancer Res. 1985;44:139–266. doi: 10.1016/s0065-230x(08)60028-7. [DOI] [PubMed] [Google Scholar]
- Dassah M, Deora AB, He K, Hajjar KA. The endothelial cell annexin A2 system and vascular fibrinolysis. Gen Physiol Biophys. 2009;28:F20–F28. [PMC free article] [PubMed] [Google Scholar]
- DeAngelis LM. Brain tumors. N Engl J Med. 2001;344:114–123. doi: 10.1056/NEJM200101113440207. [DOI] [PubMed] [Google Scholar]
- DeClerck YA, Imren S, Montgomery AM, Mueller BM, Reisfeld RA, Laug WE. Proteases and protease inhibitors in tumor progression. Adv Exp Med Biol. 1997;425:89–97. doi: 10.1007/978-1-4615-5391-5_9. [DOI] [PubMed] [Google Scholar]
- Deryugina EI, Bourdon MA. Tenascin mediates human glioma cell migration and modulates cell migration on fibronectin. J Cell Sci. 1996;109:643–652. doi: 10.1242/jcs.109.3.643. [DOI] [PubMed] [Google Scholar]
- Díaz VM, Hurtado M, Thomson TM, Reventós J, Paciucci R. Specific interaction of tissue-type plasminogen activator (t-PA) with annexin II on the membrane of pancreatic cancer cells activates plasminogen and promotes invasion in vitro. Gut. 2004;53:993–1000. doi: 10.1136/gut.2003.026831. [DOI] [PMC free article] [PubMed] [Google Scholar]
- Eberhard DA, Brown MD, VandenBerg SR. Alterations of annexin expression in pathological neuronal and glial reactions. Immunohistochemical localization of annexins I, II (p36 and p11 subunits), IV, and VI in the human hippocampus. Am J Pathol. 1994;145:640–649. [PMC free article] [PubMed] [Google Scholar]
- El Andaloussi A, Sonabend AM, Han Y, Lesniak MS. Stimulation of TLR9 with CpG ODN enhances apoptosis of glioma and prolongs the survival of mice with experimental brain tumors. Glia. 2006;54:526–535. doi: 10.1002/glia.20401. [DOI] [PubMed] [Google Scholar]
- Eyüpoglu IY, Hahnen E, Heckel A, Siebzehnrübl FA, Buslei R, Fahlbusch R, Blümcke I. Malignant glioma-induced neuronal cell death in an organotypic glioma invasion model. Technical note. J Neurosurg. 2005;102:738–744. doi: 10.3171/jns.2005.102.4.0738. [DOI] [PubMed] [Google Scholar]
- Gavrieli Y, Sherman Y, Ben-Sasson SA. Identification of programmed cell death in situ via specific labeling of nuclear DNA fragmentation. J Cell Biol. 1992;119:493–501. doi: 10.1083/jcb.119.3.493. [DOI] [PMC free article] [PubMed] [Google Scholar]
- Giese A, Bjerkvig R, Berens ME, Westphal M. Cost of migration: invasion of malignant gliomas and implications for treatment. J Clin Oncol. 2003;21(8):1624–36. doi: 10.1200/JCO.2003.05.063. [DOI] [PubMed] [Google Scholar]
- Goh KY, Poon WS, Chan DT, Ip CP. Tissue plasminogen activator expression in meningiomas and glioblastomas. Clin Neurol Neurosurg. 2005;107:296–300. doi: 10.1016/j.clineuro.2004.09.010. [DOI] [PubMed] [Google Scholar]
- Guillamo JS, de Boüard S, Valable S, Marteau L, Leuraud P, Marie Y, Poupon MF, Parienti JJ, Raymond E, Peschanski M. Molecular mechanisms underlying effects of epidermal growth factor receptor inhibition on invasion, proliferation, and angiogenesis in experimental glioma. Clin Cancer Res. 2009;15:3697–3704. doi: 10.1158/1078-0432.CCR-08-2042. [DOI] [PubMed] [Google Scholar]
- Hajjar KA, Harpel PC, Jaffe EA, Nachman RL. Binding of plasminogen to cultured human endothelial cells. J Biol Chem. 1986;261:11656–11662. [PubMed] [Google Scholar]
- Hajjar KA, Hamel NM, Harpel PC, Nachman RL. Binding of tissue plasminogen activator to cultured human endothelial cells. J Clin Invest. 1987;80:1712–1719. doi: 10.1172/JCI113262. [DOI] [PMC free article] [PubMed] [Google Scholar]
- Hajjar KA, Jacovina AT, Chacko J. An endothelial cell receptor for plasminogen/tissue plasminogen activator. I. Identity with annexin II. J Biol Chem. 1994;269:21191–21197. [PubMed] [Google Scholar]
- Hancox RA, Allen MD, Holliday DL, Edwards DR, Pennington CJ, Guttery DS, Shaw JA, Walker RA, Pringle JH, Jones JL. Tumour-associated tenascin-C isoforms promote breast cancer cell invasion and growth by matrix metalloproteinase-dependent and independent mechanisms. Breast Cancer Res. 2009;11:R24. doi: 10.1186/bcr2251. [DOI] [PMC free article] [PubMed] [Google Scholar]
- Hayes MJ, Moss SE. Annexin 2 has a dual role as regulator and effector of v-Src in cell transformation. J Biol Chem. 2009;284:10202–10210. doi: 10.1074/jbc.M807043200. [DOI] [PMC free article] [PubMed] [Google Scholar]
- Hayes MJ, Rescher U, Gerke V, Moss SE. Annexin-actin interactions. Traffic. 2004;5:571–576. doi: 10.1111/j.1600-0854.2004.00210.x. [DOI] [PubMed] [Google Scholar]
- Huang KS, Wallner BP, Mattaliano RJ, Tizard R, Burne C, Frey A, Hession C, McGray P, Sinclair LK, Chow EP, et al. Two human 35 kd inhibitors of phospholipase A2 are related to substrates of pp60v-src and of the epidermal growth factor receptor/kinase. Cell. 1986;46:191–199. doi: 10.1016/0092-8674(86)90736-1. [DOI] [PubMed] [Google Scholar]
- Huang Y, Jin Y, Yan CH, Yu Y, Bai J, Chen F, Zhao YZ, Fu SB. Involvement of annexin A2 in p53 induced apoptosis in lung cancer. Mol Cell Biochem. 2008;309:117–123. doi: 10.1007/s11010-007-9649-5. [DOI] [PubMed] [Google Scholar]
- Hubaishy I, Jones PG, Bjorge J, Bellagamba C, Fitzpatrick S, Fujita DJ, Waisman DM. Modulation of annexin II tetramer by tyrosine phosphorylation. Biochemistry. 1995;34:14527–14534. doi: 10.1021/bi00044a031. [DOI] [PubMed] [Google Scholar]
- Iwadate Y, Sakaida T, Hiwasa T, Nagai Y, Ishikura H, Takiguchi M, Yamaura A. Molecular classification and survival prediction in human gliomas based on proteome analysis. Cancer Res. 2004;64:2496–2501. doi: 10.1158/0008-5472.can-03-1254. [DOI] [PubMed] [Google Scholar]
- Jacovina AT, Zhong F, Khazanova E, Lev E, Deora AB, Hajjar KA. Neuritogenesis and the nerve growth factor-induced differentiation of PC-12 cells requires annexin II-mediated plasmin generation. J Biol Chem. 2001;276:49350–49358. doi: 10.1074/jbc.M106289200. [DOI] [PubMed] [Google Scholar]
- Jacovina AT, Deora AB, Ling Q, Broekman MJ, Almeida D, Greenberg CB, Marcus AJ, Smith JD, Hajjar KA. Homocysteine inhibits neoangiogenesis in mice through blockade of annexin A2-dependent fibrinolysis. J Clin Invest. 2009;119:3384–3394. doi: 10.1172/JCI39591. [DOI] [PMC free article] [PubMed] [Google Scholar]
- Jahkola T, Toivonen T, Virtanen I, von Smitten K, Nordling S, von Boguslawski K, Haglund C, Nevanlinna H, Blomqvist C. Tenascin-C expression in invasion border of early breast cancer: a predictor of local and distant recurrence. Br J Cancer. 1998;78:1507–1513. doi: 10.1038/bjc.1998.714. [DOI] [PMC free article] [PubMed] [Google Scholar]
- Kang HM, Choi KS, Kassam G, Fitzpatrick SL, Kwon M, Waisman DM. Role of annexin II tetramer in plasminogen activation. Trends Cardiovasc Med. 1999;9:92–102. doi: 10.1016/s1050-1738(99)00012-2. [DOI] [PubMed] [Google Scholar]
- Kesavan K, Ratliff J, Johnson EW, Dahlberg W, Asara JM, Misra P, Frangioni JV, Jacoby DB. Annexin A2 is a molecular target for TM601, a peptide with tumor-targeting and anti-angiogenic effects. J Biol Chem. 2010;285:4366–4374. doi: 10.1074/jbc.M109.066092. [DOI] [PMC free article] [PubMed] [Google Scholar]
- Kwon M, MacLeod TJ, Zhang Y, Waisman DM. S100A10, annexin A2, and annexin A2 heterotetramer as candidate plasmnogen receptors. Front Biosci. 2005;10:300–325. doi: 10.2741/1529. [DOI] [PubMed] [Google Scholar]
- Lampson LA, Wen P, Roman VA, Morris JH, Sarid JA. Disseminating tumor cells and their interactions with leukocytes visualized in the brain. Cancer Res. 1992;52:1018–1025. [PubMed] [Google Scholar]
- Lampson LA, Lampson MA, Dunne AD. Exploiting the lacZ reporter gene for quantitative analysis of disseminated tumor growth within the brain: use of the lacZ gene product as a tumor antigen, for evaluation of antigenic modulation, and to facilitate image analysis of tumor growth in situ. Cancer Res. 1993;53:176–182. [PubMed] [Google Scholar]
- Legler JM, Ries LA, Smith MA, Warren JL, Heineman EF, Kaplan RS, Linet MS. Cancer surveillance series [corrected]: brain and other central nervous system cancers: recent trends in incidence and mortality. J Natl Cancer Inst. 1999;91:1382–1390. doi: 10.1093/jnci/91.16.1382. [DOI] [PubMed] [Google Scholar]
- Levicar N, Dewey RA, Daley E, Bates TE, Davies D, Kos J, Pilkington GJ, Lah TT. Selective suppression of cathepsin L by antisense cDNA impairs human brain tumor cell invasion in vitro and promotes apoptosis. Cancer Gene Ther. 2003;10:141–151. doi: 10.1038/sj.cgt.7700546. [DOI] [PubMed] [Google Scholar]
- Lijnen HR. Plasmin and matrix metalloproteinases in vascular remodeling. Thromb Haemost. 2001;86:324–333. [PubMed] [Google Scholar]
- Ling Q, Jacovina AT, Deora A, Febbraio M, Simantov R, Silverstein RL, Hempstead B, Mark WH, Hajjar KA. Annexin II regulates fibrin homeostasis and neoangiogenesis in vivo. J Clin Invest. 2004;113:38–48. doi: 10.1172/JCI200419684. [DOI] [PMC free article] [PubMed] [Google Scholar]
- Maes W, Van Gool SW. Experimental immunotherapy for malignant glioma: lessons from two decades of research in the GL261 model. Cancer Immunol Immunother. 2011;60:153–160. doi: 10.1007/s00262-010-0946-6. [DOI] [PMC free article] [PubMed] [Google Scholar]
- Mai J, Finley RL, Jr, Waisman DM, Sloane BF. Human procathepsin B interacts with the annexin II tetramer on the surface of tumor cells. J Biol Chem. 2000;275:12806–12812. doi: 10.1074/jbc.275.17.12806. [DOI] [PubMed] [Google Scholar]
- Martin BM, Wasiewski WW, Fenton JW, 2nd, Detwiler TC. Equilibrium binding of thrombin to platelets. Biochemistry. 1976;15:4886–4893. doi: 10.1021/bi00667a021. [DOI] [PubMed] [Google Scholar]
- McColl BK, Baldwin ME, Roufail S, Freeman C, Moritz RL, Simpson RJ, Alitalo K, Stacker SA, Achen MG. Plasmin activates the lymphangiogenic growth factors VEGF-C and VEGF-D. J Exp Med. 2003;198:863–868. doi: 10.1084/jem.20030361. [DOI] [PMC free article] [PubMed] [Google Scholar]
- McMahon B, Kwaan HC. The plasminogen activator system and cancer. Pathophysiol Haemost Thromb. 2008;36:184–194. doi: 10.1159/000175156. [DOI] [PubMed] [Google Scholar]
- Meijne AM, Ruuls-Van Stalle L, Feltkamp CA, McCarthy JB, Roos E. v-src-induced cell shape changes in rat fibroblasts require new gene transcription and precede loss of focal adhesions. Exp Cell Res. 1997;234:477–485. doi: 10.1006/excr.1997.3637. [DOI] [PubMed] [Google Scholar]
- Meneses PI, Abrey LE, Hajjar KA, Gultekin SH, Duvoisin RM, Berns KI, Rosenfeld MR. Simplified production of a recombinant human angiostatin derivative that suppresses intracerebral glial tumor growth. Clin Cancer Res. 1999;5:3689–3694. [PubMed] [Google Scholar]
- Mignatti P, Rifkin DB. Biology and biochemistry of proteinases in tumor invasion. Physiol Rev. 1993;73:161–195. doi: 10.1152/physrev.1993.73.1.161. [DOI] [PubMed] [Google Scholar]
- Nolin WB, Emmetsberger J, Bukhari N, Zhang Y, Levine JM, Tsirka SE. tPA-mediated generation of plasmin is catalyzed by the proteoglycan NG2. Glia. 2008;56:177–189. doi: 10.1002/glia.20603. [DOI] [PMC free article] [PubMed] [Google Scholar]
- Nygaard SJ, Haugland HK, Kristoffersen EK, Lund-Johansen M, Laerum OD, Tysnes OB. Expression of annexin II in glioma cell lines and in brain tumor biopsies. J Neurooncol. 1998;38:11–18. doi: 10.1023/a:1005953000523. [DOI] [PubMed] [Google Scholar]
- Ohno Y, Izumi M, Kawamura T, Nishimura T, Mukai K, Tachibana M. Annexin II represents metastatic potential in clear-cell renal cell carcinoma. Br J Cancer. 2009;101:287–294. doi: 10.1038/sj.bjc.6605128. [DOI] [PMC free article] [PubMed] [Google Scholar]
- Pederson PH, Edvardsen K, Garcia-Cabrera I, Mahesparan R, Thorsen J, Mathison B, Rosenblum ML, Bjerkvig R. Migratory patterns of lac-Z transfected human glioma cells in rat brain. Int J Cancer. 1995;62:767–771. doi: 10.1002/ijc.2910620620. [DOI] [PubMed] [Google Scholar]
- Pepper MS. Manipulating angiogenesis. From basic science to the bedside. Arterioscler Thromb Vasc Biol. 1997;17:605–619. doi: 10.1161/01.atv.17.4.605. [DOI] [PubMed] [Google Scholar]
- Pepper MS. Role of the matrix metalloproteinase and plasminogen activator-plasmin systems in angiogenesis. Arterioscler Thromb Vasc Biol. 2001;21:1104–1117. doi: 10.1161/hq0701.093685. [DOI] [PubMed] [Google Scholar]
- Pistolesi S, Boldrini L, Gisfredi S, De Ieso K, Camacci T, Caniglia M, Lupi G, Leocata P, Basolo F, Pingitore R, Parenti G, Fontanini G. Angiogenesis in intracranial meningiomas: immunohistochemical and molecular study. Neuropathol Appl Neurobiol. 2004;30:118–125. doi: 10.1046/j.0305-1846.2003.00516.x. [DOI] [PubMed] [Google Scholar]
- Rao JS. Molecular mechanisms of glioma invasiveness: the role of proteases. Nat Rev Cancer. 2003;3:489–501. doi: 10.1038/nrc1121. [DOI] [PubMed] [Google Scholar]
- Reeves SA, Chavez-Kappel C, Davis R, Rosenblum M, Israel MA. Developmental regulation of annexin II (Lipocortin 2) in human brain and expression in high grade glioma. Cancer Res. 1992;52:6871–6876. [PubMed] [Google Scholar]
- Rella C, Coviello M, Quaranta M, Paradiso A. Tissue-type plasminogen activator as marker of functional steroid receptors in human breast cancer. Thromb Res. 1993;69:209–220. doi: 10.1016/0049-3848(93)90046-q. [DOI] [PubMed] [Google Scholar]
- Repesh LA. A new in vitro assay for quantitating tumor cell invasion. Invasion Metastasis. 1989;9:192–208. [PubMed] [Google Scholar]
- Roseman BJ, Bollen A, Hsu J, Lamborn K, Israel MA. Annexin II marks astrocytic brain tumors of high histologic grade. Oncol Res. 1994;6:561–567. [PubMed] [Google Scholar]
- Rosenthal EL, Johnson TM, Allen ED, Apel IJ, Punturieri A, Weiss SJ. Role of the plasminogen activator and matrix metalloproteinase systems in epidermal growth factor- and scatter factor-stimulated invasion of carcinoma cells. Cancer Res. 1998;58:5221–5230. [PubMed] [Google Scholar]
- Roshy S, Sloane BF, Moin K. Pericellular cathepsin B and malignant progression. Cancer Metastasis Rev. 2003;22:271–286. doi: 10.1023/a:1023007717757. [DOI] [PubMed] [Google Scholar]
- Salvesen GS. Caspases and apoptosis. Essays Biochem. 2002;38:9–19. doi: 10.1042/bse0380009. [DOI] [PubMed] [Google Scholar]
- San-Galli F, Vrignaud P, Robert J, Coindre JM, Cohadon F. Assessment of the experimental model of transplanted C6 glioblastoma in Wistar rats. J Neurooncol. 1989;7:299–304. doi: 10.1007/BF00172924. [DOI] [PubMed] [Google Scholar]
- Sharma MR, Koltowski L, Ownbey RT, Tuszynski GP, Sharma MC. Angiogenesis-associated protein annexin II in breast cancer: selective expression in invasive breast cancer and contribution to tumor invasion and progression. Exp Mol Pathol. 2006;81:146–156. doi: 10.1016/j.yexmp.2006.03.003. [DOI] [PubMed] [Google Scholar]
- Sharma M, Ownbey RT, Sharma MC. Breast cancer cell surface annexin II induces cell migration and neoangiogenesis via tPA dependent plasmin generation. Exp Mol Pathol. 2010;88:278–286. doi: 10.1016/j.yexmp.2010.01.001. [DOI] [PubMed] [Google Scholar]
- Soroceanu L, Manning TJ, Jr, Sontheimer H. Modulation of glioma cell migration and invasion using Cl− and K+ ion channel blockers. J Neurosci. 1999;19:5942–5954. doi: 10.1523/JNEUROSCI.19-14-05942.1999. [DOI] [PMC free article] [PubMed] [Google Scholar]
- Stack MS, Gately S, Bafetti LM, Enghild JJ, Soff GA. Angiostatin inhibits endothelial and melanoma cellular invasion by blocking matrix-enhanced plasminogen activation. Biochem J. 1999;340:77–84. [PMC free article] [PubMed] [Google Scholar]
- Stephens RW, Brünner N, Jänicke F, Schmitt M. The urokinase plasminogen activator system as a target for prognostic studies in breast cancer. Breast Cancer Res Treat. 1998;52:99–111. doi: 10.1023/a:1006115218786. [DOI] [PubMed] [Google Scholar]
- Stupp R, Mason WP, van den Bent MJ, Weller M, Fisher B, Taphoorn MJ, Belanger K, Brandes AA, Marosi C, Bogdahn U, Curschmann J, Janzer RC, Ludwin SK, Gorlia T, Allgeier A, Lacombe D, Cairncross JG, Eisenhauer E, Mirimanoff RO European Organisation for Research and Treatment of Cancer Brain Tumor and Radiotherapy Groups; National Cancer Institute of Canada Clinical Trials Group. Radiotherapy plus concomitant and adjuvant temozolomide for glioblastoma. N Engl J Med. 2005;352:987–996. doi: 10.1056/NEJMoa043330. [DOI] [PubMed] [Google Scholar]
- Tatenhorst L, Rescher U, Gerke V, Paulus W. Knockdown of annexin 2 decreases migration of human glioma cells in vitro. Neuropathol Appl Neurobiol. 2006;32:271–277. doi: 10.1111/j.1365-2990.2006.00720.x. [DOI] [PubMed] [Google Scholar]
- Tsatas D, Kaye AH. The role of the plasminogen activation cascade in glioma cell invasion: a review. J Clin Neurosci. 2003;10:139–145. doi: 10.1016/s0967-5868(02)00328-4. [DOI] [PubMed] [Google Scholar]
- Upton AL, Moss SE. Molecular cloning of a novel N-terminal variant of annexin II from rat basophilic leukaemia cells. Biochem J. 1994;302:425–428. doi: 10.1042/bj3020425. [DOI] [PMC free article] [PubMed] [Google Scholar]
- Verhaak RG, Hoadley KA, Purdom E, Wang V, Qi Y, Wilkerson MD, Miller CR, Ding L, Golub T, Mesirov JP, Alexe G, Lawrence M, O'Kelly M, Tamayo P, Weir BA, Gabriel S, Winckler W, Gupta S, Jakkula L, Feiler HS, Hodgson JG, James CD, Sarkaria JN, Brennan C, Kahn A, Spellman PT, Wilson RK, Speed TP, Gray JW, Meyerson M, Getz G, Perou CM, Hayes DN Cancer Genome Atlas Research Network. Integrated genomic analysis identifies clinically relevant subtypes of glioblastoma characterized by abnormalities in PDGFRA, IDH1, EGFR, and NF1. Cancer Cell. 2010;17:98–110. doi: 10.1016/j.ccr.2009.12.020. [DOI] [PMC free article] [PubMed] [Google Scholar]
- Wesolowska A, Kwiatkowska A, Slomnicki L, Dembinski M, Master A, Sliwa M, Franciszkiewicz K, Chouaib S, Kaminska B. Microglia-derived TGF-beta as an important regulator of glioblastoma invasion: an inhibition of TGF-beta-dependent effects by shRNA against human TGF-beta type II receptor. Oncogene. 2008;27:918–930. doi: 10.1038/sj.onc.1210683. [DOI] [PubMed] [Google Scholar]
- Winkler F, Kienast Y, Fuhrmann M, Von Baumgarten L, Burgold S, Mitteregger G, Kretzschmar H, Herms J. Imaging glioma cell invasion in vivo reveals mechanisms of dissemination and peritumoral angiogenesis. Glia. 2009;57:1306–1315. doi: 10.1002/glia.20850. [DOI] [PubMed] [Google Scholar]
- Zamecnik J. The extracellular space and matrix of gliomas. Acta Neuropathol. 2005;110:435–442. doi: 10.1007/s00401-005-1078-5. [DOI] [PubMed] [Google Scholar]
- Zhai H, Heppner FL, Tsirka SE. Microglia/macrophages promote glioma progression. Glia. 2011;59:472–485. doi: 10.1002/glia.21117. [DOI] [PMC free article] [PubMed] [Google Scholar]
- Zhang F, Zhang L, Zhang B, Wei X, Yang Y, Qi RZ, Ying G, Zhang N, Niu R. Anxa2 plays a critical role in enhanced invasiveness of the multidrug resistant human breast cancer cells. J Proteome Res. 2009;8:5041–5047. doi: 10.1021/pr900461c. [DOI] [PubMed] [Google Scholar]
- Zobiack N, Gerke V, Rescher U. Complex formation and submembranous localization of annexin 2 and S100A10 in live HepG2 cells. FEBS Lett. 2001;500:137–140. doi: 10.1016/s0014-5793(01)02604-7. [DOI] [PubMed] [Google Scholar]