Abstract
Background and purpose
Magnitude, geographic and ethnic variation in trends in stroke within the US require updating for health services and health disparities research.
Methods
Data for stroke were analyzed from the US mortality files for 1999–2007. Age-adjusted death rates were computed for non-Hispanic African Americans (AA) and European Americans (EA) aged 45 years and over.
Results
Between 1999 and 2007 the age-adjusted death rate per 100,000 for stroke declined both in AA and in EA of both genders. Among AA females, EA females and EA males, rates declined by at least 2% annually in every division. Among AA males, rates declined little in the East and West South Central Divisions where disparities in trends by urbanization level were found.
Conclusions
Between 1999 and 2007, the rate of decline in stroke mortality varied by geographic region and ethnic group.
Keywords: African Americans, Aging, Cerebrovascular disorders, Mortality, geography
In 2009, stroke was the fourth leading cause of death in the US.1–4 Many publications have detailed the ethnic and geographic variation in stroke mortality in the US prior to 2000.3–7 This report documents ethnic and geographic variation in mortality trends from stroke within the US in the 21st century.
MATERIALS AND METHODS
Deaths in 1999–2007 with cerebrovascular disease (International Classification of Disease 10th revision [ICD-10] codes I60–I69 (1999–2007) as underlying cause were enumerated.5 For non-Hispanic African Americans (AA) and European Americans (EA), age-adjusted death rates per 100,000 using the 2000 US standard population were computed for persons aged 45 years and over using standard methods.5 Urbanization levels and Census divisions are defined in supplemental Table S1 (please see http://stroke.ahajournals.org).6
RESULTS
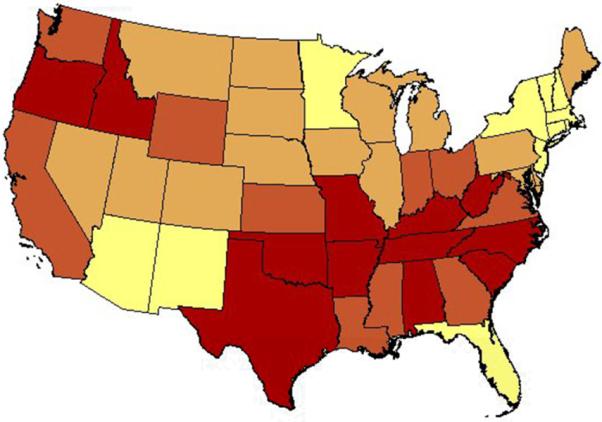
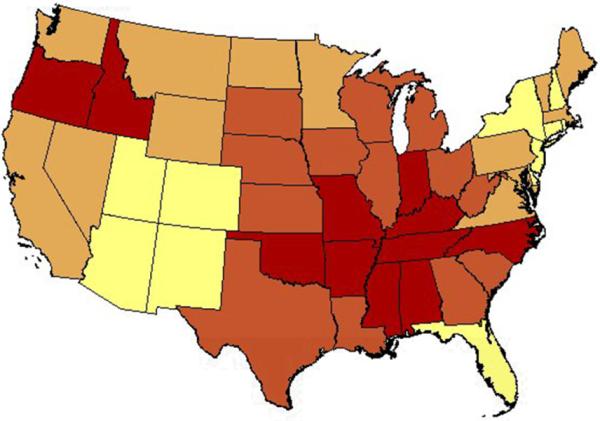
In 2005–2007, average annual death rates varied by state for each group (Figure 1, Table 1, Tables S2 and S3 please see http://stroke.ahajournals.org). The rates for AA were highest in the South Atlantic, East and West South Central states and lowest in New England and New York; whereas rates for European Americans were highest in the South Central states, including Alabama and Mississippi, Oregon and lowest in New York, Florida and the Southwest. Ratios of the 90th to 10th percentiles of state rates were as follows: AA females 1.5, EA females 1.5, AA males 1.8, EA males 1.5. In 1979–1981 the ratios were 1.7, 1.4, 1.8, and 1.5, respectively.
Figure 1.

Age-adjusted rate of stroke death by state for European Americans aged 45 years and over: United States, 1999–2007. Panel A, women; panel B, men.
Table 1.
States with the highest age-adjusted stroke mortality rate per 100,000 by gender and ethnicity in non-Hispanics aged 45 years and over: United States, 2005–2007
| Rank | AA women | EA women | AA men | EA men |
|---|---|---|---|---|
| 1 | Arkansas | Arkansas | Oregon | Oklahoma |
| 2 | Oklahoma | Oklahoma | Arkansas | Arkansas |
| 3 | Alabama | Tennessee | Alabama | Tennessee |
| 4 | Texas | Alabama | Tennessee | Alabama |
| 5 | Louisiana | Idaho | Kansas | North Carolina |
| 6 | Tennessee | West Virginia | Mississippi | Oregon |
| 7 | Oregon | North Carolina | South Carolina | Indiana |
| 8 | North Carolina | Kentucky | Nebraska | Kentucky |
| 9 | South Carolina | Oregon | North Carolina | Mississippi |
| 10 | California | Texas | Iowa | Alaska |
AA, African American; EA, European American
In 1999–2007 rates declined in the nine US Census divisions (Table 2). Relative declines tended to be greatest in the Mountain and Pacific divisions. Variation in rate of decline was greater in AA than in EA. The slowest relative declines occurred in AA females in the W. N. Central and W. S. Central divisions, and in AA males in the E. S. Central and W. S. Central divisions.
Table 2.
Average percent change (AAPC)and selected age-adjusted rates of stroke mortality per 100,000 and by Census division, gender andrace in non-Hispanics aged 45 years and over: United States, 1999–2007
| Division | AAF | EAF | AAM | EAM | |
|---|---|---|---|---|---|
| New England | AAPC | −4.2 | −5.0 | −4.0 | −5.3 |
| 1999 | 151 | 140 | 161 | 153 | |
| 2007 | 112 | 99 | 109 | 102 | |
| Mid Atlantic | AAPC | −4.2 | −4.3 | −3.5 | −4.7 |
| 1999 | 143 | 131 | 169 | 140 | |
| 2007 | 110 | 95 | 137 | 99 | |
| E. N. Central | AAPC | −3.9 | −4.8 | −3.7 | −5.3 |
| 1999 | 203 | 173 | 249 | 184 | |
| 2007 | 150 | 118 | 188 | 122 | |
| W. N. Central | AAPC | −2.4 | −4.6 | −5.1 | −4.9 |
| 1999 | 204 | 166 | 283 | 178 | |
| 2007 | 168 | 115 | 202 | 120 | |
| S. Atlantic | AAPC | −5.1 | −5.4 | −5.0 | −5.9 |
| 1999 | 236 | 163 | 287 | 166 | |
| 2007 | 158 | 109 | 195 | 106 | |
| E. S. Central | AAPC | −4.0 | −4.6 | −1.8 | −5.2 |
| 1999 | 229 | 191 | 254 | 201 | |
| 2007 | 171 | 137 | 242 | 133 | |
| W. S. Central | AAPC | −3.1 | −4.5 | −3.3 | −4.6 |
| 1999 | 236 | 187 | 260 | 184 | |
| 2007 | 186 | 138 | 210 | 134 | |
| Mountain | AAPC | −6.6 | −5.6 | −5.4 | −6.6 |
| 1999 | 217 | 160 | 224 | 160 | |
| 2007 | 132 | 106 | 141 | 94 | |
| Pacific | AAPC | −4.9 | −5.9 | −5.2 | −6.3 |
| 1999 | 256 | 186 | 279 | 188 | |
| 2007 | 181 | 115 | 190 | 116 |
AA, African American; EA, European American; F, females; M, males
Further, within the West South Central division for AA women, the age-adjusted rate per 100,000 was highest in small metro areas (220) and lowest in large-fringe metro areas (188). Average APC were greatest in large fringe (−4.86) and small metro areas (−4.84) and least in medium metro (−1.23) (Table S4, please see http://stroke.ahajournals.org). In African American men, the age-adjusted rate per 100,000 was highest in micropolitan (non-metro) areas (274) and lowest in large-fringe metro areas (213). Relative decline was greatest in non-core (non-metro) (−5.59) least in large central metro (−2.24) (Table S4).
DISCUSSION
US ethnic and geographic variation in stroke mortality or morbidity has been the subject of numerous studies.3,7-9-14 Yet the causes of the large geographic variation in stroke mortality have yet to be fully identified. Use of the years 1999–2007 when only ICD-10 was in use precluded bias due to changes in ICD version. High rates in Idaho, a state with a small population, should be viewed with caution. Unlike previous studies,1–4 analyses were restricted to non-Hispanics. Lack of information did not permit further analyses to explain observed geographic patterns.
Supplementary Material
Figure 2.

Acknowledgments
Sources of funding: Dr. Obisesan was supported by career development award # AG00980, research award #RO1-AG031517 from the National Institute on Aging and research award #1UL1RR03197501 from the National Center for Research Resources.
Footnotes
Disclosures: The authors have no conflicts of interest to disclose.
Publisher's Disclaimer: This is a PDF file of an unedited manuscript that has been accepted for publication. As a service to our customers we are providing this early version of the manuscript. The manuscript will undergo copyediting, typesetting, and review of the resulting proof before it is published in its final citable form. Please note that during the production process errors may be discovered which could affect the content, and all legal disclaimers that apply to the journal pertain.
REFERENCES
- 1.Towfighi A, Ovbiagele B, Saver JL. Therapeutic milestone: stroke declines from second to third leading organ- and disease-specific cause of death in the United States. Stroke. 2010;41:499–503. doi: 10.1161/STROKEAHA.109.571828. [DOI] [PubMed] [Google Scholar]
- 2.Kochanek KD, Xu JQ, Murphy SL, Miniño AM, Kung HC. National Vital Statistics Reports. vol 59. National Center for Health Statistics; Hyattsville, MD: 2011. Deaths: Preliminary Data for 2009. no 4. [PubMed] [Google Scholar]
- 3.Howard G, Howard VJ, Katholi C, Oli MK, Huston S. Decline in US stroke mortality: an analysis of temporal patterns by sex, race, and geographic region. Stroke. 2001;32:2213–2218. doi: 10.1161/hs1001.096047. [DOI] [PubMed] [Google Scholar]
- 4.Ovbiagele B. Nationwide trends in in-hospital mortality among patients with stroke. Stroke. 2010;41:1748–1754. doi: 10.1161/STROKEAHA.110.585455. [DOI] [PubMed] [Google Scholar]
- 5.Centers for Disease Control and Prevention, National Center for Health Statistics. Multiple Cause of Death File 2005–2006. [Nov 23, 2010];CDC WONDER On-line Database, compiled from Multiple Cause of Death File 2005–2006 Series 20 No. 2L, 2009. Accessed at http://wonder.cdc.gov/mcdicd10.html on 1:53:42 PM.
- 6.Ingram DD, Franco S. [last accessed 12/20/2010];2006 NCHS urban-rural classification scheme for counties. 2006 http://wonder.cdc.gov/wonder/help/CMF/Urbanization-Methodology.html.
- 7.Yang D, Howard G, Coffey CS, Roseman J. The confounding of race and geography: how much of the excess stroke mortality among African Americans is explained by geography? Neuroepidemiology. 2004;23:118–22. doi: 10.1159/000075954. [DOI] [PubMed] [Google Scholar]
- 8.Liao Y, Greenlund KJ, Croft JB, Keenan NL, Giles WH. Factors explaining excess stroke prevalence in the US Stroke Belt. Stroke. 2009;40:3336–41. doi: 10.1161/STROKEAHA.109.561688. [DOI] [PubMed] [Google Scholar]
- 9.Cushman M, Cantrell RA, McClure LA, Howard G, Prineas RJ, Moy CS, et al. Estimated 10-year stroke risk by region and race in the United States: geographic and racial differences in stroke risk. Ann Neurol. 2008;64:507–513. doi: 10.1002/ana.21493. [DOI] [PMC free article] [PubMed] [Google Scholar]
- 10.Gillum RF, Ingram DD. Relation between residence in the southeast region of the United States and stroke incidence. The NHANES I Epidemiologic Follow-up Study. Am J Epidemiol. 1996;144:665–673. doi: 10.1093/oxfordjournals.aje.a008979. [DOI] [PubMed] [Google Scholar]
- 11.Fang J, Alderman MH. Trend of stroke hospitalization, United States, 1988–1997. Stroke. 2001;32:2221–6. doi: 10.1161/hs1001.096193. [DOI] [PubMed] [Google Scholar]
- 12.Voeks JH, McClure LA, Go RC, Prineas RJ, Cushman M, Kissela BM, et al. Regional differences in diabetes as a possible contributor to the geographic disparity in stroke mortality: the REasons for Geographic And Racial Differences in Stroke Study. Stroke. 2008;39:1675–80. doi: 10.1161/STROKEAHA.107.507053. [DOI] [PMC free article] [PubMed] [Google Scholar]
- 13.You Z, Cushman M, Jenny NS, Howard G. Tooth loss, systemic inflammation, and prevalent stroke among participants in the reasons for geographic and racial difference in stroke (REGARDS) study. Atherosclerosis. 2009;203:615–9. doi: 10.1016/j.atherosclerosis.2008.07.037. REGARDS. [DOI] [PMC free article] [PubMed] [Google Scholar]
- 14.Glasser SP, Cushman M, Prineas R, Kleindorfer D, Prince V, You Z, et al. Does differential prophylactic aspirin use contribute to racial and geographic disparities in stroke and coronary heart disease (CHD)? Prev Med. 2008;47:161–6. doi: 10.1016/j.ypmed.2008.05.009. [DOI] [PMC free article] [PubMed] [Google Scholar]
Associated Data
This section collects any data citations, data availability statements, or supplementary materials included in this article.


