Abstract
This study aims to characterize the pharmacodynamic properties of denosumab, a RANK ligand inhibitor, and ibandronate, a bisphosphonate, using an integrated bone homeostasis model in postmenopausal women. Mean temporal profiles of denosumab, serum and urine N-telopeptide (sNTX, uNTX), lumbar spine bone mineral density (BMD) following denosumab administration, and urine C-telopeptide (uCTX) and lumbar spine BMD upon ibandronate administration were extracted from the literature. A mechanistic model was developed that integrates denosumab pharmacokinetics with binding to RANK ligand and ibandronate inhibition of osteoclast precursor differentiation to active osteoclasts (AOC). Biomarker concentrations were linked to the AOC pool. BMD was characterized by a turnover model with stimulation of bone formation and degradation by AOB (active osteoblasts) and AOC pools. The estimated basal sNTX, uNTX and uCTX concentrations were 7.24 nM, 14.4 nmol/mmolCr, and 31 μg/mmolCr. The BMD degradation rate was 0.00161 day−1 with stimulation constants associated with AOB and AOC of 1214 and 790 pM−1. Plasma ibandronate concentration producing 50% of maximum inhibition of osteoclast differentiation was 522 ng/L. The integrated model, which incorporates multiple pathways of therapeutic intervention, quantitatively describes changes in clinical biomarkers of bone turnover and BMD after denosumab and ibandronate exposures in postmenopausal women.
Keywords: bisphosphonates, bone remodeling, bone mineral density, denosumab, pharmacodynamics
Introduction
Osteoporosis is a bone disease characterized by low bone mass coupled with structural deterioration of bone tissue. It affects 10 million individuals in the United States alone, and 80% of those affected are women. 34 million individuals exhibit low bone mass and have increased susceptibility of developing the disease. Osteoporosis causes increased bone fragility and results in 1.5 million fractures annually, targeting the hip, wrist and spine [1,2]. This disease results from an imbalance in bone remodeling; a marked increase in bone resorption compared to bone formation. Bone remodeling is primarily accomplished by osteoblast and osteoclast cells, which are responsible for bone formation and degradation respectively. The functioning and interaction of these cellular components are coordinated by the competitive binding of RANK (receptor activator of nuclear factor -κβ) receptor and a soluble decoy receptor, osteoprotegrin (OPG), with RANK ligand (RANKL) expressed on the surface of osteoblasts [3–5]. In women, a sharp decline in estrogen levels is observed during menopause which affects the RANK-RANKL-OPG axis and also the functioning of osteoclasts and osteoblasts [6]. Estrogen deficiency has been linked to decreased levels of OPG and increase in differentiation of osteoclast precursors, thus resulting in increased bone resorption [7].
The majority of approved therapies for osteoporosis are anti-resorptive agents. These include estrogen, selective estrogen receptor modulators, calcitonin and bisphosphonates, the most widely used class for osteoporosis therapy. Bisphosphonates are thought to concentrate on the surface of bone and reduce resorption by interfering with the action of osteoclasts and their precursors and by altering osteoclast life-span [7,8]. Denosumab, an anti- RANKL monoclonal antibody, is a novel anti-resorptive drug that inhibits RANK-RANKL interaction and is currently FDA approved for the prevention of skeletal-related events in patients with bone metastases from solid tumors. Data from phase III clinical trials of denosumab in postmenopausal osteoporosis demonstrate effective inhibition of bone resorption [9,10].
Model-based drug development might improve the evaluation of osteoporosis therapies given the substantial time required for observing changes in bone mineral density (BMD) and fracture risk in clinical trials. Thus, there is a need for mechanistic models that utilize drug pharmacokinetic (PK) and biomarker data from early trials to predict changes in BMD which exhibits a slow turnover. Semi-mechanistic PK/pharmacodynamic (PD) models have been developed to describe time-courses of biomarkers for ibandronate [8] and pamidronate [11] in osteoporosis. Bone homeostasis models, incorporating drug effects on the RANK-RANKL-OPG pathway, have also been developed to capture biomarker profiles [12,13]. However, such models have yet to be linked to BMD in a mechanistic manner.
The purpose of this study is to characterize the time-course of biomarkers, serum/urine N-telopeptide of type I collagen (NTX) and BMD, a clinical endpoint, upon denosumab administration in postmenopausal women (PMW) using an integrated bone homeostasis model. BMD turnover was mechanistically linked to state variables reflecting cellular components responsible for bone remodeling. Also, the mechanism of action of ibandronate was incorporated into the model to describe the time-course of urine C-telopeptide of type I collagen (CTX).
Material and Methods
Data Source
Mean data for denosumab and ibandronate were obtained from 3 published clinical studies (Table I): i) Denosumab PK and PD (sNTX and uNTX profiles) were obtained from a randomized, double-blind, placebo-controlled, single-dose, dose escalation study in healthy postmenopausal women [9]. Six subcutaneous (SC) doses of 0.01, 0.03, 0.1, 0.3, 1.0 and 3.0 mg/kg of denosumab were studied. Denosumab concentrations were measured frequently (rich dataset). uNTX was measured at 0, 0.5, 1, 7, and 14 days, and at 1, 2, 3, 6 and 9 months. sNTX was measured at 0, 1, 4, and 14 days, and at 1, 2, 3, 6 and 9 months. ii) Denosumab PD (uNTX and lumbar spine BMD time profiles) for multiple-dosing was from a Phase 2 randomized, placebo-controlled, dose-ranging study of postmenopausal women with low BMD [10]. This study involved 6, 14, and 30mg SC doses of denosumab administered every 3 months. uNTX was measured at 0 and 0.1 months after the first dose, once a month in the first year, and every 3 months during the second year. Lumbar spine BMD was measured at 0, 1, 3, 6, 12, 18, and 24 months. iii) Ibandronate PD (uCTX time profiles) was from a Phase 1 study in postmenopausal women with osteopenia [8]. This study involved 0.25, 0.5, 1.0 and 2.0 mg IV doses of ibandronate administered once every 3 months. uCTX was measured at 0, 1, 4, 8, 15, 29, 57 days after the first dose and at 0, 1, 2, 3, 4, 8, 15, 29, 57, and 92 days after the second dose. Data was digitized using Graph Digitizer version 2.0.
Table I.
Data source characteristics.
| Study reference | Drug regimen | PK/PD Measurements |
|---|---|---|
| Bekker et al, 2004 [9] | Denosumab: 0.01, 0.03, 0.1, 0.3, 1, and 3 mg/kg single SC dose levels | Denosumab, Serum NTX (sNTX), Urine NTX (uNTX) |
| Lewiecki et al, 2007 [10] | Denosumab: 6, 14, and 30 mg SC doses every 3 months | Urine NTX (uNTX), Bone mineral density (BMD) |
| Pillai et al, 2004 [8] | Ibandronate: 0.25, 0.5, 1, and 2 mg IV doses every 3 months | Ibandronate, Urine CTX (uCTX) |
Extracted percentage change in biomarkers and BMD were converted to absolute values utilizing baseline values provided in the original studies. Baseline T-scores of BMD for denosumab were converted to absolute values utilizing a reference mean BMD of 1.034 and standard deviation of 0.104 for Caucasian women of 20–29 years age [14]. These absolute values were used for model fitting/optimization, and the output was converted back to relative percentages post-fitting for proper visualization and comparisons across dose levels.
Pharmacokinetic Models
Serum denosumab PK profiles were characterized using a one-compartmental model with Michaelis-Menten kinetics (Figure 1A). A first-order rate process (ka) governs the absorption of drug (Dosedeno) from the subcutaneous (SC) injection site into the central compartment (CP,deno, Vc). Drug elimination from the central compartment is described by a combination of a linear first-order process (kel) and a non-linear process (Vmax, Km):
| (1) |
where, Vc/F is the volume of the central compartment adjusted for bioavailability. The initial condition for Equation 1 is set to zero. The prolonged absorption phase and the absence of IV data precluded the need for including distribution of the drug to a non-specific tissue compartment and thus reduced the number of parameters in this model. The PK model (Fig. 1B) and parameters for ibandronate were obtained from the literature [8].
Figure 1.
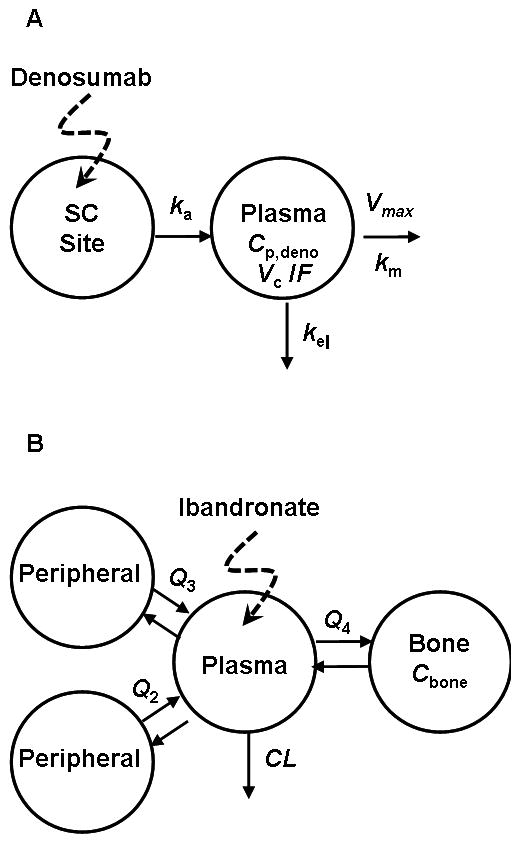
Pharmacokinetic models for denosumab (A) and ibandronate (B). For (A), drug administered subcutaneously is absorbed (ka) into the plasma compartment (Cp, Vc) and undergoes linear (kel) and nonlinear (Vmax, Km) elimination. Model shown in (B) is a linear 4-compartment model with a bone-specific site originally described by Pillai et al. [8].
Pharmacodynamic Model
A fully integrated bone homeostasis model incorporating the actions of denosumab and ibandronate on biomarkers and bone mineral density (BMD) is illustrated in Figure 2. Details of the biological pathways involved in this model are described in detail elsewhere [13]. Here we extend previous efforts to include mechanistic links for BMD turnover, serum and urine resorption biomarkers and pharmacological action of ibandronate for post-menopausal osteoporosis.
Figure 2.
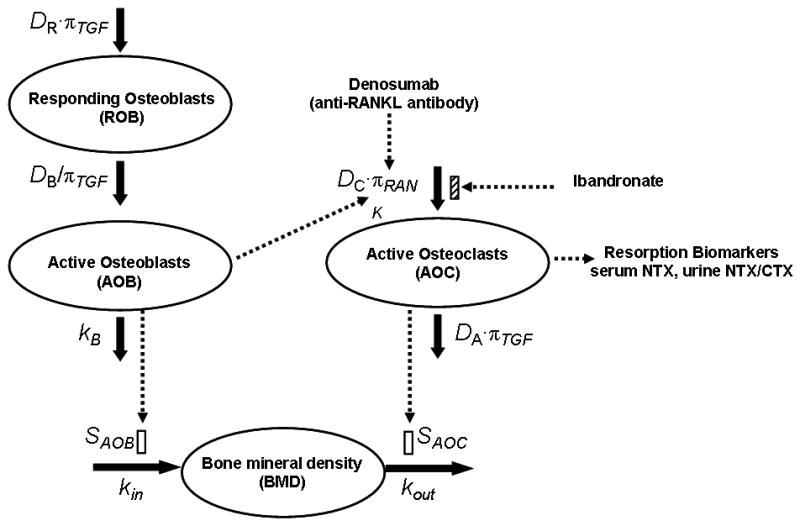
Schematic diagram of the integrated bone homeostasis model, which is adapted from Lemaire et al. [15]. The model incorporates the action of denosumab and ibandronate and links the relevant biomarkers (sNTX, uNTX, uCTX) and a clinical endpoint (BMD) to physiological state variables. Details are provided under PD model in Methods.
The model includes functional cellular components such as active osteoclasts (AOC) that are responsible for bone resorption and active osteoblasts (AOB) that stimulate bone formation. The AOC are produced from an unlimited supply of osteoclast precursors upon stimulation of a signaling pathway initiated by RANK-RANKL binding. TGF-β, which is released from the bone matrix during resorption, stimulates transformation of AOC into apoptotic cells. AOB are produced from the differentiation of responding osteoblasts (ROB), which in turn are produced by the differentiation of uncommitted progenitors. The AOB pool eventually differentiates into osteocytes and apoptotic osteoblasts. While TGF-β stimulates the production of ROB, it inhibits their differentiation into AOB. The ROB produce OPG, which binds to RANKL and thus competes with the RANK-RANKL interaction. The influence of parathyroid hormone (PTH) on the RANK-RANKL-OPG axis has also been incorporated. PTH binds to the receptors on AOB and ROB to stimulate the production of RANKL and inhibit the production of OPG [13,15].
The governing equations for the concentrations of the responding osteoblasts (CROB), the active osteoblasts (CAOB), and the active osteoclasts (CAOC) are as follows:
| (2) |
| (3) |
| (4) |
where, DR, DB and DC are the differentiation rate constants of osteoblast progenitors, ROB and osteoclast precursors, kB is the rate of elimination of AOB, and DA is the rate constant of AOC apoptosis. πTGF and πRANK are the receptor occupancies of TGF-β and RANKL. The response is proportional to the occupancy when binding results in stimulation of a cellular process and inversely proportional when binding inhibits a cellular process.
Bisphosphonates are thought to reduce resorption by altering the life-spans and action of osteoclasts and their precursors [7,8]. Thus the concentration of ibandronate in the bone compartment (Cbone) is used to inhibit the differentiation of osteoclast precursors to AOC in Eq. 4. Imax is the maximal fractional extent of inhibition, and IC50 is the ibandronate concentration producing 50% of maximal inhibition. As denosumab binds with RANKL, the RANK occupancy (πRANK) is dependent on the simultaneous binding of RANK (K), OPG (O) and denosumab (CP,deno) with RANKL (L) [13]:
| (5) |
where, is the maximum number of RANKL attached on each surface. k1, k3, and kon are association rate constants and k2, k4, and koff are dissociation rate constants for the binding of OPG, RANK and denosumab with RANKL. πPTH is the receptor occupancy of PTH. The expressions for πPTH, concentration of OPG (O),πTGF and the initial conditions for equations (2–4) were obtained from the literature [13].
As NTX and CTX are released from the bone matrix during bone resorption by AOC, serum/urine NTX and urine CTX concentrations are linked to AOC:
| (6) |
| (7) |
| (8) |
where, Eb,sNTX, Eb,uNTX and Eb,uCTX are the basal concentrations of serum/urine NTX and urine CTX corresponding to very low levels of AOC in the system relative to the steady-state baseline values of AOC (CAOC,SS). sNTXSS, uNTXSS and uCTXSS are the steady-state baseline values of biomarkers, and n is the Hill coefficient.
Bone mineral density is described as a turnover process with active osteoblasts and active osteoclasts stimulating the production and degradation processes as:
| (9) |
where kin is a zero-order production rate constant, kout is the first-order degradation rate constant, and SAOB and SAOC are the coefficients for stimulation by AOB and AOC.
Data Analysis
The denosumab PK model (Fig. 1A; Eq. 1) was fitted to the mean serum concentration-time profiles. The denosumab PK model and estimated parameters were fixed and the bone homeostasis model (Fig. 2; Eqs. 2–7) was fitted to the serum and urine NTX profiles after single and multiple dose administration. All of the base parameters of the cellular model, with the exception of DA and DC, were fixed to values obtained from the literature [15]. The final set of estimated parameters included DA, Eb,sNTX and Eb,uNTX. DC was calculated as a secondary term in order to maintain steady-state baseline conditions: (DC = DAπTGF SSCAOCSS/πRANKSS). The Hill coefficient, n was fixed to 1. The turnover model (Fig. 2; Eqs. 2–5, 9) was fitted to BMD data with multiple-dosing of denosumab. The PK parameters and DA were fixed to earlier estimates obtained in the analysis and kout, SAOB and SAOC were estimated. kin was calculated to maintain steady-state baseline conditions (kin = kout (1 + SAOCCAOC,SS)BMDSS (1+ SAOB CAOB,SS)). Ibandronate concentration in the bone (Cbone) was set to zero for the analyses of denosumab dynamics. The urine CTX concentration-time profiles upon ibandronate administration were fitted using the proposed model (Fig. 2; Eqs. 2–5, 8). In this case, Cbone was described using a previously published PK model [8]. The estimated parameters included DA, Eb,uCTX and IC50. Imax was fixed to 1 and the Hill coefficients (h and n) were fixed to 2 and 5. Serum denosumab concentrations (CP,deno) were set to zero to represent the absence of this drug for this scenario. Baseline values for all biomarkers and BMD measurements were obtained from patient demographic information reported in data source literature [8–10].
Model parameters were estimated using the maximum likelihood method in ADAPT5 (beta-version) computer program [16]. The variance model was defined as:
| (10) |
where VARi is the variance of the ith data point, σ1 and σ2 are the variance parameters, and Yi is the model predicted concentration or response. σ1 was fixed to 0.0001 and 0 for the PK and PD variance models. The goodness of fit was assessed by Akaike Information Criterion, Schwarz Criterion, examination of residuals, and visual inspection of the fitted curves.
Results
Single Dose Denosumab PK
The mean serum concentration-time profiles of denosumab and fitted curves after single subcutaneous (SC) administration of six different dose levels in healthy postmenopausal women are shown in Figure 3. The proposed one-compartmental model with linear and non-linear Michaelis-Menten elimination characterized the serum concentrations of the drug reasonably well for a wide range of dose levels. Parameter estimates are listed in Table II. Vmax was fixed to a value that was obtained during the initial runs. As expected for drugs with very specific targets contributing as sites of distribution in the body, the estimated volume of the central compartment (77.9 mL/kg) is slightly larger than plasma volume [17].
Figure 3.
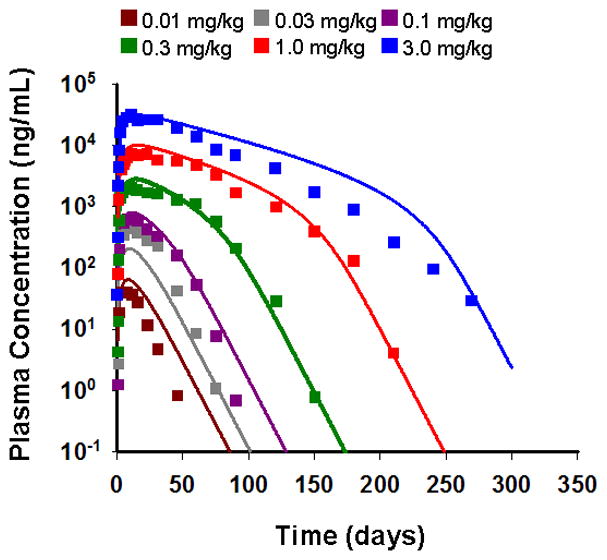
Observed and model-fitted PK profiles of denosumab after six single SC doses of 0.01, 0.03, 0.1, 0.3, 1.0, and 3.0 mg/kg in healthy postmenopausal women. Symbols represent mean data from the literature [9] and lines are the fitted profiles.
Table II.
Pharmacokinetic parameter estimates for denosumab in healthy postmenopausal women.
| Parameter (units) | Final Estimate | CV% |
|---|---|---|
| ka (day−1) | 0.170 | 2.7 |
| kel (day−1) | 1.15 × 10⁻² | 0.554 |
| Vc/F (mL/kg) | 77.9 | 1.55 |
| Km (ng/mL) | 411 | 1.35 |
| Vmax (ng/kg/day) | 2672 a | - |
fixed parameter based on preliminary analysis.
Single Dose Denosumab PD: Bone Resorption
The time-courses of the percentage change from baseline in concentrations of NTX in serum and urine and their fitted curves after six single SC doses in healthy postmenopausal women are shown in Figure 4. The PK profiles (Fig. 3) were fixed as driving functions for the pharmacodynamics. The integrated model incorporates denosumab binding to RANKL leading to inhibition of RANK-RANKL interaction (Eq. 5). This reduces the active osteoclast pool which results in a decrease in serum and urine NTX biomarkers. Correspondingly, both biomarker profiles show a decline in concentration followed by a gradual increase toward baseline as the drug is washed out from the system. The model captured the time-courses of NTX concentrations reasonably well given the variability in the observed data with simultaneous fitting. The final estimated parameters are listed in Table III, and low CV% values were obtained for all fitted parameters. The fits, obtained using the full integrated model, are comparable to those obtained with a basic indirect response (IDR) model (Supplemental Fig. S1, Table S1).
Figure 4.
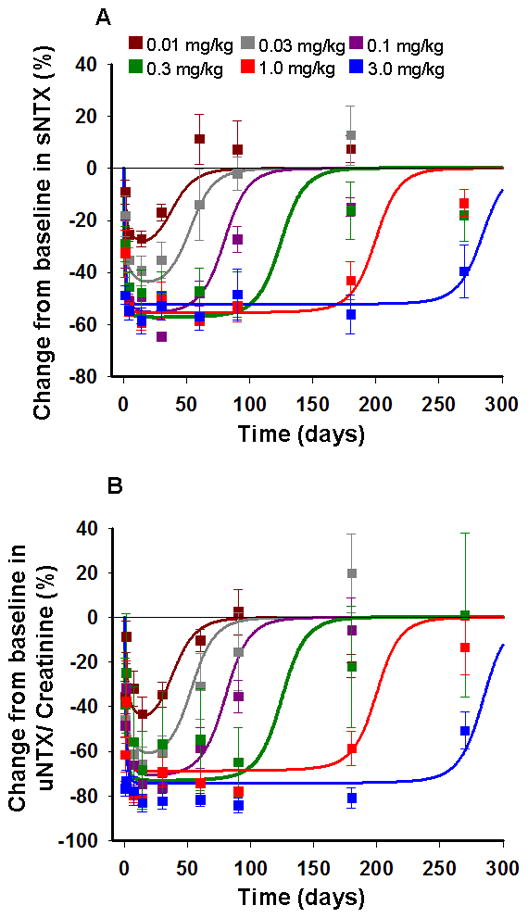
Change from baseline in NTX in serum (A) and urine (B) following six single SC doses of denosumab at 0.01, 0.03, 0.1, 0.3, 1.0, and 3.0 mg/kg in healthy postmenopausal women. Symbols represent mean data and standard errors from the literature [9] and lines are model-fitted profiles using the integrated bone homeostasis model.
Table III.
Denosumab pharmacodynamic parameter estimates for serum/urine NTX in healthy postmenopausal women (PMW) and urine NTX in postmenopausal women with low bone mineral density, using integrated bone homeostasis model.
| Parameter (units) | Final Estimate | CV% |
|---|---|---|
| Healthy PMW | ||
| DA (day−1) | 9.55 | 17.7 |
| Eb,sNTX (nM) | 7.24 | 4.49 |
| Eb,uNTX(nmol/mmolCr) | 14.4 | 4.67 |
| PMW with low BMD | ||
| DA (day−1) | 9.55 a | - |
| Eb,uNTX(nmol/mmolCr) | 23.0 | 3.40 |
fixed parameter based on fitted biomarker (NTX) data in healthy PMW.
Multiple Dosing Denosumab PD: Bone Resorption Biomarker
The time-courses of the percentage change from baseline in urine NTX and fitted curves for three SC dose levels administered every 3 months in a multiple dosing schedule in postmenopausal women with low BMD are shown in Figure 5. The pharmacokinetic model obtained from fitting the data for healthy postmenopausal women was used as a driving function for the pharmacodynamics. As denosumab PK is not available for postmenopausal women with low BMD, and with the absence of data to suggest any differences, it was assumed that the PK in this population is similar to healthy postmenopausal women. The model captured the time course of urine NTX reasonably well, and the profiles are also in agreement with a basic IDR model (Fig. S2, Table S2). Both models over predict the response at later times (over 500 days) for higher dose levels. Although no data are available, the increase in urine NTX at later times could be indicative of disease progression or tolerance against drug action [13]. The base value of urine NTX (Eb,uNTX) was estimated as 23 nM (Table III), and DA was fixed to the value obtained previously.
Figure 5.
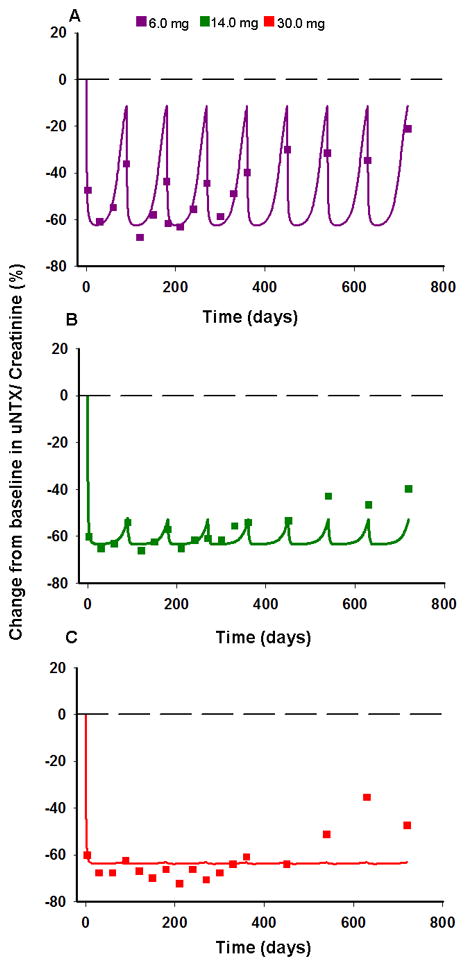
Change from baseline in urine NTX/creatinine after multiple SC dosing of denosumab. Regimens are 6 (A), 14 (B), and 30 mg (C) of denosumab given every 3 months to postmenopausal women with low BMD. Symbols represent data from the literature [10] and lines represent model-fitted profiles using the integrated bone homeostasis model.
Multiple Dosing Denosumab PD: Bone Mineral Density
The time-courses of the percentage change from baseline in lumbar spine bone mineral density (BMD) and their fitted curves after three SC dose levels administered every 3 months in a multiple dosing schedule in postmenopausal women with low BMD are shown in Figure 6. An increase in BMD is observed upon administration of multiple denosumab doses. The integrated bone turnover model, with osteoblasts stimulating bone production and osteoclasts stimulating resorption, captures the increase in BMD reasonably well for the 6 and 30 mg dose levels. DA was fixed to 9.55 day−1 as before. The final estimated parameters are listed in Table IV. Similar to the bone turnover biomarkers, a basic IDR model can also describe the time course of BMD following denosumab treatment (Fig. S3, Table S3).
Figure 6.
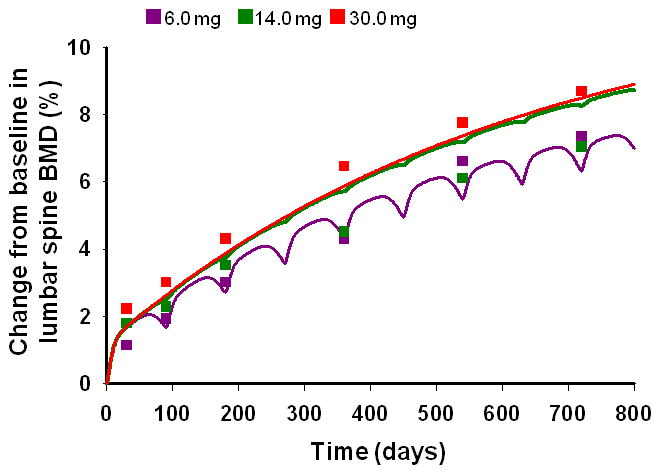
Change from baseline in lumbar spine BMD after multiple SC doses of denosumab. Regimens are 6, 14, and 30 mg of denosumab given every 3 months to postmenopausal women with low BMD. Symbols represent data from the literature [10] and lines represent model-fitted profiles using the integrated bone homeostasis model.
Table IV.
Denosumab pharmacodynamic parameter estimates for lumbar spine bone mineral density (BMD) in postmenopausal women with low BMD, using integrated bone homeostasis model.
| Parameter (units) | Final Estimate | CV% |
|---|---|---|
| DA (day−1) | 9.55 a | - |
| kout (day−1) | 1.61 × 10⁻³ | 46.5 |
| SAOB (pM−1) | 1214 | 87.7 |
| SAOC (pM−1) | 790 | 65.2 |
fixed parameter from fitted biomarker (NTX) data reported in Table III.
Multiple Dosing Ibandronate PD: Bone Resorption Biomarker
The temporal profiles of the percentage change from baseline in the concentration of urine CTX and their fitted curves after four IV dose levels administered every 3 months in a multiple dosing schedule in postmenopausal women with osteopenia are shown in Figure 7. The linear 4-compartmental PK model from Pillai and colleagues [8] was used as a driving function for the pharmacodynamics. The model with ibandronate inhibiting the production of active osteoclasts (Eq. 4), captured the time-course of urine CTX reasonably well for all four dose levels. The predicted profiles show a decrease in CTX concentrations corresponding to a decrease in the AOC pool followed by a smooth increase in concentrations to baseline as the drug is washed out from the system. This profile is also consistent with a basic IDR model (Fig. S4, Table S4). The final estimated parameters for the integrated model are listed in Table V. The maximum inhibition of osteoclast, Imax was fixed to 1 based on the initial estimates. A lower value of 0.842 day−1 for the rate of apoptosis of AOC (DA) was obtained compared to estimates for denosumab. Interestingly, the estimated IC50 value (522 ng/L) is similar to the estimated value (370 ng/L) reported by Pillai and colleagues [8].
Figure 7.
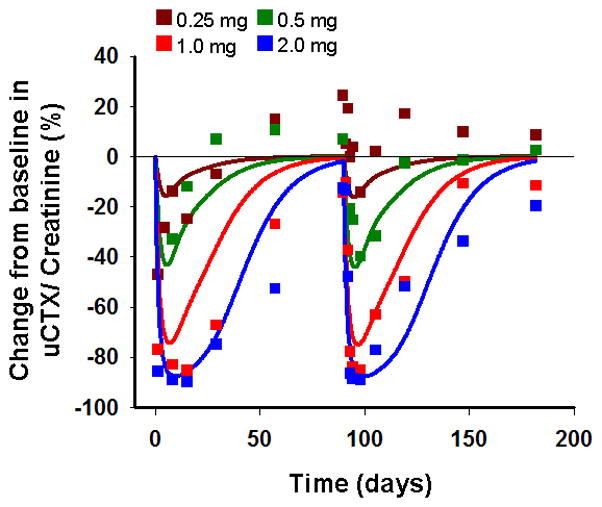
Change from baseline in urine CTX/creatinine following four IV doses of 0.25, 0.50, 1.0 and 2.0 mg of ibandronate every 3 months in postmenopausal women with osteopenia. Symbols represent mean data from the literature [8] and lines represent model-fitted profiles using the integrated bone homeostasis model.
Table V.
Ibandronate pharmacodynamic parameter estimates for urine CTX in postmenopausal women with osteopenia, using integrated bone homeostasis model.
| Parameter (units) | Final Estimate | CV% |
|---|---|---|
| DA (day−1) | 0.842 | 15.2 |
| Imax | 1 a | - |
| h | 2 b | - |
| IC50 (ng/L) | 522 | 8.74 |
| Eb,uCTX (μg/mmolCr) | 31 | 28.7 |
| n (dimensionless) | 5 b | - |
fixed parameter based on indirect response model theory [22].
fixed parameter based on preliminary analysis.
Discussion
This study incorporates a mechanistic approach to modeling the biological pathways involved in the bone remodeling process, and successfully links the pharmacological action of ibandronate and denosumab with critical biomarkers and clinical endpoints in the treatment of osteoporosis. The current model (Fig. 2) is robust in being able to incorporate the distinct mechanisms of action of these two therapeutic agents. A previous version of the model was used to characterize denosumab PD in multiple myeloma patients [13] and in this study the extended model was used to characterize the data from postmenopausal women with low bone mineral density. The model has a clear advantage of including common features of bone biology while accounting for differences in pathways and targets across therapeutic interventions.
The integrated model captured the time-course of bone resorption biomarkers, serum and urine NTX, after single and multiple denosumab administration reasonably well (Figs. 4 and 5). The fitted profiles were comparable to those obtained from basic indirect response models (shown in supplementary material). This underscores the utility of the model for both data characterization and providing a platform for testing the role of various molecular and cellular variables in regulating drug response and disease progression. As an example, we previously demonstrated that the model predicts an attenuation of denosumab response with an up-regulation in RANKL which could result from simple disease progression [13]. Various physiological processes like decline in estrogen [6], decrease in OPG [18], and increased differentiation rate of OC precursors [7] are known to be indicative of osteoporosis development and progression. Future challenges include effectively linking the model with such biomarkers, thereby providing a mechanism-based approach for simultaneously exploring disease progression in the course of therapy.
Bisphosphonates exhibit high affinity for bone mineral surfaces and their accumulation at resorption sites reduce resorption by affecting osteoclast precursors [8]. These drugs are also absorbed by osteoclasts in the resorptive cavities and reduce osteoclast activity possibly by reducing the life span of these cells [7]. Based on these hypotheses, several model permutations were evaluated for ibandronate, including: i) drug inhibiting the differentiation of osteoclast precursors (DC), ii) drug stimulating the rate of apoptosis of AOC (DA) and iii) both mechanisms acting together. The model with ibandronate inhibiting the differentiation rate of osteoclast precursors was selected based primarily on greatest model stability, best visual fits, and low standard errors obtained on parameter estimates. The maximum fractional inhibition constant (Imax) was fixed to 1 (indicating the potential for complete inhibition), as it was initially estimated close to this value and was correlated with drug potency (IC50). The Hill coefficients in the inhibition function (h) and the transfer function relating the AOC to CTX (n) were fixed to 2 and 5. This was needed to describe the sharp decrease in CTX concentrations, which is likely due to the mechanisms of action of bisphosphonates and the relative homogeneity in target tissue affinity [19]. Based on the high initial estimate for n and the fact that values greater than 5 are not identifiable with good precision, n was fixed to this limiting value. Other values were evaluated for h as well; however, fixing h to 2 provided a good fit to the data and reasonable precision on the remaining estimated terms. The rate of apoptosis of AOC obtained for ibandronate (DA = 0.842 day−1) was about 10-fold lower than the value obtained for denosumab, and is associated with lower values of DC for ibandronate. Such differences can partly be attributed to different study designs and patient population, which is not accounted for in the current model. It is probable that DA and DC change in a continuous manner, and future work will be needed to evaluate changing baseline characteristics in the model based on disease severity in different patient populations.
There are several limitations to the present analysis. As individual data were not available, the final model was developed using mean and median literature reported data. The more desirable approach would be to apply the model to patient level data using nonlinear mixed effects modeling. We have attempted to link a theoretical cell-based model to understand macro-scale pharmacodynamic data. This is a formidable challenge and the focus of intense research. The next steps may be to reduce the model, or identify methods for striking a balance between fixed and fitted parameters in a population-based analysis. Another limitation is that the model does not appear to capture the observed difference in BMD profiles following 14 and 30 mg dose levels of denosumab (Fig. 6). The minimal difference between these doses is expected from the model since, at these dose levels, the suppression in AOC tends towards saturation which is also reflected in the observed and predicted biomarker profiles. The discrepancy observed between the BMD responses for 14 and 6 mg doses as reflected in the mean data could perhaps have been better understood by conducting a population analysis utilizing individual level drug exposures [10]. Finally, comparisons of bone turnover dynamics across multiple measurement platforms must be done cautiously. Fortunately, similar methodologies were utilized in the present collection of studies, and transforming the data to/from percent change may facilitate cross-platform analyses. Although bone mineral density is considered the gold standard for response to remodeling agents and forms the basis for a primary endpoint in drug approvals, some reports suggest that increases in BMD may not adequately reflect architectural preservation of bone, and continued significant fracture risk may exist [20,21]. Further modeling efforts are needed to understand the relationship(s) between BMD and changes in fracture risk.
A potential utility of the final model (Fig. 2) in drug development is the anticipation of long-term clinical endpoint dynamics (e.g., BMD profiles) from changes in short-term biomarker data. We combined prior system specific parameters (from BMD data following denosumab treatment) with ibandronate specific parameters (from short-term biomarker data analysis) to explore and predict changes in BMD following ibandronate therapy (Fig. S5). In addition, a more mechanistic model might prove useful for ascertaining the determinants of long-term drug effects in the presence of disease progression.
Conclusion
In conclusion, an integrated bone homeostasis model has been extended to characterize the time-courses of clinical biomarkers following treatment with denosumab and ibandronate in postmenopausal women with bone loss. The structural model can incorporate multiple pathways of therapeutic intervention by drugs that have distinct pharmacology and mechanism of action. This might aid a mechanistic model-based approach for designing and analyzing current and prospective therapeutic strategies for osteoporosis and other osteolytic diseases.
Supplementary Material
Acknowledgments
Sponsor: Grant GM57980 from the National Institutes of Health (D.E.M.).
This study was supported, in part, by an Amgen Postdoctoral Fellowship (A.M.) and Grant GM57980 from the National Institutes of Health (D.E.M.).
Abbreviations
- sNTX
serum N-telopeptide
- uNTX
urine N-telopeptide
- uCTX
urine C-telopeptide
- OPG
osteoprotegrin
- PK
pharmacokinetics
- PD
pharmacodynamics
- RANK
receptor activator of nuclear factor-κB
- RANKL
RANK ligand
- PTH
parathyroid hormone
- SC
subcutaneous
- OB
osteoblast
- ROB
responding osteoblast
- AOB
active osteoblast
- OC
osteoclast
- AOC
active osteoclast
- PMW
postmenopausal women
- BMD
bone mineral density
Footnotes
None of the authors declare any competing financial interests that could be perceived as influencing this research.
References
- 1.National Osteoporosis Foundation. Clinician’s Guide to Prevention and Treatment of Osteoporosis. 2008. [Google Scholar]
- 2.Lewiecki EM. Managing osteoporosis: challenges and strategies. Cleve Clin J Med. 2009;76:457–466. doi: 10.3949/ccjm.76a.09019. [DOI] [PubMed] [Google Scholar]
- 3.Filvaroff E, Derynck R. Bone remodelling: a signalling system for osteoclast regulation. Curr Biol. 1998;8:R679–682. doi: 10.1016/s0960-9822(98)70434-8. [DOI] [PubMed] [Google Scholar]
- 4.Aubin JE, Bonnelye E. Osteoprotegerin and its ligand: A new paradigm for regulation of osteoclastogenesis and bone resorption. Medscape Womens Health. 2000;5:5. [PubMed] [Google Scholar]
- 5.Boyle WJ, Simonet WS, Lacey DL. Osteoclast differentiation and activation. Nature. 2003;423:337–342. doi: 10.1038/nature01658. [DOI] [PubMed] [Google Scholar]
- 6.Clowes JA, Riggs BL, Khosla S. The role of the immune system in the pathophysiology of osteoporosis. Immunol Rev. 2005;208:207–227. doi: 10.1111/j.0105-2896.2005.00334.x. [DOI] [PubMed] [Google Scholar]
- 7.Rodan GA, Martin TJ. Therapeutic approaches to bone diseases. Science. 2000;289:1508–1514. doi: 10.1126/science.289.5484.1508. [DOI] [PubMed] [Google Scholar]
- 8.Pillai G, Gieschke R, Goggin T, Jacqmin P, Schimmer RC, Steimer JL. A semimechanistic and mechanistic population PK-PD model for biomarker response to ibandronate, a new bisphosphonate for the treatment of osteoporosis. Br J Clin Pharmacol. 2004;58:618–631. doi: 10.1111/j.1365-2125.2004.02224.x. [DOI] [PMC free article] [PubMed] [Google Scholar]
- 9.Bekker PJ, Holloway DL, Rasmussen AS, et al. A single-dose placebo-controlled study of AMG 162, a fully human monoclonal antibody to RANKL, in postmenopausal women. J Bone Miner Res. 2004;19:1059–1066. doi: 10.1359/JBMR.040305. [DOI] [PubMed] [Google Scholar]
- 10.Lewiecki EM, Miller PD, McClung MR, et al. Two-year treatment with denosumab (AMG 162) in a randomized phase 2 study of postmenopausal women with low BMD. J Bone Miner Res. 2007;22:1832–1841. doi: 10.1359/jbmr.070809. [DOI] [PubMed] [Google Scholar]
- 11.Cremers SC, Pillai G, Papapoulos SE. Pharmacokinetics/pharmacodynamics of bisphosphonates: use for optimisation of intermittent therapy for osteoporosis. Clin Pharmacokinet. 2005;44:551–570. doi: 10.2165/00003088-200544060-00001. [DOI] [PubMed] [Google Scholar]
- 12.Peterson MC, Riggs MM. A physiologically based mathematical model of integrated calcium homeostasis and bone remodeling. Bone. 2009;46:49–63. doi: 10.1016/j.bone.2009.08.053. [DOI] [PubMed] [Google Scholar]
- 13.Marathe A, Peterson MC, Mager DE. Integrated cellular bone homeostasis model for denosumab pharmacodynamics in multiple myeloma patients. J Pharmacol Exp Ther. 2008;326:555–562. doi: 10.1124/jpet.108.137703. [DOI] [PMC free article] [PubMed] [Google Scholar]
- 14.Pedrazzoni M, Girasole G, Bertoldo F, et al. Definition of a population-specific DXA reference standard in Italian women: the Densitometric Italian Normative Study (DINS) Osteoporos Int. 2003;14:978–982. doi: 10.1007/s00198-003-1521-1. [DOI] [PubMed] [Google Scholar]
- 15.Lemaire V, Tobin FL, Greller LD, Cho CR, Suva LJ. Modeling the interactions between osteoblast and osteoclast activities in bone remodeling. J Theor Biol. 2004;229:293–309. doi: 10.1016/j.jtbi.2004.03.023. [DOI] [PubMed] [Google Scholar]
- 16.D’Argenio DZ, Schumitzky A. ADAPT II User’s Guide. Biomedical Simulation Resource; Los Angeles, California: 1997. [Google Scholar]
- 17.Lobo ED, Hansen RJ, Balthasar JP. Antibody pharmacokinetics and pharmacodynamics. J Pharm Sci. 2004;93:2645–2668. doi: 10.1002/jps.20178. [DOI] [PubMed] [Google Scholar]
- 18.Bucay N, Sarosi I, Dunstan CR, et al. osteoprotegerin-deficient mice develop early onset osteoporosis and arterial calcification. Genes Dev. 1998;12:1260–1268. doi: 10.1101/gad.12.9.1260. [DOI] [PMC free article] [PubMed] [Google Scholar]
- 19.Hoffman A, Goldberg A. The relationship between receptor-effector unit heterogeneity and the shape of the concentration-effect profile: pharmacodynamic implications. J Pharmacokinet Biopharm. 1994;22:449–468. doi: 10.1007/BF02353789. [DOI] [PubMed] [Google Scholar]
- 20.Li Z, Chines AA, Meredith MP. Statistical validation of surrogate endpoints: is bone density a valid surrogate for fracture? J Musculoskelet Neuronal Interact. 2004;4:64–74. [PubMed] [Google Scholar]
- 21.Seeman E. Is a change in bone mineral density a sensitive and specific surrogate of anti-fracture efficacy? Bone. 2007;41:308–317. doi: 10.1016/j.bone.2007.06.010. [DOI] [PubMed] [Google Scholar]
- 22.Sharma A, Jusko WJ. Characterization of four basic models of indirect pharmacodynamic responses. J Pharmacokinet Biopharm. 1996;24:611–635. doi: 10.1007/BF02353483. [DOI] [PubMed] [Google Scholar]
Associated Data
This section collects any data citations, data availability statements, or supplementary materials included in this article.


