

Abstract
Background
Ongoing clinical trials are using early response to IV tPA to stratify patients into endovascular therapies. Little is known about the likelihood of early recovery and its correlation with final stroke outcome.
Methods
We analyzed the NINDS t-PA dataset for patients with early improvement (EI), a change of ≥4 or score 0 on the 2-hour NIHSS, to predict good 90-day outcome. We adjusted for multiple confounders and divided the patients by baseline NIHSS 0–10, 11–20, >20 and stroke type to analyze if EI predicted good outcome across stroke severities and types. We analyzed different EI thresholds to identify the best level of NIHSS change to predict good 90-day outcome using a Receiver Operator Characteristic (ROC).
Results
In total 183/624 (29.3%) patients had EI, 112/312 (35.9%) in the tPA and 71/312 (22.7%) in the placebo groups (p<0.0001). Smokers (p=0.012) and patients treated under 90 minutes (p=0.008) were more likely; diabetics (p=0.023) less likely to show EI. The baseline NIHSS (mean±SD) of patients with EI was 16.1±6.5 versus 14.3±7.4 (p=0.001).
A 90-day mRS of 0–1 was achieved in 68/112 (60.7%) tPA treated patient with EI and 65/200 (32.5%) without (placebo groups 30/71 (42.3%) versus 53/241 (22.0%)). The adjusted odds ratio for good outcome was 1.71 (95% CI: 1.1,2.6, p=0.011) for t-PA treatment and 7.69 (4.63, 12.76, p<0.0001) for early improvement.
EI predicted good outcome in patients with cardioembolic (13.6(3.6–51.5)) and small vessel (6.98(2.86–17.03), but not large vessel stroke (1.82(0.38–8.59). The ROC showed that a threshold of 4 on the NIHSS for prediction of good outcome had a sensitivity of 84% and 36% specificity.
Conclusion
Early improvement was more common in t-PA treated patients and associated with good 90 day outcome. While 32.5% of non-responders after t-PA had a good 90 day outcome, the use of EI to predict stroke outcome shows value.
Keywords: Acute Cerebral Infarction, Emergency treatment of Stroke, Thrombolysis
Introduction
Intravenous (IV) thrombolysis (tPA) after stroke leads to good clinical outcome in fewer than half of those treated within 4.5 hours.1, 2 Recent advances in neuroprotective and endovascular therapies are used to enhance this therapeutic effect.3 Many investigators advocate the use of a stepwise process in therapeutic decision making: administer IV tPA and consider further therapies in patients who fail to improve immediately after IV treatment.4
In past clinical trials of IV tPA, however, clinical response was determined during the physical exam at 3 months. The decision to add further therapies in the setting of acute stroke has to be made within minutes or hours.5
It is not known if the early clinical exam can predict outcome at 3 months. Before allowing clinical trials that make decisions based on patient exam findings within minutes or hours after IV tPA, more knowledge is needed to determine if the early response to IV tPA can reliably predict final outcome.
We present data from the NINDS tPA trials to show if the clinical response at 2 hours after IV tPA bolus predicts good clinical outcome at 3 months.
Methods
We analyzed data from the NINDS tPA trials, the only clinical trials of IV tPA after acute ischemic stroke with a placebo arm and clinical outcome measures in the acute phase (2 hours after IV tPA or placebo bolus). We compared the basic demographics between placebo and tPA treated patients regarding age, sex, race, weight, blood pressure, baseline NIHSS, history of diabetes, previous stroke/TIA, smoking, aspirin use, atrial fibrillation and time to treatment using Wilcoxon Rank Sum tests for continuous measures and Fisher’s Exact Test for binary measures.
An EI of ≥4 points or NIHSS of 0 was used in the general analysis and good outcome at 90 days was defined as a mRS of 0 or 1. We used multivariable logistic regression model to evaluate the relationship between early improvement at 2 hours and good outcome after adjusting for pre-specified variables, namely, baseline age, rt-PA treatment, history of diabetes and baseline NIHSS. We performed a Receiver Operator Characteristics (ROC) analysis with c-statistic (Area under curve (AUC)) plotting the false positive to true positive rate of good outcome prediction in relationship to NIHSS thresholds of EI.
The effect of EI was analyzed for three levels of stroke severity (Cardioembolic stroke (CES), Small Vessel Occlusive Disease (SVD) and Large Vessel Atherosclerosis (LVA)), as well as NIHSS at baseline (0–10, 11–20 and >20).
All analyses were two sided and a p-value of 0.05 was considered to be statistically significant. Analysis was done with the software R 2.10.0.
Results
We analyzed 312 IV tPA and 312 placebo treated patients across the two NINDS trials. Aspirin use was more common (p=0.002), weight (kg) lower (76.2±15.7 versus 80.0±19.2, p=0.009) and age (years) higher (68.0±11.3 versus 65.9±11.9, p=0.023) in tPA treated patients when compared to placebo patients.6
Of the total 624 patients 125 had CES, 241 SVD and 61 LVA. The rate of tPA use was similar in each stroke type groups. The baseline NIHSS was 0–10 in 209 patients, 11–20 in 275 and >20 in 140.
We identified 183 patients with and 441 without early improvement. (Figure 1) Patients with early improvement were more likely to have a higher baseline NIHSS (16.1±6.5 versus 14.3±7.4, p=0.001), less likely to have diabetes (15.3% versus 23.6%, p=0.023), more likely to smoke (42.6% versus 31.7%, p=0.012) and more likely to be treated between 0 and 90 minutes, versus 91–180 (56.8% vs 44.9%, p=0.008). (Table 1)
Figure 1.

Scatter plot of NIHSS for all 624 patients at baseline and 2 hour after tPA or placebo. Blue circles = Patients with improvement (NIHSS ≥4 or 0); Red circles = without
Table 1.
Baseline characteristics between patients with and without Early Improvement (NIHSS ≥4 or 0 at 2 hours)
| Early improvement (n=183) | No Early improvement (n=441) | p-value | |
|---|---|---|---|
| Baseline NIHSS | 16.1±6.5 | 14.3±7.4 | 0.001* |
| Male (%) | 60.1 | 57.1 | 0.533 |
| Race (% white) | 66.7 | 63.7 | 0.567 |
| Age in years (±SD) | 65.8±11.5 | 67.4±11.7 | 0.104 |
| Weight in kg (±SD) | 77.8±17.7 | 78.2±17.6 | 0.702 |
| Prior stroke (%) | 30.6 | 32.7 | 0.639 |
| Hypertension (%) | 63.7 | 67.1 | 0.456 |
| Diabetes (%) | 15.3 | 23.6 | 0.023* |
| Current smoker (%) | 42.6 | 31.7 | 0.012* |
| Aspirin use (%) | 30.1 | 36.5 | 0.139 |
| Atrial fibrillation (%) | 14.4 | 20.3 | 0.089 |
| Time to treatment in 0–90 minutes (%) | 56.8 | 44.9 | 0.008* |
p<0.05
Patients treated with tPA were more likely to have early improvement compared to non-treated patients. In the placebo arm 71/312 (22.8%) had improvement at 2 hours, versus 112/312 (35.9%) in the tPA treated groups (p<0.0001).
In the group of patients with early improvement, 98/183 (53.6%) had a 90-day mRS of 0–1, versus 118/441 (26.8%) without early improvement. Within the tPA treated groups 68/112 (60.7%) of patients with early improvement, versus 65/200 (32.5%) without early improvement had a 90-day mRS of 0–1. In the placebo groups 30/71 (42.3%) with and 53/241 (22.0%) without early improvement had a 90-day mRS of 0–1. (Table 2)
Table 2.
Day 90 mRS and EI (≥4 or 0) in all patients, patients treated and not treated with IV tPA (for statistical significance, please see multivariate analysis).
| Early Improvement | Yes | No | |
|---|---|---|---|
|
| |||
| All patients | 183 | 441 | |
|
| |||
| 90-day mRS | 0–1 (%) | 98 (53.6) | 118 26.8) |
|
| |||
| 2–6 | 85 (46.5) | 323 (73.2) | |
|
| |||
| tPA patients | 112 | 200 | |
|
| |||
| 90-day mRS | 0–1 (%) | 68 (60.7) | 65 (32.5) |
|
| |||
| 2–6 | 44 (39.3) | 135 (67.5) | |
|
| |||
| Placebo patients | 71 | 241 | |
|
| |||
| 90-day mRS | 0–1 (%) | 30 (42.3) | 53 (22.0) |
|
| |||
| 2–6 | 41 (57.8) | 188 (78.0) | |
The multivariable logistic regression analysis found a significant effect of IV tPA treatment (odds ratio 1.71 (95% CI: 1.1,2.6, p=0.011), early improvement 7.69 (4.63, 12.76, p<0.0001), age 0.98 (0.96, 0.99, p=0.012), baseline NIHSS 0.8 (95% CI: 0.76,0.83, p<0.0001) on the 90-day mRS of 0–1.
Examining the effect of EI in relationship to baseline NIHSS and stroke subtype, we found that an EI of ≥4 points or NIHSS=0 on the NIHSS at 2 hours predicted good outcome patients with a baseline NIHSS 0–10, 11–20 and >20. The odds ratio (CI 95%) for a 90-day mRS of 0–1 was 4.46(1.85, 10.73), 10.5(5.36–20.56) and 6.99 (1.3–37.59). Early improvement predicted good outcome in patients with CES (13.59(3.59–51.45)) and SVD (6.98(2.86–17.03), but not LVA (1.82 (0.38–8.59). (Table 3)
Table 3.
Odds ratios (95%CI) for a 90 day mRS of 0–1 from a multivariate logistic regression model. Age, t-PA use, baseline NIHSS and diabetes were used as independent variables.
| Variable | Overall n=624 |
NIHSS (0–10) n=209 |
NIHSS 11–20 n=275 |
NIHSS >20 n=140 |
CES n=125 |
SVD n=241 |
LVA n=61 |
|---|---|---|---|---|---|---|---|
| t-PA treatment | 0.58(0.39–0.88)* | 0.68(0.36–1.30) | 0.58(0.30–1.12) | 0.44(0.09–2.24) | 0.43(0.16–1.17) | 1.06(0.50–2.25) | 0.53(0.16–1.74) |
| EI (≥4 or 0) | 0.13(0.08–0.22)** | 0.22(0.09–0.54)** | 0.10(0.05–0.19)** | 0.14(0.03–0.77)* | 0.07(0.02–0.28)** | 0.14(0.06–0.35)** | 0.55(0.12–2.60) |
| Age | 1.02(1.01–1.04)* | 0.99(0.96–1.01) | 1.06(1.03–1.09)** | 1.06(1.00–1.14) | 1.03(0.98–1.08) | 1.04(1.01–1.08)* | 1.00(0.95–1.04) |
| Diabetes | 1.23(0.74–2.04) | 1.60(0.76–3.35) | 1.06(0.48–2.34) | 0.75(0.42–4.68) | 1.59(0.51–4.97) | 1.17(0.45–3.07) | 1.09(0.26–4.51) |
| Baseline NIHSS | 1.26(1.20–1.31)** | 1.41(1.20–1.66)** | 1.20(1.06–1.37)** | 0.97(0.78–1.21) | 1.27(1.15–1.40)** | 1.35(1.24–1.47)** | 1.19(1.00–1.42)** |
CES= Cardioembolic stroke, SVD= Small Vessel Occlusive Disease, LVA= Large Vessel Atherosclerosis;
p<0.05;
p<0.001
The ROC to examine the threshold of EI that best predicts good outcome is shown in Figure 2. Using a threshold of ≥4 or NIHSS=0 (alternative 2 or 8), the sensitivity for predicting good outcome was 84%, the specificity 36% (alternative 70 and 52% or 94 and 15%). Further analysis of ROC for EI in patients across three levels of baseline NIHSS and stroke types is shown in figures 3 and 4.
Figure 2.

ROC of EI using different NIHSS thresholds at 2 hours after t-PA or placebo (EI = Change in NIHSS ≥2, 4, 8 or NIHSS=0).
Figure 3.
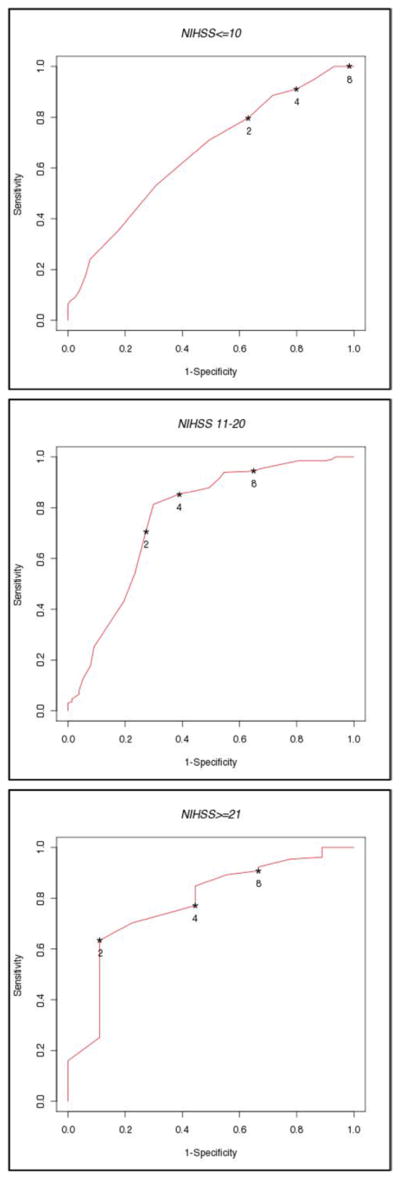
ROC of the neurological improvement using different NIHSS thresholds for EI at 2 hours in patients with baseline NIHSS <10, 11–20 and >20.
Figure 4.
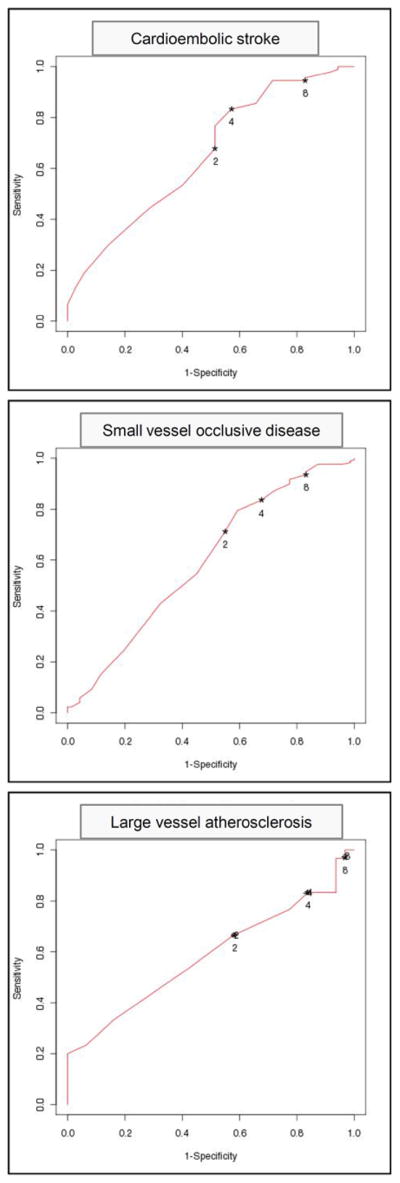
ROC of the neurological improvement using different NIHSS thresholds for EI at 2 hours in patients with CE, SVD and LVA.
Discussion
Analyzing the only trials that included a placebo group and measured neurological status before and 2 hours after IV tPA bolus, we find that early improvement is more common in tPA treated patients. Despite this association, one out of three (32.5%) patients who received IV tPA and did not show improvement at 2 hours, had a good 90-day clinical outcome.
The approval of IV tPA after stroke was based on 3 month outcome measures.1 Our study strengthens the recommendation that caution should be use extrapolating early treatment response to final stroke outcome. Most studies that have examined early response to tPA focused on clinical findings 24 hours after stroke.7 In clinical practice, however, decisions regarding additional therapies after stroke must be made within minutes to a few hours when additional neuroprotection or tissue salvage is still possible.8
Imaging surrogates to predict final clinical outcome are still lagging proven validity, reliability and are not readily available at most medical centers.9
Limitations of our study include that the data was from a trial concluded in 1995 and current medical therapy and changes in risk factor distribution may have changed the treatment responses. A recent smaller and prospective study, however, showed similar findings.10 Another limitation is the definition of clinical improvement requiring a change of ≥4 points on the NIHSS. As illustrated in Figure 1, patients with low baseline NIHSS may have been less likely to meet this criterion. Therefore patients with low baseline NIHSS may not have been captured in our analysis as improved unless they reached an NIHSS of 0 at 2 hours. We addressed this concern by analyzing EI across different ranges of baseline NIHSS and found that an EI of ≥4 or NIHSS=0 predict good outcome across the range of NIHSS. (Table 3)
In our general analysis we used a threshold of ≥4 or NIHSS=0 to define EI. To examine if other thresholds may have predicted good outcome (90-day mRs 0–1) better we performed a ROC of EI thresholds. This analysis showed that a threshold of with a 4 improvement or NIHSS=0 showed a high sensitivity (84%), but low specificity (34%) to predict good 90-day outcomes. Using a cutoff of 2 or 8 would have either lowered specificity to 70% in the former or sensitivity to 15% in the later. (Figure 2) The ROC analysis, however, demonstrates that no single definition for EI has high specificity and sensitivity for the prediction of good final outcome. This limits the use of any certain definition for good early improvement to predict good final stroke outcome.
While in the analysis of all patients a cutoff of ≥2 or NIHSS = 0 had sensitivity and specificity of 50% to predict good outcome (Figure 2), patients with a baseline NIHSS of 11–20 had a 70% sensitivity and specificity for good outcome, patients with a baseline NIHSS >20 had 65% sensitivity and 90% specificity.
Based on this data, caution must be used before basing the decision about additional therapies after ischemic stroke following IV tPA administration on changes in NIHSS at 2 hours.
In conclusion, we found that early improvement is associated with final clinical outcome but caution should be used before clinical decisions are based on early therapeutic responses to therapies that were reviewed by regulatory agencies based on 3 month treatment responses. Further analysis is required to better understand and define an early treatment response after stroke that is likely to benefit from additional interventions.
Acknowledgments
Funding source: SPORTIAS NIH P50NS044148
Footnotes
Disclosures:
None
Contributor Information
Thomas M Hemmen, University of California, San Diego.
Karin Ernstrom, University of California, San Diego.
Rema Raman, University of California, San Diego.
References
- 1.Tissue plasminogen activator for acute ischemic stroke. New England Journal of Medicine. 1995;333:1581–1588. doi: 10.1056/NEJM199512143332401. [DOI] [PubMed] [Google Scholar]
- 2.Hacke W, Furlan AJ, Al-Rawi Y, Davalos A, Fiebach JB, Gruber F, et al. Intravenous desmoteplase in patients with acute ischaemic stroke selected by mri perfusion-diffusion weighted imaging or perfusion ct (DIAS-2): A prospective, randomised, double-blind, placebo-controlled study. Lancet Neurol. 2009;8:141–150. doi: 10.1016/S1474-4422(08)70267-9. [DOI] [PMC free article] [PubMed] [Google Scholar]
- 3.The interventional management of stroke (IMS II study) Stroke. 2007;38:2127–2135. doi: 10.1161/STROKEAHA.107.483131. [DOI] [PubMed] [Google Scholar]
- 4.Tomsick TA, Khatri P, Jovin T, Demaerschalk B, Malisch T, Demchuk A, et al. Equipoise among recanalization strategies. Neurology. 2010;74:1069–1076. doi: 10.1212/WNL.0b013e3181d76b8f. [DOI] [PMC free article] [PubMed] [Google Scholar]
- 5.Broderick JP. Endovascular therapy for acute ischemic stroke. Stroke. 2009;40:S103–106. doi: 10.1161/STROKEAHA.108.533067. [DOI] [PubMed] [Google Scholar]
- 6.Tissue plasminogen activator for acute ischemic stroke. The national institute of neurological disorders and stroke rt-pa stroke study group. N Engl J Med. 1995;333:1581–1587. doi: 10.1056/NEJM199512143332401. [DOI] [PubMed] [Google Scholar]
- 7.Boddu DB, Srinivasarao Bandaru VC, Reddy PG, Madhusudan M, Rukmini MK, et al. Predictors of major neurological improvement after intravenous thrombolysis in acute ischemic stroke: A hospital-based study from south india. Neurol India. 2010;58:403–406. doi: 10.4103/0028-3886.66085. [DOI] [PubMed] [Google Scholar]
- 8.Zivin JA. Factors determining the therapeutic window for stroke. Neurology. 1998;50:599–603. doi: 10.1212/wnl.50.3.599. [DOI] [PubMed] [Google Scholar]
- 9.Albers GW, Thijs VN, Wechsler L, Kemp S, Schlaug G, Skalabrin E, et al. Magnetic resonance imaging profiles predict clinical response to early reperfusion: The diffusion and perfusion imaging evaluation for understanding stroke evolution (defuse) study. Ann Neurol. 2006;60:508–517. doi: 10.1002/ana.20976. [DOI] [PubMed] [Google Scholar]
- 10.Muresan IP, Favrole P, Levy P, Andreux F, Marro B, Alamowitch S. Very early neurologic improvement after intravenous thrombolysis. Arch Neurol. 2010;67:1323–1328. doi: 10.1001/archneurol.2010.265. [DOI] [PubMed] [Google Scholar]