

Abstract
To facilitate an increase in the amount of data on minority subjects collected for genetic databases, the authors attempted to clarify barriers to African-American participation in genetic studies. They randomly sampled 78,072 subjects from the community (Missouri Family Registry, 2002–2007). Of these, 28,658 participated in a telephone screening interview, 3,179 were eligible to participate in the genetic study, and 1,919 participated in the genetic study. Response rates were examined in relation to the proportion of subjects in the area who were African-American according to US Census 2000 zip code demographic data. Compared with zip codes with fewer than 5% African Americans (average = 2% African-American), zip codes with at least 60% African Americans (average = 87% African-American) had higher proportions of subjects with an incorrect address or telephone number but lower proportions of subjects who did not answer the telephone and subjects who refused the telephone interview (P < 0.0001). Based on reported race from the telephone screening, 71% of eligible African Americans and 57% of eligible European Americans participated in the genetic study (P < 0.0001). The results of this study suggest that increasing the number of African Americans in genetic databases may be achieved by increasing efforts to locate and contact them.
Keywords: African Americans, consumer participation, data collection, genetic association studies, genetics, minority groups
The majority of genetic studies are constructed with samples of homogeneous populations of European descent. There are 2 primary explanations for low numbers of ethnic minorities in genetic databases. In part, the number of minority subjects mirrors the difference in population prevalence. Secondly, investigators may specifically exclude non-European Americans in order to increase statistical power to find genetic associations by creating a more uniform genetic and environmental background (1, 2). However, as the field of genetics diversifies into personalized medicine, it is essential that multiple ethnic groups be studied. It cannot be assumed that findings based on European Americans apply to other ethnic groups. Moreover, different ancestral groups can be more informative than a single population, because of variations in linkage disequilibrium leading to improved localization of potentially functional polymorphisms (3).
There is a vast body of literature describing distrust of medical research in minority populations (4). Much of this literature has focused on African-American communities, often attributing the distrust to the historical abuse of African Americans in the Tuskegee Syphilis Study (5–10). Genetic studies are thought to have a particular potential for discrimination because of the collection of genetic information. For this reason, multiple studies have examined African-American participation specifically in genetic research protocols (11–17). In these studies, subjects were recruited from a medical screening or medical study, and recruitment into the genetic protocol was evaluated by computing the proportion of participants in the medical screening who also participated in the genetic portion of the study. In all published studies, African-American subjects were statistically less likely than European Americans to participate in the genetic component of the study (11–17), although participation rates of both African Americans and European Americans were still relatively high.
Although published participation rates in genetic studies are lower among African Americans than among European Americans, there is no evidence that distrust of research leads to decreased participation rates in other medical research. A recent meta-analysis of nongenetic medical studies found similar participation rates in minority subjects as compared with European-American subjects (8). A similar study of survey research supported this finding: Once contacted, ethnic minorities were more likely to participate (18). The combination of lower African-American participation rates in genetic studies with similar participation rates in nongenetic medical studies suggests that African Americans view participation in genetic research differently than participation in surveys and other medical research.
To better understand differences in participation in genetic studies between African Americans and European Americans, we used a large, population-based sample collected for a genetic study of nicotine dependence. This study design allowed us to examine 3 distinct steps in recruitment: establishment of initial contact, participation in screening, and recruitment into the genetic study (including a blood draw). Subjects were randomly selected from the community, contacted by telephone for a screening, invited to participate in the genetic study, and then brought in to the study center to undergo an extensive interview and blood draw for genetic analysis. Prior to telephone screening, at which point ethnicity was self-defined, subjects’ ethnicities were unknown but were estimated on a population level with US Census 2000 data (http://www.census.gov/main/www/cen2000.html). By comparing ethnicity and demographic characteristics at each stage of recruitment and ascertainment, we evaluated differences between European-American and African-American participation at each step.
MATERIALS AND METHODS
Subjects
As part of the Collaborative Study on the Genetics of Nicotine Dependence (19, 20), 78,072 subjects aged 25–44 years were randomly selected from the Missouri Family Registry between 2002 and 2007. The Missouri Family Registry includes all persons with a driver's license or state identification card in St. Louis City, St. Louis County, and St. Charles County, Missouri. Variables for which data were available were gender, date of birth, and address. Zip codes with higher proportions of African Americans were oversampled to increase the numbers of African Americans in the study. After random selection, subjects were sent a letter and then contacted by phone for a brief screening interview. If determined to be eligible for the study of nicotine dependence, the subject was invited to participate in a face-to-face interview and a blood draw for genetic analysis. The research protocol was approved by the Washington University institutional review board.
Letter
In order to prepare the potential subjects for our telephone call, a letter was sent describing the study and informing them that they would be called for screening purposes (Figure 1). The same standard letter was mailed to all subjects.
Figure 1.
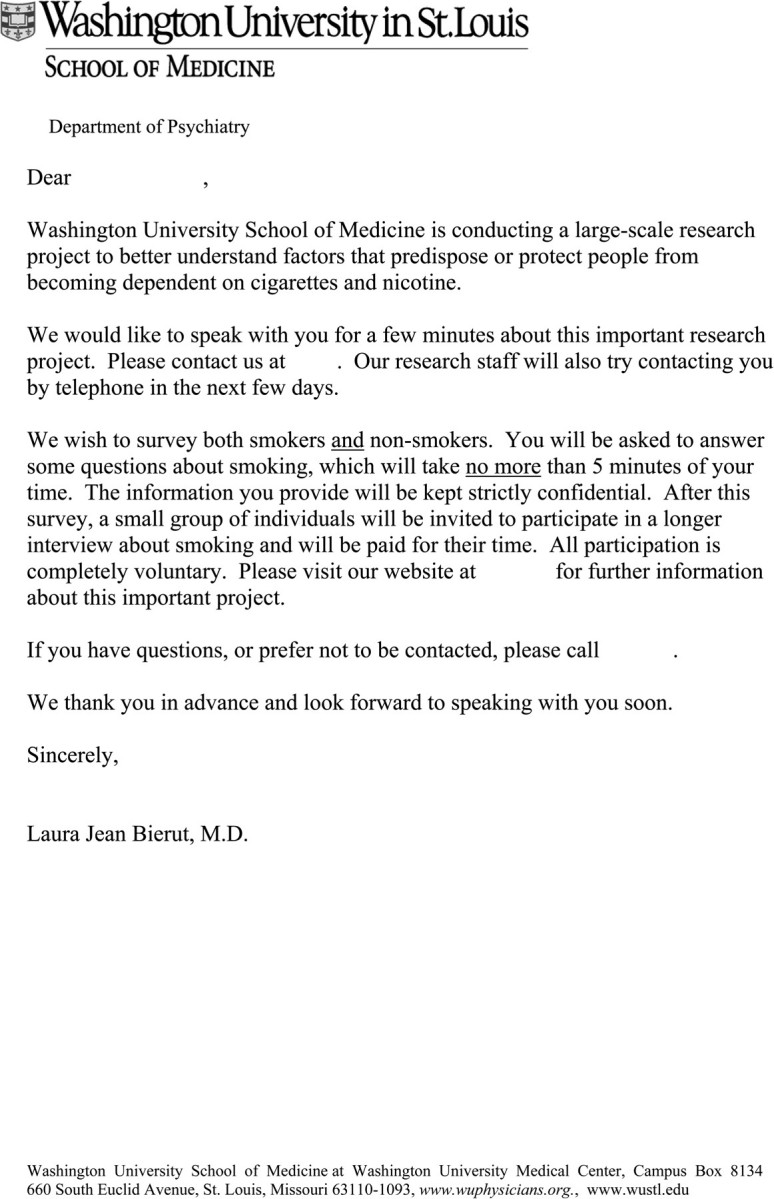
Introduction letter sent prior to a telephone screening call for a genetic study of nicotine dependence, St. Louis, Missouri, 2002–2007.
Subjects not screened
Because many subjects were unavailable or unwilling to complete the telephone screening, we evaluated whether the various reasons for lack of contact were related to ethnicity. Of the 78,072 subjects who were selected as the target population, 28,658 (37%) were screened by phone. Of the remaining subjects, we tracked the reason that the subject had not been screened, including: 1) inability to find the subject because of an incorrect address (returned letter) and/or a discontinued or inaccurate phone number; 2) no answer on the telephone after multiple attempts; and 3) refusal to participate in the telephone screening.
Although we did not know the characteristics (including ethnicity) of unscreened subjects, we compared the reasons a subject had not been screened with US Census 2000 demographic characteristics based on the subject's zip code (http://factfinder.census.gov). This particular data set was used because subjects were recruited between 2002 and 2007, and it was the closest census for which data were available. Because of the ethnic segregation by zip code in the St. Louis region, we were able to compare subjects from zip codes with less than 5% African Americans (average = 2% African-American) to subjects from zip codes with at least 60% African Americans (average = 87% African-American), inferring race based on the zip code. This allowed us to evaluate reasons for failure to contact potential subjects by estimated ethnicity.
Telephone interview
The telephone interview was designed to determine medical eligibility for a case-control study of genetic factors in nicotine dependence (19, 20) and self-identification as either European-American or African-American. The interview took, on average, 5 minutes to administer and consisted of questions regarding nicotine use, family structure (living parents or siblings), and demographic factors, including race, age, marital status, employment status, and health insurance. Eligible subjects were required to have smoked 100 cigarettes in their lifetime, to meet the definition of case/control status (a Fagerström Test for Nicotine Dependence (21) score of 0 for controls and ≥4 for cases), and to have both a living parent and a living adult full sibling. The text was not geared toward a particular ethnic group. An excerpt from a sample text of the telephone interview follows (see Figure 2, part A):
My name is… and I'm calling from Washington University. We recently sent you a letter describing our study of smoking. Did you receive the letter? Yes/no
If yes: Good; as you may recall…
If no or don't remember: Well, let me tell you a bit about the study… Washington University received funding from the National Cancer Institute to do a study on smoking. Would you be willing to take a few minutes to answer some questions? Yes/no
If yes: Participation is voluntary, and your answers will be kept strictly confidential.
Once eligibility for the genetic study had been determined, the following sample text for recruitment was read (see Figure 2, part B).
As we mentioned earlier, this is a family study of smoking, and the goal of the project is to understand why some people become addicted to cigarettes and others quit smoking or never even start to smoke. Your participation in the study would involve a completely confidential interview that includes questions about your medical history, use of alcohol and drugs, your mood and personality, and your family's smoking history. This takes approximately 3 hours, and you will receive $100 for your time. Your answers will be kept strictly confidential and will not be shared with anyone outside of our research staff. We also ask that you provide a blood sample. Are you willing to participate in the study?
This text initiated a discussion about participation in the study. If a subject decided to participate, an interview was scheduled.
Figure 2.

Selection of participants for a genetic study of nicotine dependence, St. Louis, Missouri, 2002–2007. A) Initiation of the telephone interview; B) offer of study participation; C) signing of the informed consent form prior to participation in the study. Difference in participation rates between European Americans and African Americans: P < 0.0001.
On-site interview and blood draw
Eligible participants were invited to the in-person interview and blood draw for genetic studies. Prior to participation in the study, the informed consent form was read to the subjects, where the details of the genetic study and the risks of participation in a genetic study were described in depth (see Figure 2, part C).
Subjects who participated in the study completed a 4-hour in-person interview and a blood draw for later genetic analysis. Subjects received $100 in compensation for their time. The interview included an extensive history on smoking and substance use in addition to a full psychiatric, medical, and social history.
Statistical analysis
Zip codes were stratified into 4 groups based on the percentage of persons aged 25–44 years who were African-American: <5%, 5%–<30%, 30%–<60%, and ≥60%. Demographic differences in zip codes between the 4 strata of African Americans were evaluated using analysis of variance, where each zip code was weighted by the sample size within the zip code. Proportions of persons living in poverty and persons with a college degree throughout the sampled region were calculated using a weighted average of these levels across the zip codes, weighted by the number of persons sampled in the zip code. Associations between reasons for lack of contact and proportion of African Americans in a zip code were evaluated using weighted regression. Participation rate was defined as the proportion of eligible subjects who both donated blood and participated in the face-to-face interview. The χ2 test was used to statistically evaluate differences in participation rates between groups.
RESULTS
We attempted to contact 78,072 people, and we conducted telephone interviews with 28,658 (Figure 2). Although the demographic characteristics of the unscreened subjects were unknown, we tallied the reasons for lack of contact by zip code and compared these data with the US Census 2000 demographic data for the zip code (Table 1). There were 86 zip codes with at least 10 sampled persons, for a total of 77,886 persons (99.8% of the sampling frame). We stratified the zip codes by the proportion of African Americans in the zip code. Compared with zip codes with less than 5% African Americans (average proportion = 2% African-American), zip codes with at least 60% African Americans (average proportion = 87% African-American) had higher proportions of subjects with an incorrect address or phone number (51% vs. 39%, P < 0.0001) but lower proportions of subjects who did not answer the telephone despite repeated attempts (14% vs.17%, P < 0.0001) and lower proportions of subjects who refused the telephone interview (3% vs. 9%, P < 0.0001). Because the proportion of African Americans in a zip code is highly correlated with the other demographic characteristics of the zip code, the observed associations between proportion African-American and reasons for failure to contact were confounded by these demographic characteristics. In particular, the correlation between the percentage of persons under the poverty level and the proportion of African Americans in these zip codes was 0.85. Therefore, we were unable to determine whether the difficulty in contacting these subjects was due to poverty or ethnicity.
Table 1.
Characteristics of Zip Codes Sampled for a Genetic Study of Nicotine Dependence, Including Demographic Factors and Reasons for Lack of Screening, St. Louis, Missouri, 2002–2007
| % of African Americans in Zip Code |
||||||||||||
| <5 |
5–<30 |
30–<60 |
≥60 |
|||||||||
| No. | % (SD) | Mean Income, dollars (SD) | No. | % (SD) | Mean Income, dollars (SD) | No. | % (SD) | Mean Income, dollars (SD) | No. | % (SD) | Mean Income, dollars (SD) | |
| No. of zip codes | 44 | 16 | 13 | 13 | ||||||||
| No. of subjects aged 25–44 years | 299,180 | 123,404 | 21,127 | 63,139 | ||||||||
| No. of subjects sampled | 26,316 | 13,252 | 21,127 | 17,191 | ||||||||
| Average % of African Americans | 2 (1) | 12 (6) | 47 (8) | 87 (9) | ||||||||
| % of persons below poverty level**a | 4.7 (2.6) | 9.7 (5.5) | 19 (12) | 31 (13) | ||||||||
| % of college graduates** | 31 (19) | 29 (18) | 28 (13) | 10 (6) | ||||||||
| Annual per capita income, dollars** | 28,571 (12,619) | 24,093 (8,464) | 20,629 (5,236) | 13,015 (3,419) | ||||||||
| Recruitment outcome | ||||||||||||
| Participated in telephone interview* | 35 (8) | 37 (4) | 35 (7) | 32 (6) | ||||||||
| Refused telephone interview** | 9 (5) | 7 (3) | 5 (2) | 3 (1) | ||||||||
| Did not answer telephone** | 17 (6) | 16 (2) | 14 (2) | 14 (1) | ||||||||
| Incorrect address or telephone no.** | 39 (12) | 39 (7) | 46 (9) | 51 (7) | ||||||||
Abbreviation: SD, standard deviation.
* P < 0.05; **P < 0.0001.
P value for difference between proportions of African Americans, based on weighted regression.
To evaluate whether the subjects participating in the study represented the general population, we compared some demographic characteristics of the participating subjects with those of the sampled region estimated from the US Census 2000 data. The proportions of subjects living under the poverty line in our sample were 38% of African Americans and 16% of European Americans, as compared with the US Census 2000 rates of 25% of African Americans and 10% of European Americans (for the sampled region). The proportions of subjects with a college degree in our sample were 11% of African Americans and 43% of European Americans, as compared with the US Census 2000 rates of 18% of African Americans and 30% of European Americans. Although our sample in the genetic study appears to have been different from a random sample selected from the community, it is interesting that the participating subjects had higher rates of poverty and African Americans had lower proportions of college degrees than the region overall. This suggests that the recruited sample of African Americans was not a more selectively advantaged population than the sampled region.
The participation rate, calculated by dividing the number of persons who participated in the genetic study by the number eligible, was significantly lower in European Americans than in African Americans (57% vs. 71%, P < 0.0001). This difference was driven by the higher rate of participation by African-American cases (76% participation) than by African-American controls (63% participation), although both of these rates were higher than the European-American participation rates of 57% in cases and 58% in controls.
The demographic characteristics of the subjects who completed telephone screening and qualified for the study are given in Table 2. In both European-American and African-American populations, subjects with some college education were more likely to participate than subjects without any college education (P < 0.001). In European Americans, women were more likely to participate than men (P < 0.001), and unemployed subjects were more likely to participate in the genetic study than employed subjects (P < 0.05). There was no difference between the younger age group and the older age group. In African Americans, there were no statistical differences between participants and nonparticipants in terms of gender, age, or employment.
Table 2.
Demographic Characteristics of Screened Subjects Who Qualified for a Genetic Study of Nicotine Dependence, by Ethnicity, St. Louis, Missouri, 2002–2007
| European Americans |
African Americans |
|||
| % Participation | No. | % Participation | No. | |
| Gendera | ||||
| Male | 52**b | 997 | 71 | 276 |
| Female | 61** | 1,475 | 72 | 430 |
| Age group, years | ||||
| 25–34 | 60 | 893 | 74* | 256 |
| 35–44 | 56 | 1,580 | 70* | 450 |
| Education | ||||
| High school diploma or less | 54** | 704 | 73 | 406 |
| Beyond high school | 61** | 1,769 | 56 | 300 |
| Employment status | ||||
| Unemployed | 70* | 83 | 77* | 108 |
| Employed | 57* | 2,390 | 70* | 598 |
| Total | 57 | 2,473 | 71 | 706 |
* P < 0.05; **P < 0.001.
Information on gender was missing for 1 European American.
P value for test of difference between participation rates within each ethnic group.
DISCUSSION
Using data collected for a large genetic study of nicotine dependence, we traced subjects from random selection in the community through participation in a telephone interview and finally recruitment into the genetic study. This comprehensive design enabled us to evaluate which steps posed barriers in the recruitment of African Americans into genetic studies. First, we found considerable difficulty in locating subjects who lived in zip codes with higher proportions of African Americans because of changes of address or phone number. However, with a correct phone number, these subjects were more likely to answer the phone and more likely to participate in the telephone interview. Finally, when identified as eligible, African Americans were more likely to participate in the genetic study than European Americans. This suggests that the willingness to participate in genetic studies is not a significant barrier. In contrast, our data suggest that the strongest barrier is the establishment of initial contact. These results are consistent with findings in nongenetic studies, where locating minority subjects is the critical barrier to obtaining their participation (8, 18). This suggests that strategies developed in medical and survey research would also be effective for the recruitment of ethnic minorities into genetic studies (22). In particular, targeting geographic regions (e.g., census blocks) with a high prevalence of minority households or otherwise oversampling minorities from a known sampling frame will increase contact rates among minorities at a given level of effort/cost in community-based surveys. Additionally, extending the number of telephone contact attempts, sending out additional mailings, and extending the data collection period have proven to be effective techniques for overcoming low contact rates and increasing recruitment of minorities for research, though at a higher cost (18, 23).
To clarify the discrepancy between our findings and the literature highlighting lower participation of African Americans in genetic studies, we examined the published participation rates in the published genetic studies (11–17). Two of these 7 studies were population-based, as ours was, and the remaining 5 were other medical studies that requested that the person participate in the genetic component. None of these studies ascertained substance dependence or other psychiatric illness. Although all published genetic studies had significantly lower participation rates (P < 0.05) among African Americans as compared with European Americans (11–17), the magnitude of the difference between participation rates was small relative to the sample size of the individual studies (Table 3). Therefore, the hypothesis that willingness to participate does not seem to be a barrier in genetic studies is supported by previously published literature.
Table 3.
Participation Rates in Published Genetic Studies, by Ethnicity, 2000–2008
| Study | Population | European Americans |
African Americans |
|||
| No. of Persons in Sample | Participation Ratea, % | No. of Persons in Sample | Participation Ratea, % | No. of Additional Subjectsb | ||
| Aagaard-Tillery, 2006 (11) | Women enrolled in a study of pregnancy-related venous thromboembolism who consented to unrestricted use of maternal and fetal DNA | 1,727 | 76 | 1,682 | 74 | 34 |
| Espeland, 2006 (12) | Volunteers for a study of type 2 diabetes | 2,706 | 92 | 666 | 82 | 67 |
| Ford, 2006 (13) | Colorectal cancer patients | 1,055 | 63 | 23 | 44 | 4 |
| Green, 2006 (14) | Participants in a multiethnic study of atherosclerosis | 2,493 | 97 | 1,739 | 92 | 87 |
| McQuillan, 2006 (15) | Participants in the National Health and Nutrition Examination Survey who consented to “future genetic research” | 2,878 | 90 | 1,026 | 88 | 21 |
| Mezuk, 2008 (16) | Participants in the Baltimore, Maryland, portion of the Epidemiologic Catchment Area Study who consented to “future genetic research” | 662 | 83 | 374 | 82 | 4 |
| Williams, 2000 (17) | Participants in the Family Heart Study who consented to “future DNA testing” | 1,875 | 98 | 1,965 | 89 | 177 |
All participation rates in African Americans were significantly lower (P < 0.05) than participation rates in European Americans.
The additional number of African Americans who would be included in the study if the participation rate in African Americans were the same as that in European Americans.
A limitation of our study is that we did not know the precise demographic characteristics of the unscreened subjects. We reduced this limitation by comparing the zip codes of the unscreened subjects and the reasons for lack of screening with demographic data on subjects aged 25–44 years from US Census 2000. Although there was an association between the proportion of people we failed to contact and the proportion of African Americans in a zip code, this association was highly confounded by poverty and other socioeconomic variables. Therefore, we were unable to separate the contributions of ethnicity and poverty at the step prior to contact. Interestingly, during community recruitment for a study involving an invasive test, low-income European Americans were found to be the most difficult to contact (24). This suggests that poverty, rather than ethnicity, may be the dominant force behind the difficulty with locating and contacting subjects.
Subjects may have passively avoided participation in our study by either refusing the telephone screening or declining to answer the phone. Interestingly, avoiding contact was inversely correlated with proportion of African Americans in the zip code: The highest rates of both refusing the telephone screening and not answering the phone were in the zip codes with the lowest proportion of African Americans.
As we expand genetic databases to include more minority populations, it is important to understand potential barriers to minority recruitment. It is widely believed that minority populations in the United States, particularly African Americans, have a distrust of genetic research that leads to lower participation rates (7). In contrast, we found that eligible African Americans participate in genetic studies as frequently as European Americans. The major barrier to minority recruitment in our study was the fact that African Americans were more difficult to locate in the community. Notably, because of decreased access of African Americans to health care in comparison with European Americans (25), recruitment of African Americans at clinical centers is likely to be less representative than community-based recruitment. Although addressing feelings of distrust of medical and genetic research in minorities may remain important generally, our study suggests that increasing the participation of African Americans in genetic databases may be achieved by increasing efforts to locate and contact them.
Acknowledgments
Author affiliations: Department of Psychiatry, School of Medicine, Washington University, St. Louis, Missouri (Sarah M. Hartz, Laura J. Bierut); Behavioral Health and Criminal Justice Research Division, Research Triangle Institute International, Research Triangle Park, North Carolina (Eric O. Johnson); Department of Genetics, School of Medicine, Washington University, St. Louis, Missouri (Nancy L. Saccone); Department of Psychiatry, Tobacco Use Research Center, University of Minnesota, Minneapolis, Minnesota (Dorothy Hatsukami); and Department of Epidemiology, College of Human Medicine, Michigan State University, East Lansing, Michigan (Naomi Breslau).
The authors represent investigators in the Collaborative Study on the Genetics of Nicotine Dependence.
This work was supported by National Institutes of Health grants P01 CA089392 from the National Cancer Institute, U01 HG004422 from the National Human Genome Research Institute, R01 DA019963 and K02 DA021237 from the National Institute on Drug Abuse, and T32 MH014677 from the National Institute of Mental Health, and by Clinical and Translational Science Award UL1RR024992.
The funding organizations had no role in the design and conduct of the study; in the collection, analysis, and interpretation of the data; or in the preparation, review, or approval of the manuscript.
Dr. Laura J. Bierut is listed as an inventor on US patent 20070258898 (“Markers of Addiction”), covering the use of certain single nucleotide polymorphisms in determining the diagnosis, prognosis, and treatment of addiction. Dr. Nancy L. Saccone is the spouse of Dr. Scott Saccone, who is also listed as an inventor on the above patent. Dr. Bierut acted as a consultant for Pfizer, Inc., in 2008.
References
- 1.Maris JM, Mosse YP, Bradfield JP, et al. Chromosome 6p22 locus associated with clinically aggressive neuroblastoma. N Engl J Med. 2008;358(24):2585–2593. doi: 10.1056/NEJMoa0708698. [DOI] [PMC free article] [PubMed] [Google Scholar]
- 2.Pankratz N, Wilk JB, Latourelle JC, et al. Genomewide association study for susceptibility genes contributing to familial Parkinson disease. Hum Genet. 2009;124(6):593–605. doi: 10.1007/s00439-008-0582-9. [DOI] [PMC free article] [PubMed] [Google Scholar]
- 3.Saccone NL, Wang JC, Breslau N, et al. The CHRNA5-CHRNA3-CHRNB4 nicotinic receptor subunit gene cluster affects risk for nicotine dependence in African-Americans and in European-Americans. Cancer Res. 2009;69(17):6848–6856. doi: 10.1158/0008-5472.CAN-09-0786. [DOI] [PMC free article] [PubMed] [Google Scholar]
- 4.Katz RV, Wang MQ, Green BL, et al. Participation in biomedical research studies and cancer screenings: perceptions of risks to minorities compared with whites. Cancer Control. 2008;15(4):344–351. doi: 10.1177/107327480801500409. [DOI] [PMC free article] [PubMed] [Google Scholar]
- 5.Braunstein JB, Sherber NS, Schulman SP, et al. Race, medical researcher distrust, perceived harm, and willingness to participate in cardiovascular prevention trials. Medicine (Baltimore) 2008;87(1):1–9. doi: 10.1097/MD.0b013e3181625d78. [DOI] [PubMed] [Google Scholar]
- 6.Gamble VN. Under the shadow of Tuskegee: African Americans and health care. Am J Public Health. 1997;87(11):1773–1778. doi: 10.2105/ajph.87.11.1773. [DOI] [PMC free article] [PubMed] [Google Scholar]
- 7.Murphy EJ, Wickramaratne P, Weissman MM. Racial and ethnic differences in willingness to participate in psychiatric genetic research. Psychiatr Genet. 2009;19(4):186–194. doi: 10.1097/YPG.0b013e32832cec89. [DOI] [PMC free article] [PubMed] [Google Scholar]
- 8.Wendler D, Kington R, Madans J, et al. Are racial and ethnic minorities less willing to participate in health research? PLoS Med. 2006;3(2):e19. doi: 10.1371/journal.pmed.0030019. . doi: 10.1371/journal.pmed.0030019. [DOI] [PMC free article] [PubMed] [Google Scholar]
- 9.Branson RD, Davis K, Jr, Butler KL. African Americans’ participation in clinical research: importance, barriers, and solutions. Am J Surg. 2007;193(1):32–39. doi: 10.1016/j.amjsurg.2005.11.007. [DOI] [PubMed] [Google Scholar]
- 10.Shavers VL, Lynch CF, Burmeister LF. Racial differences in factors that influence the willingness to participate in medical research studies. Ann Epidemiol. 2002;12(4):248–256. doi: 10.1016/s1047-2797(01)00265-4. [DOI] [PubMed] [Google Scholar]
- 11.Aagaard-Tillery K, Sibai B, Spong CY, et al. Sample bias among women with retained DNA samples for future genetic studies. Obstet Gynecol. 2006;108(5):1115–1120. doi: 10.1097/01.AOG.0000241536.19539.14. [DOI] [PubMed] [Google Scholar]
- 12.Espeland MA, Dotson K, Jaramillo SA, et al. Consent for genetics studies among clinical trial participants: findings from Action for Health in Diabetes (Look AHEAD) Clin Trials. 2006;3(5):443–456. doi: 10.1177/1740774506070727. [DOI] [PMC free article] [PubMed] [Google Scholar]
- 13.Ford BM, Evans JS, Stoffel EM, et al. Factors associated with enrollment in cancer genetics research. Cancer Epidemiol Biomarkers Prev. 2006;15(7):1355–1359. doi: 10.1158/1055-9965.EPI-05-0816. [DOI] [PubMed] [Google Scholar]
- 14.Green D, Cushman M, Dermond N, et al. Obtaining informed consent for genetic studies: the Multiethnic Study of Atherosclerosis. Am J Epidemiol. 2006;164(9):845–851. doi: 10.1093/aje/kwj286. [DOI] [PubMed] [Google Scholar]
- 15.McQuillan GM, Pan Q, Porter KS. Consent for genetic research in a general population: an update on the National Health and Nutrition Examination Survey experience. Genet Med. 2006;8(6):354–360. doi: 10.1097/01.gim.0000223552.70393.08. [DOI] [PubMed] [Google Scholar]
- 16.Mezuk B, Eaton WW, Zandi P. Participant characteristics that influence consent for genetic research in a population-based survey: the Baltimore Epidemiologic Catchment Area follow-up. Community Genet. 2008;11(3):171–178. doi: 10.1159/000113880. [DOI] [PMC free article] [PubMed] [Google Scholar]
- 17.Williams RR, Rao DC, Ellison RC, et al. NHLBI Family Blood Pressure Program: methodology and recruitment in the HyperGEN network. Ann Epidemiol. 2000;10(6):389–400. doi: 10.1016/s1047-2797(00)00063-6. [DOI] [PubMed] [Google Scholar]
- 18.Feskens R, Hox J, Lensvelt-Mulders G, et al. Collecting data among ethnic minorities in an international perspective. Field Methods. 2006;18(3):284–304. [Google Scholar]
- 19.Bierut LJ, Madden PA, Breslau N, et al. Novel genes identified in a high-density genome wide association study for nicotine dependence. Hum Mol Genet. 2007;16(1):24–35. doi: 10.1093/hmg/ddl441. [DOI] [PMC free article] [PubMed] [Google Scholar]
- 20.Saccone SF, Hinrichs AL, Saccone NL, et al. Cholinergic nicotinic receptor genes implicated in a nicotine dependence association study targeting 348 candidate genes with 3713 SNPs. Hum Mol Genet. 2007;16(1):36–49. doi: 10.1093/hmg/ddl438. [DOI] [PMC free article] [PubMed] [Google Scholar]
- 21.Heatherton TF, Kozlowski LT, Frecker RC, et al. The Fagerström test for nicotine dependence: a revision of the Fagerström tolerance questionnaire. Br J Addict. 1991;86(9):1119–1127. doi: 10.1111/j.1360-0443.1991.tb01879.x. [DOI] [PubMed] [Google Scholar]
- 22.Davis RM, Hitch AD, Nichols M, et al. A collaborative approach to the recruitment and retention of minority patients with diabetes in rural community health centers. Contemp Clin Trials. 2009;30(1):63–70. doi: 10.1016/j.cct.2008.09.007. [DOI] [PubMed] [Google Scholar]
- 23.Steffen AD, Kolonel LN, Nomura AM, et al. The effect of multiple mailings on recruitment: the Multiethnic Cohort. Cancer Epidemiol Biomarkers Prev. 2008;17(2):447–454. doi: 10.1158/1055-9965.EPI-07-2576. [DOI] [PubMed] [Google Scholar]
- 24.Burroughs AR, Visscher WA, Haney TL, et al. Community recruitment process by race, gender, and SES gradient: lessons learned from the Community Health and Stress Evaluation (CHASE) study experience. J Community Health. 2003;28(6):421–437. doi: 10.1023/a:1026029723762. [DOI] [PubMed] [Google Scholar]
- 25.Agency for Healthcare Research and Quality, US Department of Health and Human Services. 2009 National Healthcare Quality Report. Rockville, MD: Agency for Healthcare Research and Quality; 2010. (AHRQ publication no. 10-0003) [Google Scholar]