

Abstract
Motivation: Off-target activity commonly exists in RNA interference (RNAi) screens and often generates false positives. Existing analytic methods for addressing the off-target effects are demonstrably inadequate in RNAi confirmatory screens.
Results: Here, we present an analytic method assessing the collective activity of multiple short interfering RNAs (siRNAs) targeting a gene. Using this method, we can not only reduce the impact of off-target activities, but also evaluate the specific effect of an siRNA, thus providing information about potential off-target effects. Using in-house RNAi screens, we demonstrate that our method obtains more reasonable and sensible results than current methods such as the redundant siRNA activity (RSA) method, the RNAi gene enrichment ranking (RIGER) method, the frequency approach and the t-test.
Contact: xiaohua_zhang@merck.com
Supplementary information: Supplementary data are available at Bioinformatics online.
1 INTRODUCTION
RNAi high-throughput screening (HTS) is broadly used in the identification of genes associated with specific biological phenotypes (Brass et al., 2008; Bard et al., 2006; Elbashir et al., 2001; Konig et al., 2008; Klinghoffer et al., 2009; Nybakken et al., 2005; Pelkmans et al., 2005; Zhao et al., 2010; Zhou et al., 2008). However, false positives generated by non-specific effects can lead to false leads and the use of resources to explore non-productive research tracks (Birmingham et al., 2006; Jackson et al., 2003; Konig et al., 2007). To reduce the impact of off-target effects (i.e. the RNAi-mediated event in which unintended mRNAs with sequence homology to the RNAi oligonucleotide are degraded) in the screening process, researchers typically examine the collective activity of multiple siRNAs (i.e. siRNA duplexes, also called siRNA singles) with different sequences against a single target gene (Blow, 2008; Echeverri et al., 2006). The major reason for doing so is that the off-target effects of these siRNAs are likely to have different directions and thus may be cancelled out in their collective activity, whereas the on-target effects of these siRNAs should be in the same direction and may have substantial magnitude (at least not be cancelled out) when considered collectively.
Accordingly, analytic methods try to capture the collective activity of multiple siRNAs targeting the same gene. The straightforward analytic method is the so-called ‘frequency approach’. Generally, a gene is selected as a hit if at least 25% of the siRNAs against the gene are selected as hits (for example, two out of seven siRNAs) (Barbie et al., 2009; Glaser and Ferrer, 2010). The frequency approach has two major issues: (i) it may produce contradictory results: a gene may be selected as both upregulated and downregulated hits and (ii) it does not directly assess all the collective activity.
Recently, Konig et al. (2007) proposed the RSA method in which they examine the rank distribution of all siRNAs targeting a gene and calculate the statistical significance (or P-value) of all siRNAs targeting a gene being unusually distributed toward the top ranking slots based on an iterative hypergeometric distribution equation. A single P-value is associated with a gene so that all siRNAs for the same gene are assigned an identical P-value. A feature of this approach is that a gene with multiple moderately active siRNAs is weighted more heavily than a gene with fewer active siRNAs. A potential barrier for applying this approach is that it requires two arbitrary thresholds to initially define active siRNAs and negative siRNAs. Barbie et al. (2009) proposed the RIGER method that does not need such arbitrary thresholds. The RIGER method assigns an enrichment score for a given gene according to the distribution of measured values of its siRNAs within the rank list of all siRNAs using a two-sample weighted ‘Zc’ statistic based on the likelihood ratio (Zhang, 2002). The P-value corresponding to the enrichment score for each gene is calculated.
In both RSA and RIGER methods, the null distribution is formed from all the siRNAs in the entire list in an experiment. However, to limit experimental cost, many genome-scale RNAi screens do not use multiple siRNAs against a gene in the primary screen. In fact, most genome-scale RNAi screening projects start with a primary screen where thousands of siRNA pools (three to four siRNA duplexes per well) are investigated with or without replicates. The hits from the primary screen without replicates are usually investigated in one or more confirmatory screens where each pool has replicates. The genes selected from either primary or confirmatory screens are further investigated by designing multiple siRNAs per gene in a screen. The screen in which the phenotypic effects of multiple siRNAs per targeted gene are measured separately is called a deconvolution screen. Therefore, most of the genes included in a deconvolution screen should have non-zero effects. Consequently, both RSA and RIGER methods are suitable for a primary screen where most siRNAs should have no or very small effects. They are inappropriate for a deconvolution screen where all siRNAs are pre-selected to have a large effect.
We present a method using the strictly standardized mean difference (SSMD) to directly assess collective activity of multiple siRNAs targeting a gene. SSMD can also be applied to one siRNA pool or one siRNA (Zhang, 2010a, 2007; Zhang et al., 2007, 2010). To distinguish these two types of SSMD, we use cSSMD to denote the SSMD for collective activity of multiple siRNAs. Like RSA and RIGER, cSSMD captures the collective activity of multiple siRNAs against a gene, thus minimizing the impact of off-target effects. Unlike RSA and RIGER, the cSSMD method does not form the null distribution from all investigated siRNAs in a screen; thus, it works effectively for both primary and confirmatory screens with multiple siRNAs against a gene. We use three in-house RNAi screening projects to demonstrate the utility of the cSSMD method compared with the RSA, RIGER, t-test and frequency approach.
2 METHODS
2.1 Collective activity of multiple siRNAs
Suppose m siRNAs with different sequences against a target gene are measured separately. The activity of an individual siRNA on a measured response is usually represented by the difference of measured values between this siRNA and a negative reference group. Let dij denote the difference in the j-th replicate of the i-th siRNA. Assuming that the i-th siRNA has a mean value of μi , we construct the model for dij as follows:
| (1) |
where, i=1,…, m and j=1,…, ni; eij's are independently distributed with N(0, σi.e2) μi is the mean of the i-th siRNA.
The collective activity of m siRNAs is represented by the average activity of m values each drawn from one of the m siRNAs. Thus, we can investigate it as follows. For the i-th siRNA among the m siRNAs, let random variable Di represent the difference of measured values between the siRNA and a negative reference. Di has a density function fi, mean μi and variance σi2. The collective effect of the m siRNAs is represented by the difference Dcollective of measured values between an siRNA and a negative reference in a group that is formed by pooling all the m siRNAs with equal weights, i.e.  where fcollective is the density function of Dcollective. Let μcollective and σcollective2 be the mean and variance of Dcollective, respectively, and
  . Then,
| (2) |
The mean of the i-th siRNA, μi, includes its on-target effect μi.on-target and off-target effect μi.off-target. It is well known that one siRNA can have a consistently strong phenotypic effect on a gene and another siRNA can have a consistently weak phenotypic effect on the same gene regardless of the RNAi libraries used. Therefore, siRNAs targeting the same gene may have different specific on-target effects beyond the amount of on-target effect shared by all the m siRNAs. Consequently, we further partition the on-target of the i-th siRNA μi.on-target into two parts: the shared on-target effect μi.shared on-target and specific on-target effect μi.specific on-target, i.e. μi.on-target=μi.shared on-target+μi.specific on-target. Thus,  . That is, μcollective equals the shared on-target effect plus the sum of specific on-target and off-target effects averaged over the m siRNAs. When m is large, the off-target effect should be cancelled out; so is the specific on-target effect. That is,
  ; subsequently μcollective≈μshared-on-target, which indicates that the mean of collective activity of a large number of siRNAs targeting the same gene represents the shared on target effects of these siRNAs on the gene.
For the variance of Dcollective, we have, 

 . Clearly, the variance of Dcollective consists of two parts: one is
  contributed by within-siRNA variation and the other is
  contributed by between-siRNA variation. The within-siRNA variation comes from the variation of technical replicates of the same siRNAs; thus, it represents the technical or measurement variation. Meanwhile, if we treat different siRNAs targeting the same gene as a biological replicate, the between-siRNA variation represents the biological variation. For convenience, let us use σbiological2 to denote the between-siRNA variance. In a deconvolution screen, the interest is in the biological variation. Then, the SSMD for the collective activity based on biological variation is (Zhang, 2011)
 |
(3) |
Let  be sample mean of the difference in the i-th siRNA. Let
  . Then, the estimate of mean μcollective is
| (4) |
The SSMD of the collective activity Dcollective based on biological variation can be estimated using the uniformly minimal variance unbiased estimate (UMVUE) below.
 |
(5) |
2.2 Individual activity and specific effect of an siRNA
The individual activity of an siRNA (say siRNA i) can be assessed using the random variable Di representing the difference between siRNA i and a negative reference. It is trivial to make estimation and inference for the mean of Di. The estimation and inference of SSMD for Di are provided in Zhang (2008). The UMVUE estimate of SSMD for the individual activity of siRNA i is,
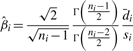 |
(6) |
where si is the sample SD of the difference in siRNA i and ni is the number of replicates that siRNA i has.
The specific effect of an individual siRNA beyond the shared on-target effect may be caused by either off-target or specific on-target effects. This specific effect is represented by the magnitude of difference between the individual siRNA and all siRNAs targeting the same gene. This magnitude difference can be addressed using the contrast variable for the main effect of the siRNA when we treat each siRNA targeting the same gene as a factor level in one-way ANOVA (Zhang, 2009). That is, the specific effect of the i-th siRNA among the m siRNAs targeting the same gene can be assessed using contrast variable
The mean of Vi is 
Therefore, τi is a combination of specific on-target effect and off-target effect of the siRNA away from the sum of specific on-target and off-target effect averaged over the m investigated siRNAs. If the sum of specific on-target and off-target effects averaged over the m investigated siRNAs is zero [i.e.  which approximately holds especially when m is large], then τi=μi.specific-on-target+μi.off-target. Thus, τi roughly represents the sum of specific on-target and off-target effects of the i-th siRNA. Whether the m siRNAs have equal or unequal variances, the estimate of τi is
  .
.
The standardized mean (i.e. SMCV) λi of Vi is  .
.
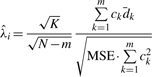
In the situation where the m siRNAs have unequal variance, the estimate of λi using the method-of-moment (MM) method is (Zhang, 2009)
 |
(7) |
In the situation where the m siRNAs have equal variance, the UMVUE estimate of λi is (Zhang, 2009),
 |
(8) |
where  ,
,  and
and 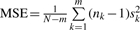 . The confidence interval of τi and λi can also be derived (Zhang, 2009).
3 RESULTS
To illustrate the utility of the cSSMD method, we applied them in three in-house RNAi projects for varicella zoster virus (VZV), diabetes and Alzheimer's diseases (AD), respectively.
3.1 VZV siRNA screening project
Following a primary screen with 3–9 replicates, 81 pools of siRNAs (most of which showed upregulated activity) were selected for further investigation in a deconvolution screen. In the deconvolution screen, each gene corresponding to one of the 81 pools was targeted by 3 or 7 siRNAs. These siRNAs were transfected into MRC-5 human lung fibroblast cells in a 384-well plate format. A forward transfection protocol was used, with a cell density of 6500 per well. Twenty-four hours later, cells were infected with virus and incubated for an additional 48 h. Cells were then fixed with formaldehyde and immunostained with an antibody to the viral capside protein gH coupled to a secondary antibody labeled with Alexa488, and counterstained with a nuclear dye (DAPI, Ex 405). The plates were then read on a scanning laser cytometer (Acumen Ex3, TTP). They were arranged in two source plates and six experimental plates were generated from each source plate. The goal in this screen was to select upregulated hits for potential cellular protein involved in viral entry and spreading.
We first applied the frequency approach to the screen. That is, for each siRNA, we estimated average fold change and SSMD [by Equation (6)] across its replicates (Zhang, 2008). The siRNA with average fold change ≥1.2 and SSMD ≥1.28 was selected as upregulated hits and those with average fold change ≤1/1.2 and SSMD ≤−1.28 was selected as downregulated hits in the siRNA level. The number of upregulated (or downregulated) hits for each gene is shown in orange (or blue) number in the top panel of Figure 1. The gene with at least 25% of its targeting siRNAs being selected as hits in the same direction in the siRNA level is selected as a hit in that direction in the gene level. Using this frequency approach, we would select 65 genes as upregulated hits and 1 gene as both upregulated and downregulated hit.
Fig. 1.

A deconvolution siRNA screen for VZV. Top: the black round point (or red +) denotes average value for an siRNA (or for all siRNAs targeting a gene); the orange (or blue) number indicates the number of siRNAs being selected as an upregulated (or downregulated) hit in the siRNA level for a gene; middle: P-values from RIGER, RSA and t-test; bottom: estimated cSSMD and average value for all siRNAs targeting a gene.
One issue with the frequency approach is that it only captures a portion of siRNAs with strong effect and ignored the information about the remaining siRNAs. Consequently, a gene selected as an upregulated hit may have two or more siRNAs with measured values in the opposite direction (e.g. Genes 2, 3, 5, 8, 9 in the top panel of Fig. 1). The extreme case is that a gene is selected as both upregulated and downregulated hits (e.g. Gene 2 shown in Figs 1 and 2). On the other hand, if all the investigated siRNAs targeting a gene have consistent moderate effects in one direction, the frequency approach may not pick this gene as a hit (e.g. Genes 53, 62, 66, 70 in the top panel of Fig. 1).
Fig. 2.

The measured fold changes relative to a negative control in each replicate of siRNAs targeting Genes 2, 53, 73 and 81, respectively. In each panel, the bars next to each other with the same color denote the fold changes in the replicates of an siRNA. A red ‘+’ denotes the average fold change of all replicates for an siRNA. ‘p.RIGER’, ‘p.RSA’ and ‘p.tTest’ denote the P-values by RIGER, RSA and t-test, respectively.
We applied both RSA and RIGER methods to the VZV screen. For the investigated genes, the P-values in the upregulated direction from either RSA or RIGER are mostly very large (the blue or red points in the middle panel of Fig. 1) and the q-values from the RIGER method are all very large >0.7. There are three genes with P<0.01 by RSA and no gene with P<0.01 by RIGER. The gene with the smallest P-value by RIGER is Gene 81 shown in Figure 2. If we used the RSA or RIGER method, we would have concluded that there are few upregulated hits in this screen. However, the frequency approach clearly indicates that a high portion of gene (i.e. 65 out of 81) were upregulated. The data for many genes are similar to those in Gene 53 shown in Figure 2. Most of the replicates in most siRNAs targeting Gene 53 had average fold change >1.2 (top panel of Fig. 2). Clearly, the data reveal that many genes have upregulated effects. Thus, the results by either RSA or RIGER in the VZV screen are misleading.
The use of classical one-side t-test yields 43 genes with P<0.01 (middle panel in Fig. 1), which matched with both the observation of the data and the results by the frequency approach better than the results by RSA or RIGER (see examples in Fig. 2). The issue with the P-value from the classical t-test is that it is affected by both effect size and sample size. For the same size of non-zero effects, the larger the sample size, the smaller the P-value. Consequently, the genes with fewer siRNAs are less likely to be selected as hits even though they may have a large effect. In the VZV screen, if we use the criterion of P<0.01 to select upregulated hits, we would miss Genes 73 and 48 that have large effects because they have three siRNAs per gene, whereas most of the remaining genes have seven siRNAs per gene (black points in the middle panel of Fig. 1).
cSSMD can directly assess the size of collective effects of multiple siRNAs targeting a gene. Thus, cSSMD represents the effect size of the targeted gene and we can apply the SSMD-based criterion (Zhang, 2009) to the estimated cSSMD values to categorize the gene effects. The calculation of cSSMD using Equation (5) is illustrated in the Supplementary Materials. Based on the estimated cSSMD values, we have 2 very strong, 5 strong, 9 fairly strong, 15 moderate, 16 fairly moderate, 16 fairly weak, 8 weak, 5 very weak, 4 extremely weak upregulated genes and 1 very weak downregulated gene in the VZV screen (Table 1). With the information about the effect sizes of genes based on the collective activity of its targeted siRNAs, we can choose the genes for further investigation based on our need. For example, in some cases, we may only focus on the 16 genes with fairly strong, strong or very strong upregulated effects. In other cases, we may focus on the 47 genes with fairly moderate or stronger upregulated effects. When using cSSMD for hit selection, we may also consider average fold change for a gene simultaneously (Zhang, 2010b).
Table 1.
The categorization of effect sizes of collective activity of multiple siRNAs targeting a gene based on estimated SSMD values
| Direction | Effect size of collective activity | Screen 1: VZV | Screen 2: Diabetes | Screen 3: AD |
|---|---|---|---|---|
| Upregulation | Extremely strong | 0 | 0 | 0 |
| Very strong | 2 | 0 | 0 | |
| Strong | 5 | 0 | 6 | |
| Fairly strong | 9 | 1 | 4 | |
| Moderate | 15 | 1 | 10 | |
| Fairly moderate | 16 | 5 | 11 | |
| Fairly weak | 16 | 4 | 34 | |
| Weak | 8 | 12 | 33 | |
| Very weak | 5 | 30 | 59 | |
| Extremely weak | 4 | 51 | 46 | |
| Zero | Zero strength | 0 | 0 | 0 |
| Downregulation | Extremely weak | 0 | 60 | 56 |
| Very weak | 1 | 71 | 34 | |
| Weak | 0 | 39 | 16 | |
| Fairly weak | 0 | 27 | 6 | |
| Fairly moderate | 0 | 16 | 5 | |
| Moderate | 0 | 1 | 1 | |
| Fairly strong | 0 | 3 | 1 | |
| Strong | 0 | 0 | 0 | |
| Very strong | 0 | 0 | 0 | |
| Extremely strong | 0 | 0 | 1 |
The cSSMD for a gene captures the information for all its measured targeting siRNAs. Hence, it will not have the issue of the frequency approach described previously. For example, Genes 3, 5, 8, 9 (selected as hits by the frequency approach) all have cSSMD <0.5 and average fold change <1.2, thus all having weak or weaker upregulated effects by the SSMD criterion. Genes 52, 62, 66, 70 (not selected as hits by the frequency approach) all have cSSMD >1.28 and average fold change >1.2, thus having moderate or stronger effects by the SSMD criterion. The cSSMD and average fold change for Gene 2 are 0.02 and 1.009, respectively. Thus, the cSSMD method will not select it as either an upregulated or downregulated hits.
The cSSMD method does not form the null distribution from all investigated siRNAs in a screen. Thus, it avoids the misleading result of hit selection generated by the RSA and RIGER methods when the majority of investigated genes in a screen have effects in one direction. For example, the measured values in the replicates of siRNAs targeting Gene 53 clearly indicate that this gene has upregulated effects (top panel of Fig. 2). The cSSMD for Gene 53 were 1.34, indicating that this gene has moderate upregulated effects. However, the P-value for this gene was 0.265 by RIGER and 0.205 by RSA. Neither RIGER nor RSA can support that Gene 53 has upregulated effects. Using the RIGER and RSA methods, for many genes, we would obtain misleading results similar to those for Gene 53. Another of them (i.e. Gene 57) is demonstrated in the Supplementary Material. The data for all the 81 genes are listed in the Supplementary Material.
Because cSSMD measures the effect size, it is more robust to sample size than the classical t-test. For example, all the measured fold changes of all the replicates for each of the three siRNAs targeting Gene 73 are >1 and most of them were >1.2 (Fig. 2). In contrast, five out of the seven siRNAs targeting Gene 53 has at least one replicate with measured fold change <1 (Fig. 2). The measured values clearly indicate that Gene 73 has a larger upregulated effect than Gene 53. However, the P-value (i.e. 0.014) for Gene 73 is about five times the P-value (i.e. 0.003) for Gene 53 (Fig. 2). In contrast, the estimated cSSMD value (i.e. 1.89) for Gene 73 is larger than that (i.e. 1.34) for Gene 53 (Fig. 2), correctly reflecting the information contained in the measured values.
In addition to assessing the collective activity of multiple siRNAs, the SSMD-based method can assess the specific effect of an siRNA relative to the collective effects of all siRNAs targeting the same gene as presented in the Section 2. SSMD [estimated using Equation (8)] for the deviation from the collective mean can be used to assess the size of specific effects of an siRNA. The specific effect of an siRNA is a combination of off-target effect and specific on-target effect that this siRNA has. It is impossible to completely separate an off-target effect from a specific on-target effect in current designs of studies. However, the consideration of both specific and collective effects may provide information about which siRNAs are more likely to have off-target effects and which are more likely to have specific on-target effects. The siRNAs with large specific effects for themselves but small collective effects for their targeted genes are more likely to have large off-target effects (e.g. the siRNAs marked with blue in Fig. 3). The siRNAs with large specific effects in one direction but large collective effects in the opposite direction are also more likely to have large off-target effects (e.g. the siRNAs marked with green in Fig. 3). The siRNAs with large specific effects in one direction and large collective effects in the same direction are more likely to have large specific on-target effects (e.g. the siRNAs marked with red in Fig. 3).
Fig. 3.

SSMD for assessing specific effects of siRNAs in the VZV deconvolution screen. Black points: siRNAs having weak or no specific effects; blue points: siRNAs being more likely to have large off-target effects, whereas their target genes have no or weak effects; green points: siRNAs being more likely to have large off-target effects, whereas their targeted genes have a large effect in the opposite direction; red points: siRNAs being more likely to have large specific on-target effects.
3.2 RNAi screening projects for diabetes and AD
Here, we further demonstrate the utility of the cSSMD methods in two more in-house RNAi screening projects. In an RNAi project for diabetes, following a primary screen without replicates and a confirmatory screen with replicates for siRNA pools, we investigated 321 genes in a deconvolution screen. In this deconvolution screen, a human hepatoma cell line (PLC PRF 5) was transfected with siRNA and treated with dexamethasone, cAMP and a suboptimal dose of insulin. After 48 h, a four-gene quantitative nuclease protection assay (qNPa, High Throughput Genomics) in a 384-well format was used to measure the gene expression of Beta-actin, glucose-6-phosphatase (G6PC) and pyruvate dehydrogenase kinase 4 (PDK4) (in addition to a negative control gene). siRNAs that modulate the gene expression of these readouts were analyzed and tested for their ability to modulate gluconeogenesis and insulin sensitivity. The major goal in this screen was to select siRNAs with inhibition effects to identify potential diabetes drug targets. Thus, of the 321 genes, 68% were preselected to have downregulated (i.e. inhibition) effects and 32% were preselected to have upregulated effects and 315 genes had 7 siRNAs each with triplicates.
Based on estimated cSSMD for the collective activity of their siRNAs, the effect sizes of the investigated genes are summarized in the fourth column of Table 1. The results indicate that many investigated genes have small downregulated effects. There are 47 genes with cSSMD ≤−0.75 and 11 genes with cSSMD ≥0.75. Based on a classical t-test, using P<0.05 in either direction, there are 42 downregulated hits and 11 upregulated hits. Based on RIGER, using P<0.05 in either direction, there are 20 downregulated hits and 19 upregulated hits (Fig. 4). The results by cSSMD and classical t-test match with the results in previous primary and confirmatory screens better than those by RIGER. Moreover, among the 47 downregulated hits by cSSMD, 31 were not selected as hits by RIGER. These 31 hits were confirmed to have downregulated effects in follow-up Taqman qPCR experiments. Note, because both the RSA and RIGER methods formalize the null distribution from all the siRNAs in the entire list in an experiment and because RSA requires two arbitrary thresholds, whereas RIGER does not, here we present the results in the two screens by RIGER but not those by RSA.
Fig. 4.

Analytic results for all genes in a deconvolution siRNA screen for diabetes. Top: the grey round point (or black ‘+’) denotes average value for an siRNA (or for all siRNAs targeting a gene); Middle: P-values from RIGER (grey points) and t-test (black ‘+’); bottom: estimated cSSMD (grey points) and average value (black ‘+’) for all siRNAs targeting a gene.
The SSMD method and classical t-test obtain similar results in the diabetes screen: all the 42 downregulated hits by the t-test were among the 47 downregulated hits by cSSMD and both methods selected the same 11 genes as upregulated hits. This is because 315 out of 321 investigated genes in the diabetes screen had 7 targeting siRNAs and because |SSMD| ≥0.75 is approximately equivalent to P<0.05 in either direction for a gene with seven targeting siRNAs. If many genes have different number of targeting siRNAs, the SSMD and classical t-test may obtain different results, as demonstrated in the following screen for AD.
In this deconvolution screen for AD, siRNAs were transfected into H4 neuroglioma cells in a 384-well plate format. A reverse transfection protocol was used, with a cell density of 6000 per well. Forty-eight hours later, cells were assayed for cell viability and then lysed. Cell lysates were then used to measure total ABCA1 levels by ELISA. The siRNAs that substantially altered total ABCA1 levels in H4 cells were considered hits. The goal in the above confirmatory screen was to select activation hits to identify potential AD targets. Thus, of the 323 investigated genes in the AD siRNA screen, 18% were preselected to have downregulated effects and 82% were preselected to have upregulated effects. In this screen, the numbers of siRNAs targeting a gene differ for different genes: 199 genes are targeted each by 7 siRNAs, 86 by 6, 21 by 5, 2 by 4, 4 by 3, 1 by 2, 2 by 8, 2 by 9 and 6 by 10 siRNAs.
Based on estimated cSSMD for the collective activity of their siRNAs, the effect sizes of the investigated genes in the AD screen are summarized in the fifth column of Table 1. There are 14 genes with cSSMD ≤−0.75 and 65 genes with cSSMD ≥0.75. Based on a classical t-test, using P<0.05 in either direction, there are 12 downregulated hits and 48 upregulated hits. Based on RIGER, using P<0.05 in either direction, there are 19 downregulated hits and 35 upregulated hits (Fig. 5). Again, the proportion of upregulated hits selected by the SSMD method matches with the proportion from previous screens for siRNA pools better than that by RIGER. Since the proportion of genes targeted by <7 siRNAs in the AD screen is larger than that in the diabetes screen, the difference in the number of selected hits between the SSMD method and the classical t-test in the AD screen is larger than that in the diabetes screen.
Fig. 5.

Analytic results for all genes in a deconvolution siRNA screen for Alzheimer's disease. Top: the grey round point (or black ‘+’) denotes average value for an siRNA (or for all siRNAs targeting a gene); middle: P-values from RIGER (grey points) and t-test (black ‘+’); bottom: estimated cSSMD (grey points) and average value (black ‘+’) for all siRNAs targeting a gene.
4 DISCUSSIONS AND CONCLUSIONS
To reduce the impact of off-target effects in RNAi screening projects, it is common to conduct experiments investigating multiple siRNAs per gene. Currently, corresponding analytic methods include the frequency approach, RSA, RIGER and t-test. In this article, we present the cSSMD method. The RSA and RIGER method require that the majority of siRNAs under investigation should have at most very weak effects in a deconvolution screen. However, the siRNAs under investigation in most deconvolution screens have been selected because they were positive or part of a positive siRNA pool in at least one previous screen. Therefore, the RSA and RIGER are not suitable for many RNAi screens investigating multiple siRNAs per gene.
Unlike the RSA and RIGER method, the cSSMD method does not draw the null distribution from all investigated siRNAs in a screen. Thus, it works effectively for both primary and deconvolution screens with multiple siRNAs against a gene. Like RSA and RIGER, cSSMD captures the collective activity of multiple siRNAs against a gene, thus minimizing the impact of off-target effects. Also a gene with multiple moderately active siRNAs is weighted more heavily than a gene with fewer active siRNAs in the cSSMD method so, unlike the frequency approach, the cSSMD method does not miss the selection of genes with consistent moderate effects. Like the t-statistic, the cSSMD estimate captures both the average value and variability of measured responses of multiple siRNAs targeting a gene. Unlike the t-statistic, the SSMD estimate is more robust to differences in sample size. The applications of the cSSMD method to three in-house RNAi screens also demonstrate that the results obtained by the cSSMD method are more reasonable and sensible than those obtained using the frequency approach, RSA, RIGER or t-test in terms of matching with (i) data in current experiments, (ii) the results in previous experiments and (iii) the results in available follow-up experiments.
It should be noted that, similar to the t-statistic, the cSSMD method may overemphasize the genes with consistent but weak effects for its targeting siRNAs. To ensure that average fold change has a reasonable magnitude, the dual-flashlight plot (Zhang, 2010b) which considers both SSMD and average fold change can be used.
Finally, although the experiments demonstrated in this article are screens for siRNAs, all the proposed method can readily be applied to screens for short hairpin RNAs (shRNAs) and others.
Supplementary Material
ACKNOWLEDGEMENTS
We thank Dr Ray Bain for his support and thank Associate Editor Hofacker and two anonymous referees for their helpful comments.
Conflict of Interest: All the authors except M.F. and Q.W. are Merck employees.
REFERENCES
- Barbie D.A., et al. Systematic RNA interference reveals that oncogenic KRAS-driven cancers require TBK1. Nature. 2009;462:108–122. doi: 10.1038/nature08460. [DOI] [PMC free article] [PubMed] [Google Scholar]
- Bard F., et al. Functional genomics reveals genes involved in protein secretion and Golgi organization. Nature. 2006;439:604–607. doi: 10.1038/nature04377. [DOI] [PubMed] [Google Scholar]
- Birmingham A., et al. 3′ UTR seed matches, but not overall identity, are associated with RNAi off-targets. Nat. Methods. 2006;3:199–204. doi: 10.1038/nmeth854. [DOI] [PubMed] [Google Scholar]
- Blow N. RNAi technologies: a screen whose time has arrived. Nat. Methods. 2008;5:361–366. [Google Scholar]
- Brass A.L., et al. Identification of host proteins required for HIV infection through a functional genomic screen. Science. 2008;319:921–926. doi: 10.1126/science.1152725. [DOI] [PubMed] [Google Scholar]
- Echeverri C.J., et al. Minimizing the risk of reporting false positives in large-scale RNAi screens. Nat. Methods. 2006;3:777–779. doi: 10.1038/nmeth1006-777. [DOI] [PubMed] [Google Scholar]
- Elbashir S.M., et al. Duplexes of 21-nucleotide RNAs mediate RNA interference in cultured mammalian cells. Nature. 2001;411:494–498. doi: 10.1038/35078107. [DOI] [PubMed] [Google Scholar]
- Glaser V., Ferrer M. Interview with Marc Ferrer, Ph.D. Assay Drug Dev. Technol. 2010;8:263–267. doi: 10.1089/adt.2010.0803.pr. [DOI] [PubMed] [Google Scholar]
- Jackson A.L., et al. Expression profiling reveals off-target gene regulation by RNAi. Nat. Biotechnol. 2003;21:635–637. doi: 10.1038/nbt831. [DOI] [PubMed] [Google Scholar]
- Klinghoffer R.A., et al. A lentivirus-mediated genetic screen identifies dihydrofolate reductase (DHFR) as a modulator of beta-catenin/GSK3 signaling. PLoS ONE. 2009;4 doi: 10.1371/journal.pone.0006892. [DOI] [PMC free article] [PubMed] [Google Scholar]
- Konig R., et al. A probability-based approach for the analysis of large-scale RNAi screens. Nat. Methods. 2007;4:847–849. doi: 10.1038/nmeth1089. [DOI] [PubMed] [Google Scholar]
- Konig R., et al. Global analysis of host-pathogen interactions that regulate early-stage HIV-1 replication. Cell. 2008;135:49–60. doi: 10.1016/j.cell.2008.07.032. [DOI] [PMC free article] [PubMed] [Google Scholar]
- Nybakken K., et al. A genome-wide RNA interference screen in Drosophila melanogaster cells for new components of the Hh signaling pathway. Nat. Genet. 2005;37:1323–1332. doi: 10.1038/ng1682. [DOI] [PMC free article] [PubMed] [Google Scholar]
- Pelkmans L., et al. Genome-wide analysis of human kinases in clathrin- and caveolae/raft-mediated endocytosis. Nature. 2005;436:78–86. doi: 10.1038/nature03571. [DOI] [PubMed] [Google Scholar]
- Zhang J. Powerful goodness-of-fit tests based on the likelihood ratio. J. R. Stat. Soc. Ser. B Stat. Methodol. 2002;64:281–294. [Google Scholar]
- Zhang X.H.D. A new method with flexible and balanced control of false negatives and false positives for hit selection in RNA interference high-throughput screening assays. J. Biomol. Screen. 2007;12:645–655. doi: 10.1177/1087057107300645. [DOI] [PubMed] [Google Scholar]
- Zhang X.H.D. Genome-wide screens for effective siRNAs through assessing the size of siRNA effects. BMC Res. Notes. 2008;1:33. doi: 10.1186/1756-0500-1-33. [DOI] [PMC free article] [PubMed] [Google Scholar]
- Zhang X.H.D. A method for effectively comparing gene effects in multiple conditions in RNAi and expression-profiling research. Pharmacogenomics. 2009;10:345–358. doi: 10.2217/14622416.10.3.345. [DOI] [PubMed] [Google Scholar]
- Zhang X.H.D. An effective method for controlling false discovery and false non-discovery rates in genome-scale RNAi screens. J. Biomol. Screen. 2010a;15:1116–1122. doi: 10.1177/1087057110381783. [DOI] [PubMed] [Google Scholar]
- Zhang X.H.D. Assessing the size of gene or RNAi effects in multifactor high-throughput experiments. Pharmacogenomics. 2010b;11:199–213. doi: 10.2217/pgs.09.136. [DOI] [PubMed] [Google Scholar]
- Zhang X.H.D. Optimal High-Throughput Screening: Practical Experimental Design and Data Analysis for Genome-Scale RNAi Research. New York: Cambridge University Press; 2011. [Google Scholar]
- Zhang X.H.D., et al. The use of strictly standardized mean difference for hit selection in primary RNA interference high-throughput screening experiments. J. Biomol. Screen. 2007;12:497–509. doi: 10.1177/1087057107300646. [DOI] [PubMed] [Google Scholar]
- Zhang X.H.D., et al. The use of SSMD-based false discovery and false non-discovery rates in genome-scale RNAi screens. J. Biomol. Screen. 2010;15:1123–1131. doi: 10.1177/1087057110381919. [DOI] [PubMed] [Google Scholar]
- Zhao W.Q., et al. Inhibition of calcineurin-mediated endocytosis and alpha-amino-3-hydroxy-5-methyl-4-isoxazolepropionic acid (AMPA) receptors prevents amyloid beta oligomer-induced synaptic disruption. J. Biol. Chem. 2010;285:7619–7632. doi: 10.1074/jbc.M109.057182. [DOI] [PMC free article] [PubMed] [Google Scholar]
- Zhou H.L., et al. Genome-scale RNAi screen for host factors required for HIV replication. Cell Host Microbe. 2008;4:495–504. doi: 10.1016/j.chom.2008.10.004. [DOI] [PubMed] [Google Scholar]
Associated Data
This section collects any data citations, data availability statements, or supplementary materials included in this article.