Abstract
In this work we determined when the state of thermodynamic (full) equilibrium, i.e. time-invariate solute retention, was achieved in gradient elution reversed-phase chromatography. We investigated the effects of flow rate, temperature, organic modifier, buffer type/concentration, stationary phase type, n-butanol as eluent additive, and pore size. We also measured how selectivity varied with reequilibration time. Stationary phase wetting and the ability of the stationary phase to resist changes in pH strongly affect the time needed to reach full equilibrium. For example, full equilibrium is realized with many endcapped stationary phases after flushing with only two column volumes of acetonitrile-water containing 1 % (v/v) n-butanol and 0.1 % (v/v) trifluoroacetic acid. Trends in retention time (< 0.010 min) and selectivity become quite small after only five column volumes of reequilibration. We give practical guidelines that provide fast full equilibrium for basic compounds when chromatographed in buffered eluents.
Keywords: gradient elution, speed, equilibration, flush-out volume, basic drugs
1. Introduction
Gradient elution chromatography is routinely used to solve the general elution problem [1–3] and increase peak capacity for complex mixtures. However, this approach is often avoided because gradient cycle times are long when column reequilibration is slow. Many reports have suggested specific equilibration guidelines [4] and discussed ways to improve the speed of gradient elution analysis [5,6], but no clear definition of when adequate column equilibration has been achieved occurs was provided (see the discussion in [7]). Therefore, we found it necessary to devise procedures to determine when the column was adequately equilibrated. In view of the practical importance of improving speed in gradient elution chromatography we developed guidelines for assessing when the column had been reequilibrated to either the state of: 1) “repeatable” equilibrium (i.e. a repeatability of better than 0.002 min) or 2) “full” equilibrium (i.e. solute retention that was independent of further increases in reequilibration time) [7]. For ionic solutes in unbuffered eluents we were able to achieve outstanding repeatability with minimal reequilibration (less than two column volumes). Furthermore, we found that by minimizing the instrument flush-out (dwell) volume and by adding a small amount (1 – 3 % (v/v)) of an ancillary solvent (e.g. n-butanol or n-propanol) to the eluent the amount of flushing needed to reach “full” equilibration could be further reduced to at most two column volumes. Clearly, the overall speed of gradient elution chromatography was not severely limited by the reequilibration time under the appropriate conditions for the test mixture of non-ionizable solutes and unbuffered eluents used in that work [7].
Recently, Marchand and coworkers reported that the retention of basic compounds in buffered eluents drifted for several hours under isocratic conditions; the magnitude of the drift depended on the experimental conditions (e.g. eluent pH, degree of solute ionization and stationary phase type) [8]. Clearly, if such slow column reequilibration were observed under gradient conditions it would drastically increase the cycle time. We thus felt it important to extend our prior studies in unbuffered eluents to study column reequilibration with basic solutes in buffered eluents. Also, the study by Marchand et. al has shown that the Zorbax SB-C18 column showed minimal retention drift under isocratic conditions [8]. However, we believe that the equilibration processes under isocratic and gradient conditions are fundamentally different. Thus, we felt it was worthwhile to study the equilibration of the SB-C18 and some related phases under gradient conditions.
In part I of this series (see ref. [9]) we were able to achieve excellent repeatability (i.e. better than 0.003 min) for a mixture of basic compounds and non-ionizable solutes with minimal (at most two column volumes) reequilibration to an eluent containing acetonitrile-water with 1 % (v/v) n-butanol and buffered with 0.1 % (v/v) trifluoroacetic acid. We showed that many factors affected the repeatability including both the flow rate, nature of the buffer species and stationary phase type. Also, we found a “critical region” of intermediate chromatographic retention where retention repeatability was distinctly poorer (around 0.030 min) when reequilibration was limited to only one to two column volumes [9]. However, an increase to three column volumes of reequilibration often significantly improved the repeatability within this “critical region”. Here, we investigate ways to reduce the time needed to achieve full equilibration under similar conditions to the prior study [9].
2. Experimental
The preparation of sample mixtures and eluents, description of the instrumentation and chromatographic conditions, representative chromatograms and procedure for data analysis were presented in ref. [9]. All work was performed using 15 cm × 4.6 mm i.d. columns with 5 µm and 80 Å pore size particles unless noted otherwise. The majority of this work was performed using a column packed with SB-C18 particles although we also used columns packed with wide pore SB-C18 (300 Å pore size), XDB-C8, XDB-C18, SB-Phenyl, RX-C18 and Extend-C18 which were gifts from Agilent Technologies, Inc. (Palo Alto, CA). Other columns packed with Alltima C18 ACE-C18, Discovery HC-C18 and Inertsil ODS-3 (90 Å pore size) particles were gifts from Alltech Associates, Inc. (Deerfield, IL), Mac-Mod Analytical, Inc. (Chadds Ford, PA), Supelco (Bellefonte, PA) and Varian, Inc. (Lake Forest, CA), respectively.
In section 3.3 below, a prototype eluent pre-heater and column heating jacket obtained from Systec Inc. (New Brighton, MN) were used to pre-heat the mobile phase and maintain the column temperature within ± 0.1 °C. A length of 30 cm of 0.005” pre-heating tubing sufficed [10]. to pre-heat the mobile phase to 80 °C at 2 mL/min based on the column dimensions used.
3. Results/Discussion
3.1 Effect of the flush-out volume on reequilibration time
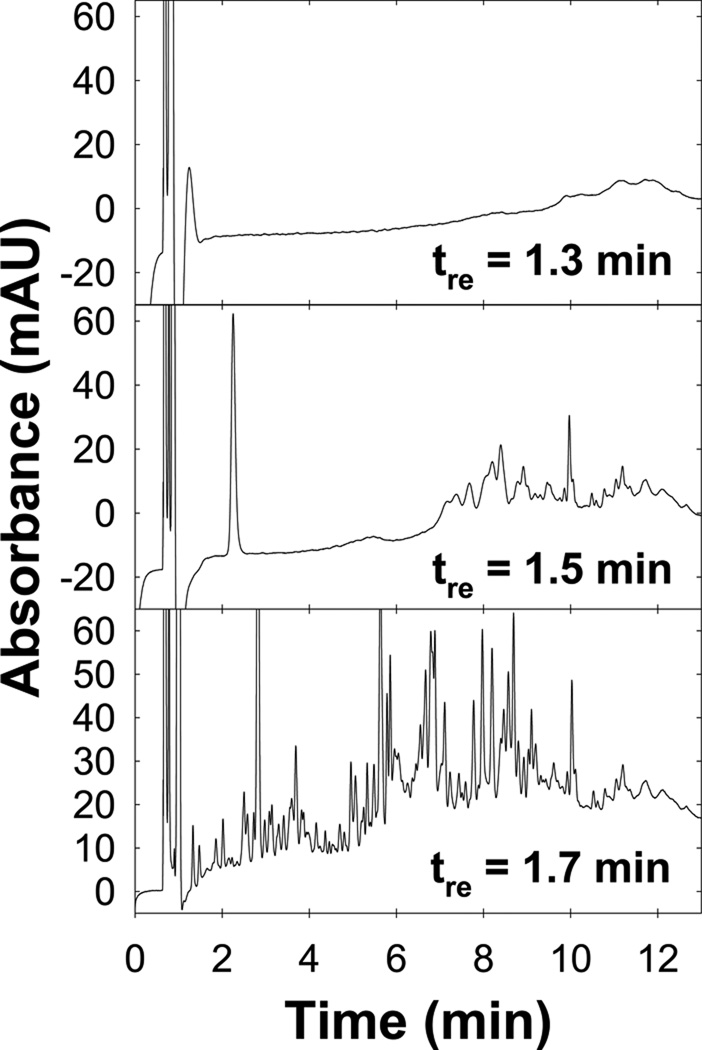
Before a column can be reequilibrated to the initial eluent, the prior eluent must be fully flushed out of the system. Previously, we found that approximately two dwell volumes of eluent were required to flush 97% of the final eluent from the pumping system; this is the instrument flush-out volume (Vflush) [7]. Fig. 1 shows the importance of Vflush on the reequilibration time (tre) required to obtain an acceptable separation. When tre = 1.3 min (~ 1.6 column volumes), an extremely ill-formed chromatogram is observed because the preceding final eluent had not been properly flushed from the system. After tre = 1.5 min. the system contains a higher fraction of initial eluent but the separation quality is worse than those with tre ≥ 1.7 min (~ 2.1 column volumes). Thus, one must first completely flush the final eluent from the pumping system/column and then perform additional reequilibration to achieve a state of repeatable or full equilibrium. Furthermore, the use of low flow rates to avoid backpressure limitations when using columns of smaller diameters and packed with smaller particles increases the flush-out time (tflush = Vflush / F) and the column volumes of reequilibration required for full flush-out (CVflush = Vflush / Vm).
Fig. 1.
Importance of the flush-out volume on the separation of tryptic peptides of bovine serum albumin (BSA). Conditions: SB-C18 (150 × 4.6 mm; 5 mm; 80 Å; Vm ~ 1.6 mL ); Eluent A: 5/94.9/0.1 ACN/H2O/TFA; Eluent B: 55/44.9/0.1 ACN/H2O/TFA; 0/100 to 20/80 A/B in 12 min; hold for 1 min; 2 mL/min; HP 1100 (VD ~ 0.90 mL; Vflush ~ 2.5 mL) ; 40 oC; 15 µL injection of tryptic peptides of BSA prepared as described in ref. [7]; 220 nm detection. The reequilibration time (tre) is the time between the end and start of two consecutive gradient runs.
Clearly, both the instrument and column configurations strongly influence tflush and CVflush. Here, we subtract any time required for flush-out of the instrument from the total reequilibration time to measure the column reequilibration which is reported here. Furthermore, we report the condition needed to obtain full equilibration in terms of the volume of eluent relative to the column size in volume units and not in absolute time or volume.
3.2 Determining when full equilibrium occurs
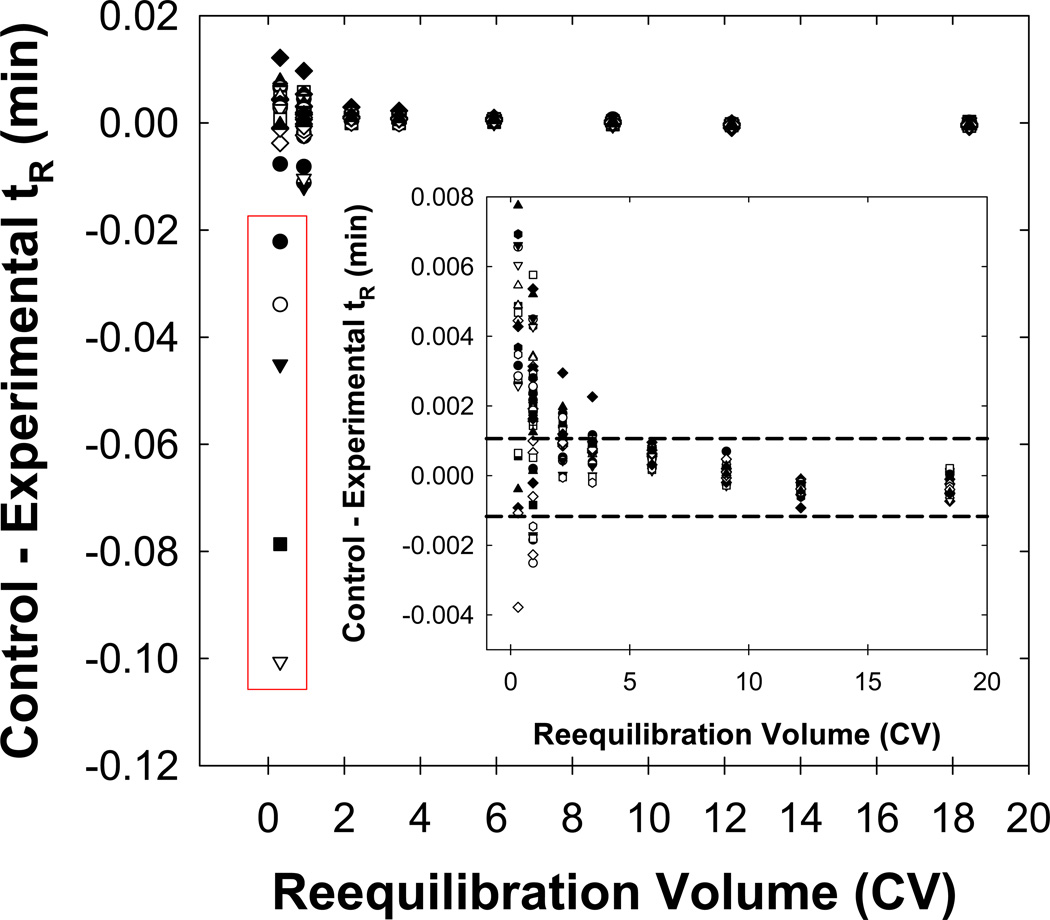
A procedure for determining the time for full equilibrium was previously reported [7]. First, for all solutes we plot the difference in retention time at the reequilibration time of interest from the retention time at a “standard” reequilibration time (see Fig. 2). We use the solute, which has the largest changes in retention time, to determine when full equilibrium is obtained. The solutes contained within the red rectangle in Fig. 2 elute in a “critical region” from 1.5 min. to 2.5 min. where repeatability was poorest [9]. Clearly, fast reequilibration will always be possible if a sample does not contain any solutes which elute within the “critical region.” Therefore, we deliberately designed the analyte mixtures to contain solutes that would elute within the “critical region.” Unless stated otherwise, pheniramine was the “worst” solute. Also, full equilibrium was always achieved within two column volumes for neutral solutes provided that 1 % (v/v) n-butanol was present in the eluent, in agreement with our earlier work [7].
Fig. 2.
Plot of the difference in the retention time (tR) from the control and experimental re-equilibration times as a function of the reequilibration volume. The inner plot is a “blow-up” of the larger plot. Conditions: 15 cm × 4.6 mm I.D. column packed with 5 mm SB-C18 80 Å particles; eluent A: 1/10/88.9/0.1 BuOH/MeCN/H2O/TFA; eluent B: 1/90/8.9/0.1 BuOH/MeCN/H2O/TFA; 100/0 to 0/100 to 0/100 A/B in 10 mL to 11 mL at 2 mL/min; VD = 0.90 mL; Vflush ~ 2.5 mL; 40 °C. The solutes in the red rectangle elute within the “critical region” after the dead time (at around 0.72 minutes) between 0.8 and 1.3 minutes. The dashed horizontal lines represent the range in time where the retention of the solute is similar to the repeatability and thus considered to be statistically constant. The “worst” solute under these and other conditions was always pheniramine unless otherwise noted.
3.3 Effect of flow rate and column temperature
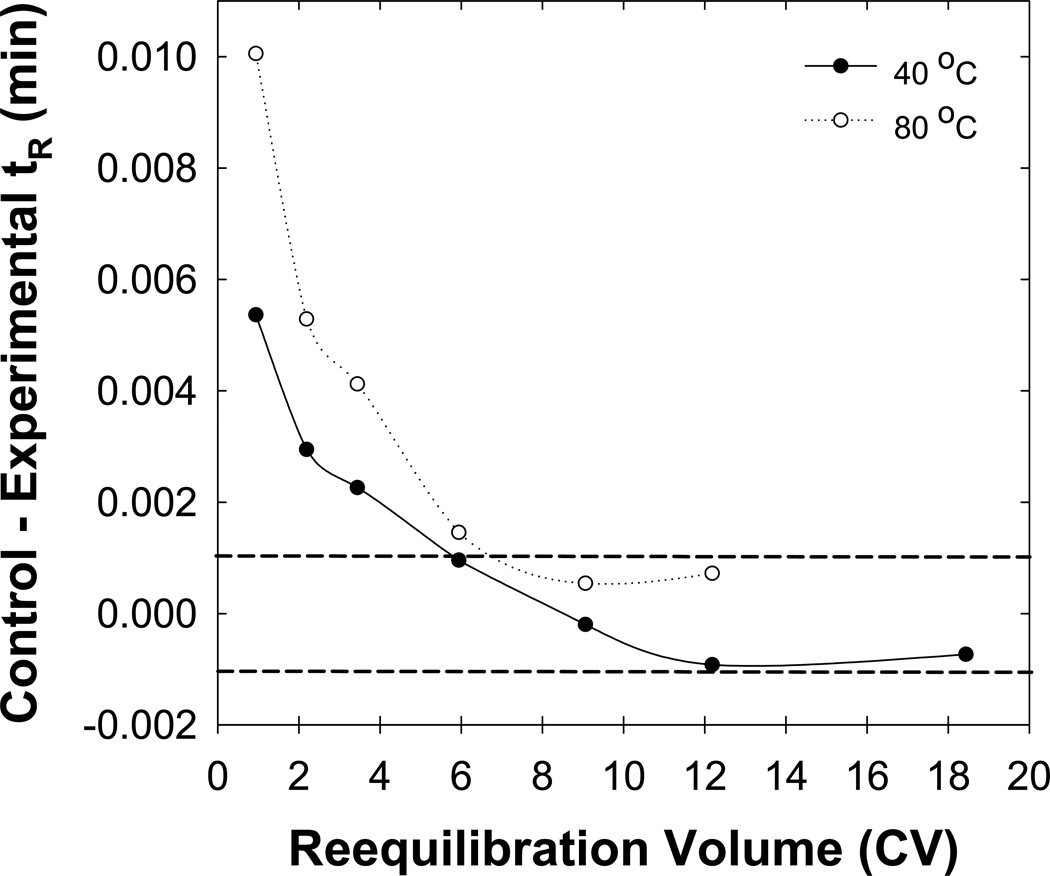
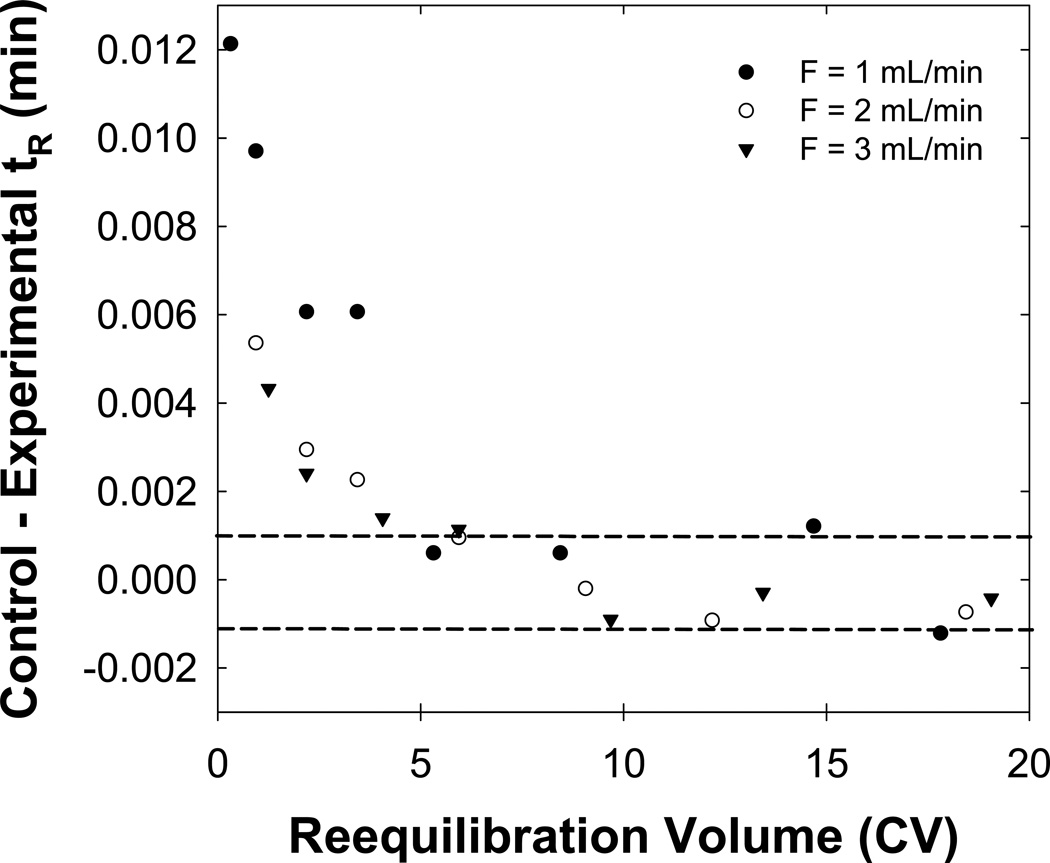
Previously, with no n-butanol in the eluent we concluded that full equilibrium was predominantly a matter of the thermodynamic (not kinetic) displacement of the prior mobile phase by the initial eluent. l [7]. Such experiments were repeated here with buffered eluents containing 1 % (v/v) n-butanol. Fig. 3 shows that, as before, an increase in temperature from 40 to 80 °C had a minimal affect on the rate of achieving full equilibrium. However, Fig. 4 shows that now about five column volumes of reequilibration (i.e. 10 mL) were required to achieve full equilibrium independent of the flow rate, which differs from previous studies with unbuffered eluents. We now believe that stationary phase wetting strongly affects the time needed to achieve full equilibrium. Higher pressures resulting from use of higher flow rates and the use of increased amounts of acetonitrile in the initial eluent appear to improve the ability of an initial butanol-free eluent (see ref. [9]) to wet the stationary phase [7]. In the present study the addition of n-butanol to the initial eluent ensured adequate stationary phase wetting independent of the flow rate (see Fig. 4).
Fig. 3.
Effect of the column temperature on full equilibration. Temperatures of 40 °C ( ) and 80 °C (
 ) were used. Other conditions are described in Fig. 2.
Fig. 4.
Effect of the flow rate on full equilibration. The dashed lines bracket a 0.002 min difference in the control and experimental retention time which represents a range in tR where the retention time of the solute is statistically constant based on the repeatability of the “worst” solute pheniramine. Flow rates of 1 mL/min (●), 2 mL/min (○) and 3 mL/min (▼) were used. Other conditions are described in Fig. 2.
The speed of obtaining full equilibrium is clearly slower for the basic compounds (about five column volumes) compared to the neutral solutes (two column volumes). We believe that the unique interaction of each solute type with the stationary phase have a strong influence on the time for full equilibration. Nevertheless, we were pleased, in view of the report of Marchand [6] discussed above, to see that full equilibrium could be established after only five column volumes.
3.4 Effect of organic modifier type
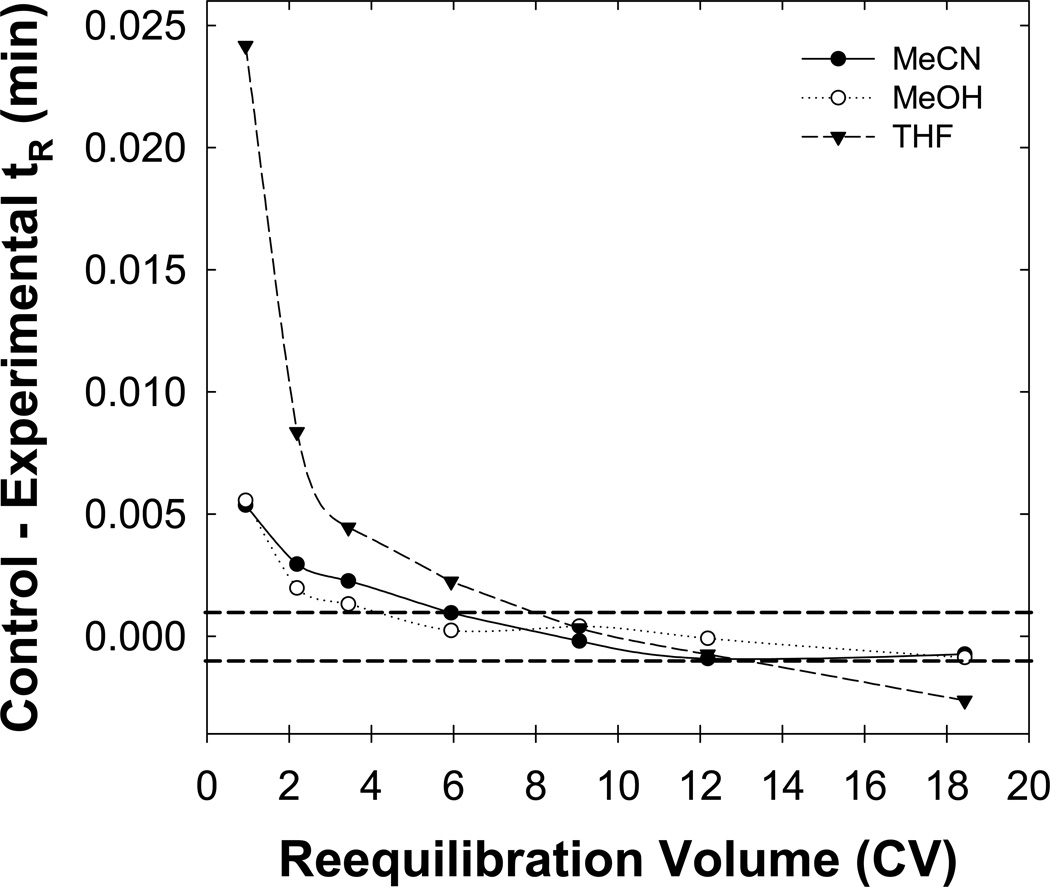
Here, we varied the organic modifier from acetonitrile to either methanol or tetrahydrofuran to determine if changes in stationary phase wetting will affect the full equilibrium time. Fig. 5 shows that both the methanol and acetonitrile eluents give similar trends, which might be due to the presence of the 1 % (v/v) n-butanol. However, quite interestingly full equilibrium was not achieved for either the bases or neutral solutes with the tetrahydrofuran eluent system. Conversely, full equilibration was established using the methanol and acetonitrile eluent systems (see Fig. 5). We believe the strong adsorption of tetrahydrofuran to the stationary phase significantly increases the time needed for full equilibrium. Also note that changing the organic modifier type from acetonitrile to methanol or tetrahydrofuran did not allow full equilibrium to be achieved in less than five column volumes for the basic compounds.
Fig. 5.
Effect of the organic modifier type on full equilibration. The organic modifiers acetonitrile (MeCN; ), methanol (MeOH;
 ) and tetrahydrofuran (THF;
 ) were used. Other conditions are described in Fig. 2.
3.5 Effect of n-butanol concentration
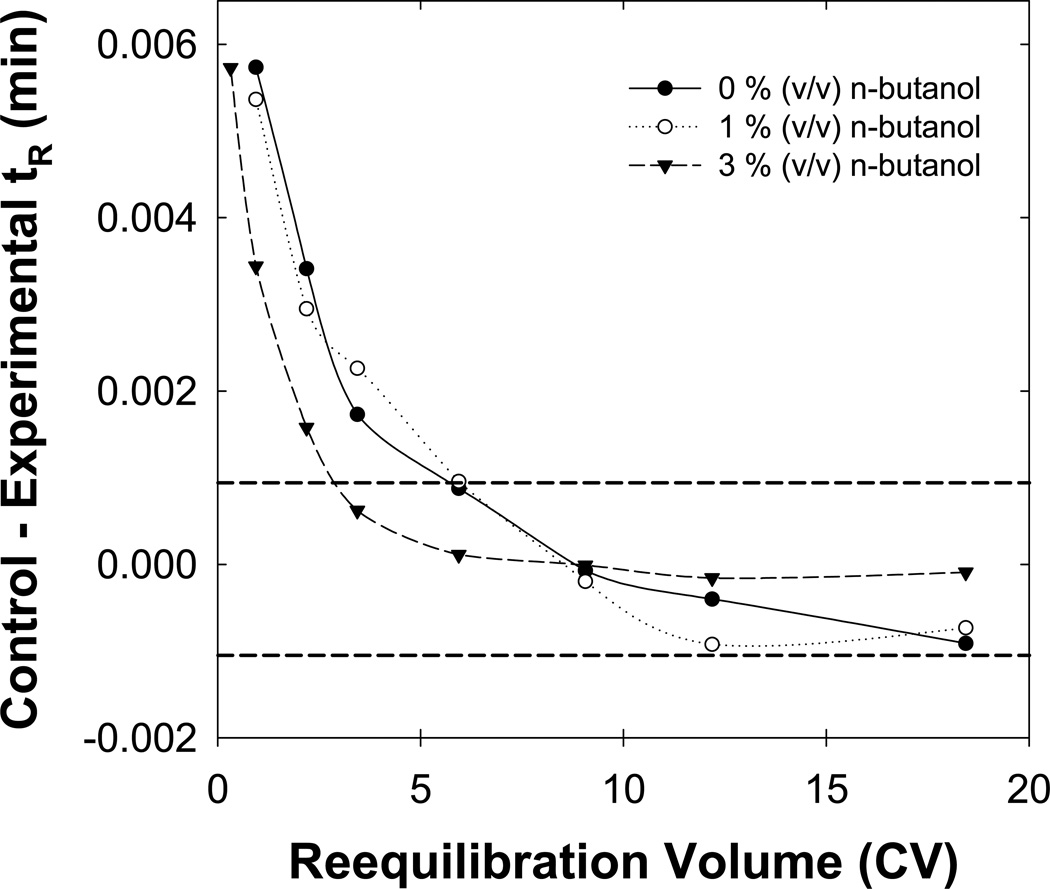
Increasing the concentration of n-butanol in the eluent might decrease the full equilibrium time. Specifically, we believe that the hydroxyl group of n-butanol strongly interacts with the surface silanol groups to “shield” the silanols. Work by Scott and Simpson [11] first detailed strong adsorption of n-butanol to the stationary phase but recent simulations by Siepmann and coworkers provides more evidence that n-butanol does interact as we propose [12]. Also, higher concentrations of n-butanol should improve the degree of stationary phase wetting. Fig. 6 shows that the addition of 3 % (v/v) n-butanol to the eluent did reduce the full equilibrium from five column volumes to three column volumes. As shown in our previous paper [9] addition of butanol does not have any effect on the amount of flushing required to achieve the state of repeatable equilibrium.
Fig. 6.
Effect of the n-butanol concentration on full equilibration. Gradients from 0/10/89.9/0.1 to 0/90/9.9/0.1 ( ), 1/10/88.9/0.1 to 1/90/8.9/0.1 (
 ) and 3/8/88.9/0.1 to 3/88/8.9/0.1 (
 ) BuOH/MeCN/H2O/TFA (v/v/v/v) were performed. Other conditions are described in Fig. 2.
3.6 Effect of the buffer type/concentration
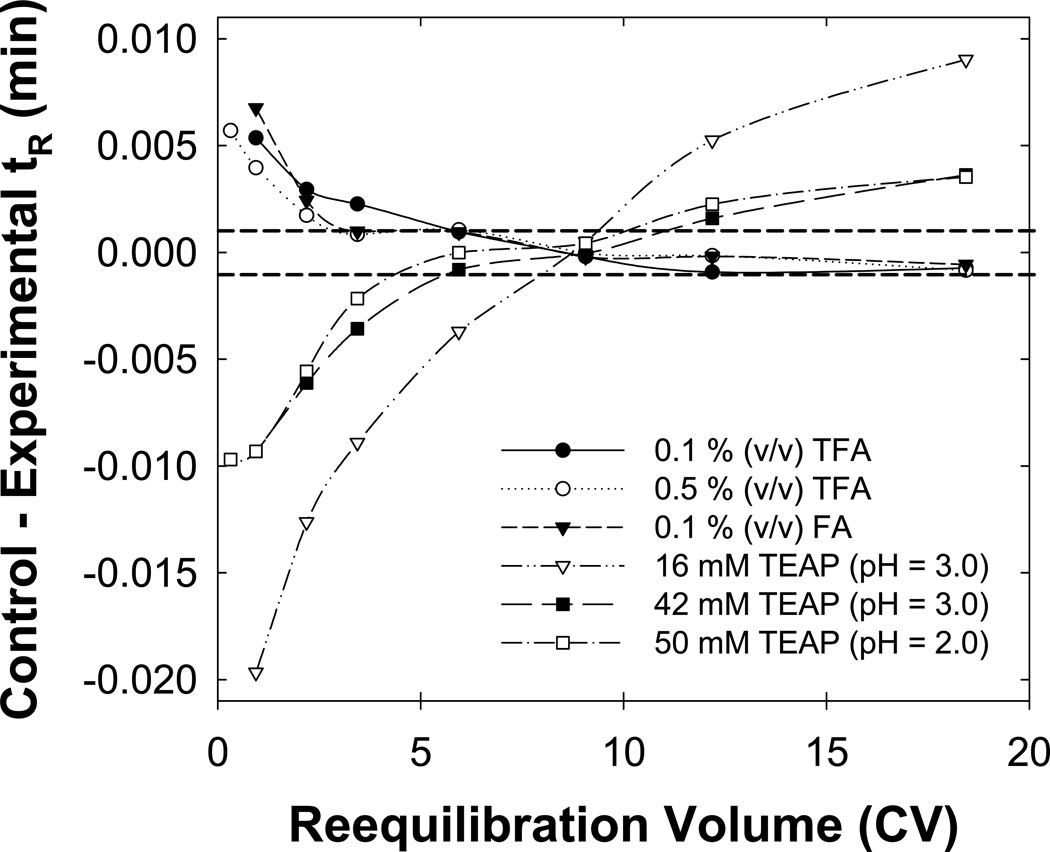
It is likely that some type of strong interaction of the basic drugs with the stationary/mobile phase increased the time for full equilibrium as compared to that needed for neutral solutes. Thus, we varied the buffer type and concentration. Fig. 7 shows that 0.1% (v/v) TFA and 0.1 % (v/v) FA were similar and that increasing the TFA concentration did not significantly accelerate full equilibration. However, full equilibrium took much longer with TEAP buffers; increasing the phosphoric acid concentration and lowering the pH did shorten the process. Furthermore, in TEAP buffers the retention of all basic compounds changed in contrast to the behavior of the TFA and FA buffers wherein only the retention of the basic compounds in the “critical region” varied when the reequilibration time was increased. Clearly, some chemical characteristic of the TEAP buffer/stationary phase system is not allowing full equilibrium to be established rapidly. We believe that the TEA component, which can serve as both an ion-interaction agent and as a silanol blocker, is likely interacting with the stationary phase possibly simply adsorbing strongly and thus requiring a good deal of initial eluent to bring its concentration in the stationary phase back to equilibrium with the stationary phase. There are numerous literature examples of slow column equilibration in ion-interaction chromatography. One study even investigated ways to shorten the time required to achieve repeatable equilibrium but did not address the general problem of slow full equilibrium [13]. However, we believe that some specific property of the SB-C18 phase must also be important.
Fig. 7.
Effect of the buffer type and concentration on full equilibration. The initial and final eluents used contained 0.1 % (v/v) trifluoroacetic acid (TFA; ), 0.5 % (v/v) TFA (
 ), 0.1 % formic acid (FA;
 ), 16 mM triethylamine phosphate (TEAP) at pH = 3.0 (
 ), 42 mM TEAP at pH = 3.0 (
 ) and 50 mM TEAP at pH = 2.0 (
 ) buffers. Other conditions are described in Fig. 2.
Changes in the ionization of the SB-C18 stationary phase in TEAP buffers might be slower than with the other buffers due to a greater change in the true pH [14] of the initial and final eluents with TEAP than the other buffers. The dielectric constant of the solvent is the main factor leading to changes in the true pKa of neutral and anionic acids and thus the true pH. However, based only on electrostatic considerations the charge and atomic radius of the buffer ions also affect the magnitude of the true pH change in the different solvents [15]. Thus, similar changes in the true pH of the initial and final eluent should result for similar charge type buffers. The pKa of TFA shifts from 0.23 to 12.70 and the pKa of triethylamine shifts from 10.78 to 18.60 upon changing from pure water to pure acetonitrile [16] whereas that of the pKa,1 of phosphoric acid shifts from 2.21 to 3.75 upon changing from pure water to 60/40 acetonitrile/water (v/v) [17]. No data for the pKa shift of FA were found.
Slow equilibration of SB-C18 might also result from difficulties in reestablishing the protonation state of the stationary phase or reequilibrating the stationary phase with protonated triethylamine (i.e. (CH3CH2)3NH+). The buffering agents establish a true mobile phase pH of about 2 to 3 in the water-rich initial eluent. To establish and maintain a similar stationary phase pH, the cationic buffer components must be able to interact with the surface silanols especially with any charged groups on the surface. The only positively charged species in the TFA and FA buffers are protons whereas the TEAP buffers also contain (CH3CH2)3NH+ ions. These bulky organic ions might block detrimental interactions between the surface silanols and basic drugs better than do protons. However, McDonald [18] has suggested that “water wires” allow protons to quickly reach the stationary phase surface from the bulk eluent; the work of Siepmann and coworkers provide theoretical support for the existence of such “water wires” [12]. Thus, it is likely that the (CH3CH2)3NH+ cations equilibrate slowly with the stationary phase and require more time to reach the silanols than do protons.
An increase in the stationary phase concentration of (CH3CH2)3NH+ with reequilibration time should lower the retention of basic drugs due to increased electrostatic repulsion or improved shielding of surface silanols. Such decreases in retention were observed with the SB-C18 phase using TEAP buffers (see Fig. 7) but more work is required to understand the details. Nevertheless the important point is that one should avoid the combination of SB-C18 and TEAP buffers when fast full equilibrium is desired. Full equilibration using other typical RPLC buffers containing salt was not tested due to low solubility of these buffers in the final eluent [19].
3.7 Effect of stationary phase type
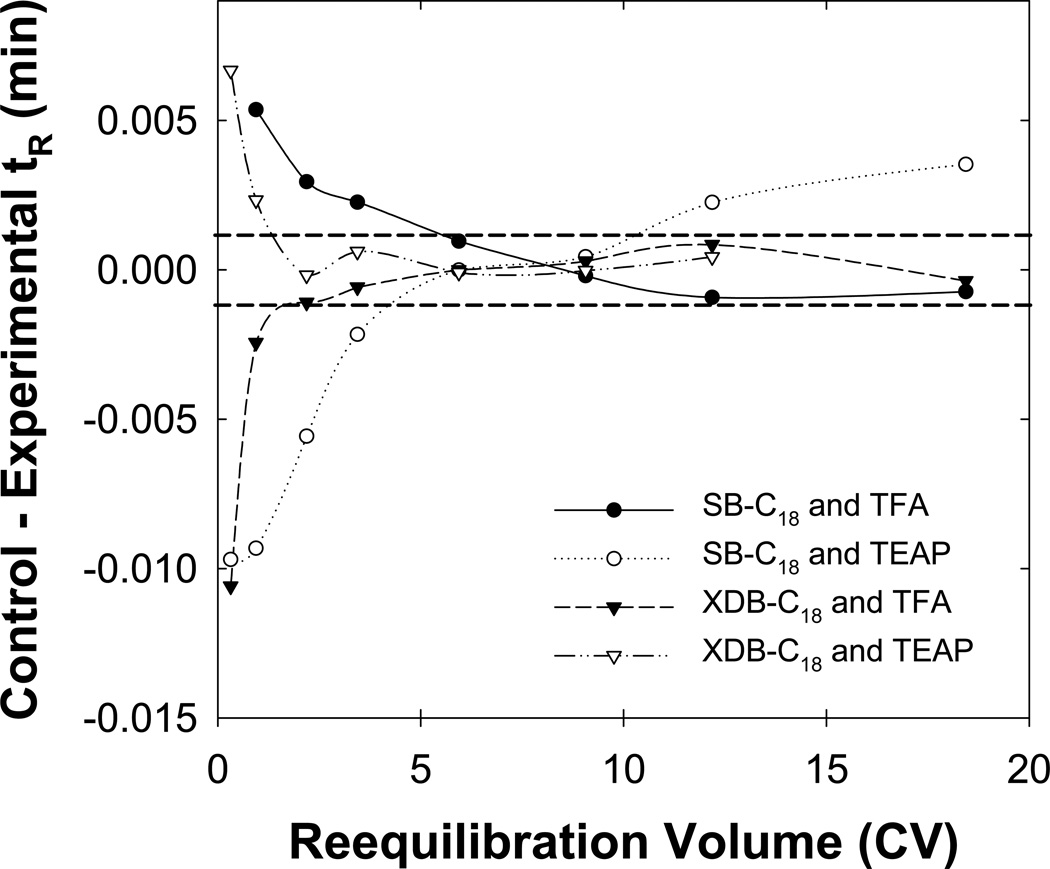
SB-C18 is a more active stationary phase in terms of its silanophilicity presumably due to the lower surface concentration of the very bulky ligand used to make them and the absence of any endcapping. In contrast, XDB-C18 from the same manufacturer although based on the same silica is less active due to both a higher concentration of ligand and extensive endcapping. Fig. 8 shows that the XDB-C18 phase gave full equilibrium for charged analytes in two column volumes, virtually as fast as neutral solutes in unbuffered eluents, either 0.1% (v/v) TFA or 50 mM TEAP at pH 2. Furthermore, the retention of only those basic drugs within the “critical region” changed with the reequilibration time when using the XDB-C18 column and TEAP buffer (data not shown). This result strongly suggests that it is the change in the state of ionization of the SB-C18 column and its interaction with TEAP but not TFA or FA buffers during the gradient that is the source of the slow reequilibration.
Fig. 8.
Effect of the stationary phase and buffer on full equilibration. Stationary phase and buffer combinations of SB-C18 and TFA ( ), SB-C18 and TEAP (
 ), XDB-C18 and TFA (
 ) and SB-C18 and TEAP (
 ) were used were TFA and TEAP represents a 0.1 % (v/v) TFA or 50 mM TEAP at pH = 2.0 buffer in the eluent, respectively. Other conditions are described in Fig. 2.
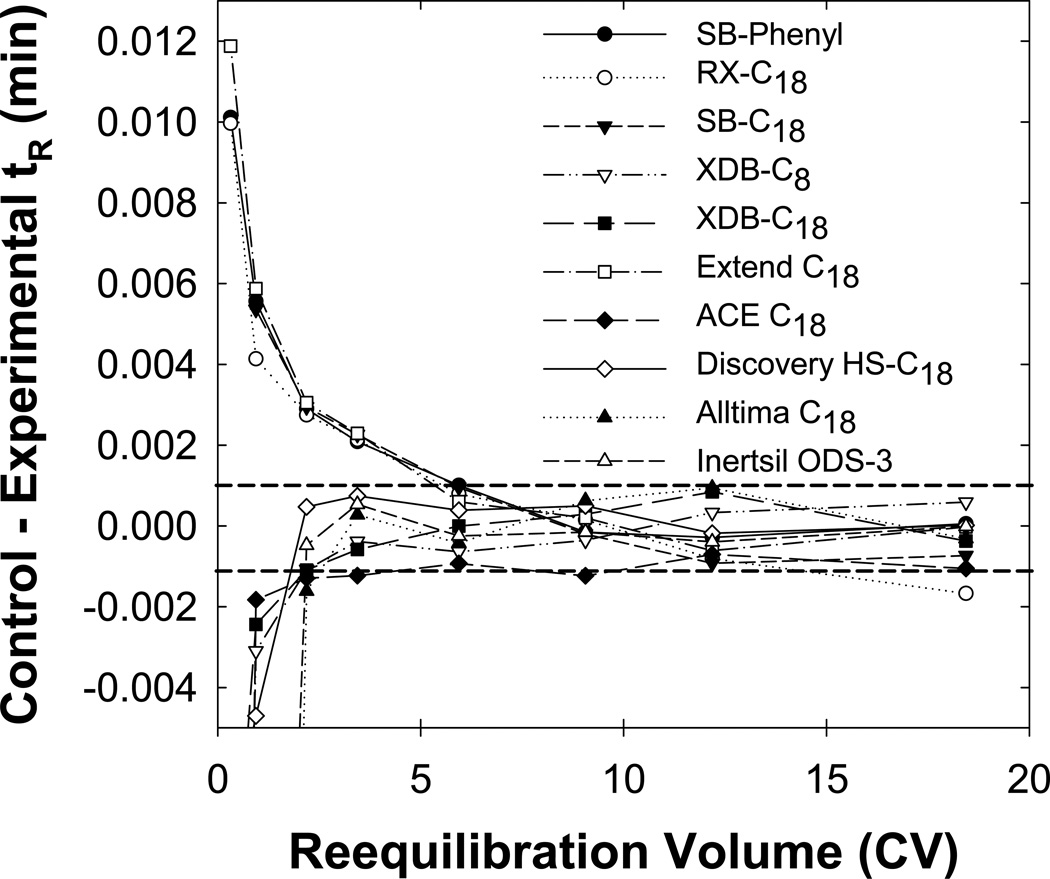
Fig. 9 compares full equilibrium on stationary phases with various bonding schemes and underlying silica supports. Full equilibrium occurs within two column volumes on ACE-C18. The XDB-C8, XDB-C18, Alltima C18, Inertsil ODS-3 and Discovery HS-C18 columns all gave full equilibrium within three column volumes. It is likely that such fast full equilibrium mainly results from endcapping and is not due to the silica’s purity as the purity of the underlying silica from different column manufacturers must vary to some extent but has little effect on the speed of full equilibrium. The SB-Phenyl, SB-C18 and Extend C18 columns all provide full equilibrium in about five column volumes whereas the Rx-C18 column was so slow that we simply did not run it long enough to reach full equilibrium under any of our conditions. The Extend C18 phase is endcapped but the dual attachment of the ligand to the silica support might not adequately block silanol interactions. Also, the history of this column is complex and it is possible that some of the endcapping material was lost. The Rx-C18 column required the longest time to reach full equilibrium as its silanol groups are not sterically protected, the column is not endcapped and the underlying silica support is more acidic than other phases. We conclude that one should use endcapped columns preferably with high purity type B silica to get fast full equilibrium within two column volumes which can then be achieved even with phosphoric acid containing buffers such as TEAP. Furthermore, we believe similar fast full equilibration is possible using other buffer systems such as 0.1 % (v/v) acetic or perchloric acid.
Fig. 9.
Effect of the stationary phase type on full equilibration. Columns packed with SB-Phenyl 80 Å ( ), RX-C18 80 Å (
 ), SB-C18 80 Å (
 ), XDB-C8 80 Å (
 ), XDB-C18 80 Å (
 ), Extend C18 80 Å (
 ), ACE C18 100 Å (
 ), Discovery HS-C18 120 Å (
 ), Alltima C18 100 Å (
 ) and Inertsil ODS-3 90 Å (
 ) particles. Other conditions are described in Fig. 2.
3.8 Effect of the pore size
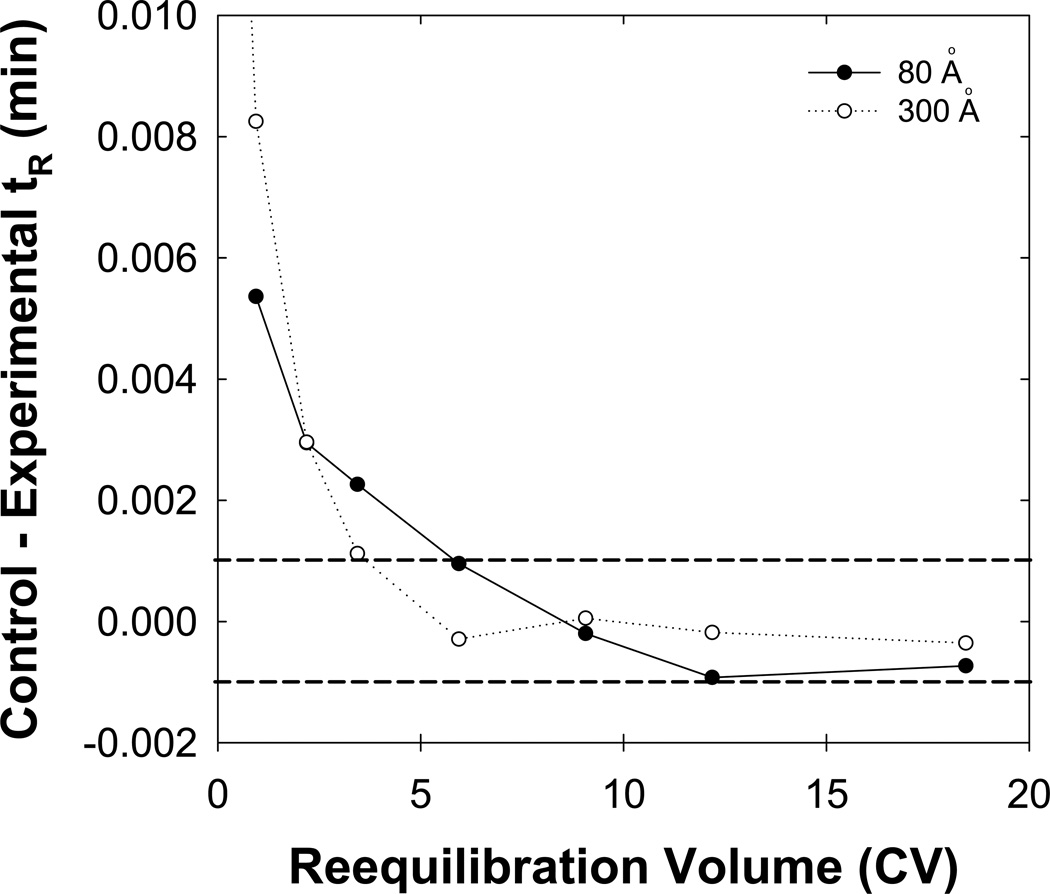
Previously, we found that particle pore size had minimal effects on achieving full equilibrium using neutral solutes and unbuffered eluents [7]. However, we expect that stationary phases with larger pores (i.e. 300 Å versus 80 Å) will lead to a more complete protection of the surface silanol groups due to increased surface coverage and decreased surface area (45 m2/g versus 180 m2/g). Fig. 10 shows that full equilibrium is reached faster using a SB-C18 phase with 300 Å particles (three column volumes) than one with 80 Å particles (five column volumes) for basic compounds and buffered eluents.
Fig. 10.
Effect of the particle pore size on full equilibration. SB-C18 particles with a pore size of 80 Å ( ) or 300 Å (
 ) were used. Other conditions are described in Fig. 2.
3.9 Effect of the gradient range
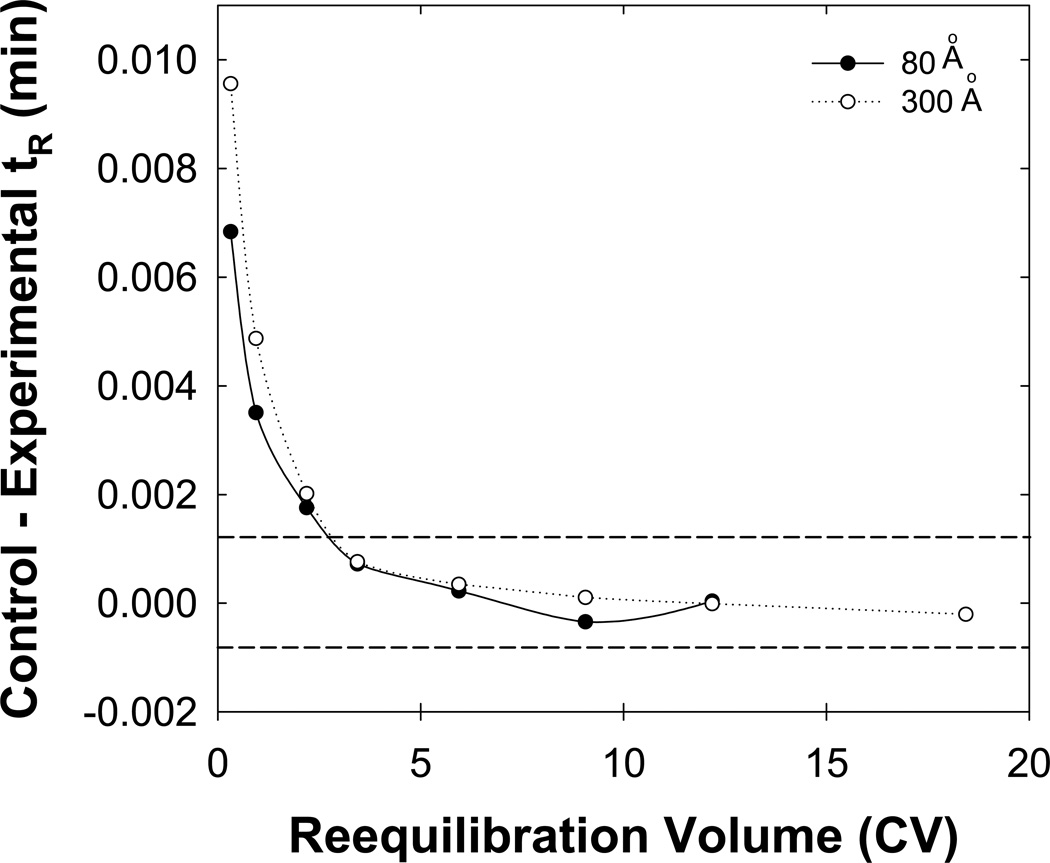
As the gradient range (i.e. difference in initial and final eluent composition) decreases, a separation becomes more “isocratic-like”. One advantage of isocratic elution is that reequilibration is not required. Thus, by this logic decreasing the gradient range should reduce the time needed for full equilibrium. However, one cannot decrease the gradient range without changing the sample so that all the solutes elute reasonably. Therefore, we used a mixture of tryptic peptides digested from bovine serum albumin which lends itself to use of a smaller gradient range. Fig. 11 shows the trend in retention with reequilibration time for the peptides that showed the greatest changes. Full equilibrium required less than three column volumes on the narrow pore column, in contradiction to the results shown in Fig. 10. We believe that a smaller gradient range decreases the time needed for full equilibrium on the narrow pore column.
Fig. 11.
Effect of a reduced gradient range on full equilibrium for tryptic peptides of bovine serum albumin (BSA). Two pore sizes of 300 Å ( ) or 80 Å (
 ) were used. Other conditions are described in Fig. 1.
3.10 Changes in selectivity for the “worst solute pair”
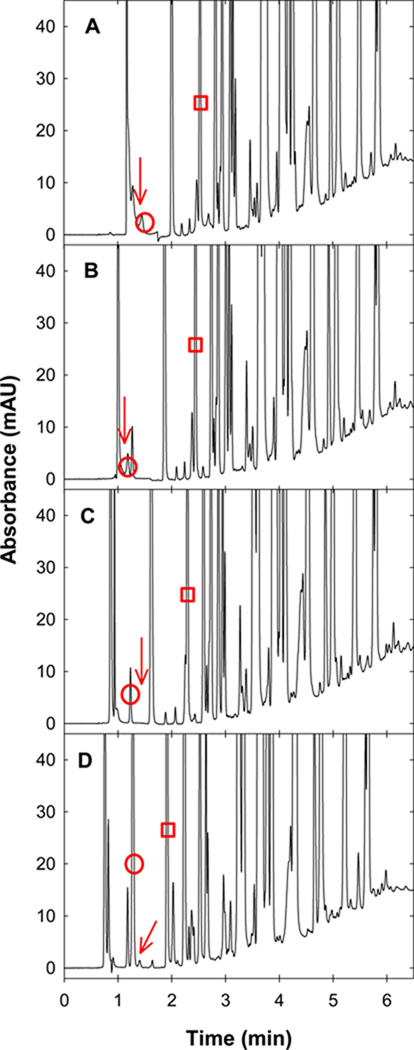
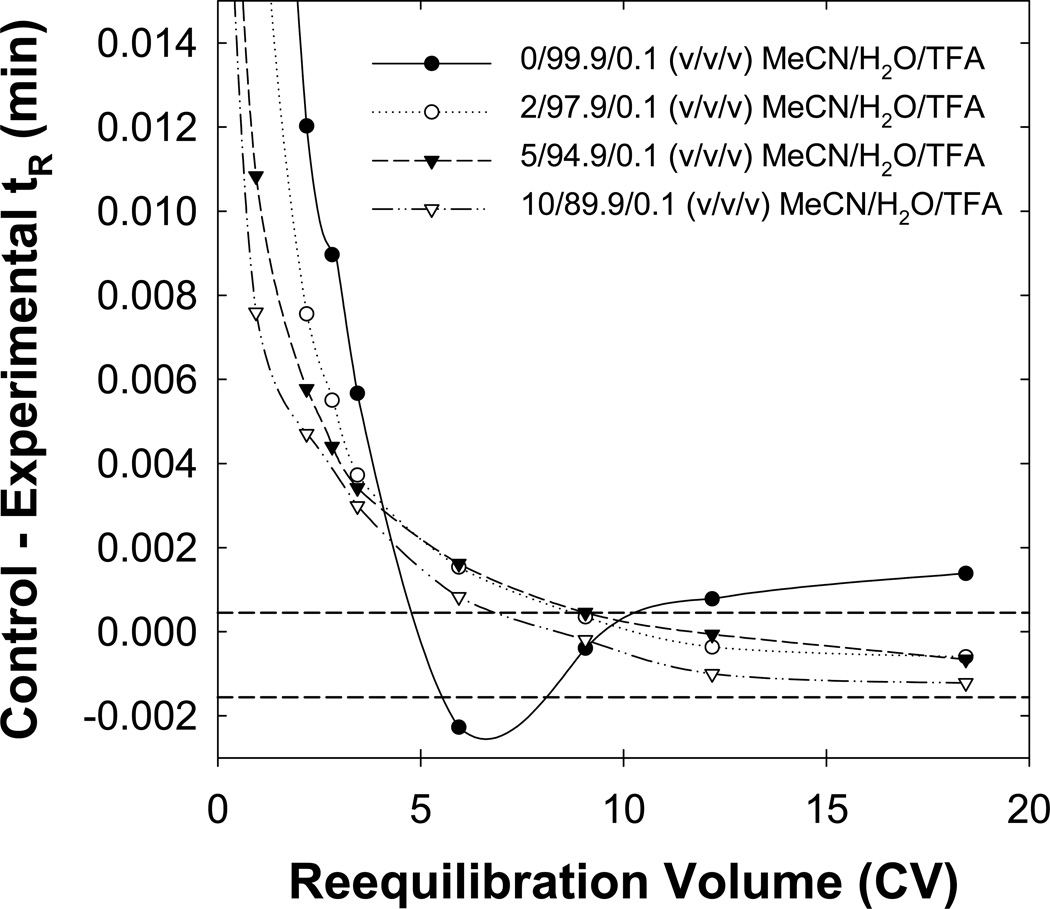
Clearly absolute solute retention within the “critical region” changes significantly with reequilibration time (see Fig. 2), but another important question remains: does the selectivity of these solutes change? To answer this question, we used a new SB-C18 column never exposed to n-butanol and an acetonitrile-H2O eluent with 0.1 % (v/v) TFA and no n-butanol. Fig. 12 shows that small changes in the initial eluent strength lead to significant changes in the selectivity of early eluting solutes. Furthermore, Fig. 13 shows that the initial eluent strength has a large effect on both the time to reach full equilibrium and that solute retention changes more using eluents without n-butanol. However, this column reached full equilibrium faster than did an identical column previously used to analyze a mixture of neutral solutes with an unbuffered eluent [7]. We believe this occurred because 1) the virgin column equilibrated faster than did the older column which had a long use history or 2) 0.1 % (v/v) TFA improved the stationary phase wetting.
Fig. 12.
Location of the “worst” solute and “worst” solute pair when changing the gradient range. Eluent A was varied from A) 0/99.9/0.1, B) 2/97.9/0.1, C) 5/94.9/0.1 to D) 10/89.9/0.1 (v/v/v) MeCN/H2O/TFA and Eluent B was always 90/9.9/0.1 (v/v/v) MeCN/H2O/TFA. Other conditions are described in Fig. 2. The red circle identifies the “worst” solute, the red arrow identifies the “worst” solute pair and the red rectangle represents the same solute in each separation.
Fig. 13.
Effect of the initial eluent strength on the time required for full equilibrium. Other conditions are described in Fig. 12.
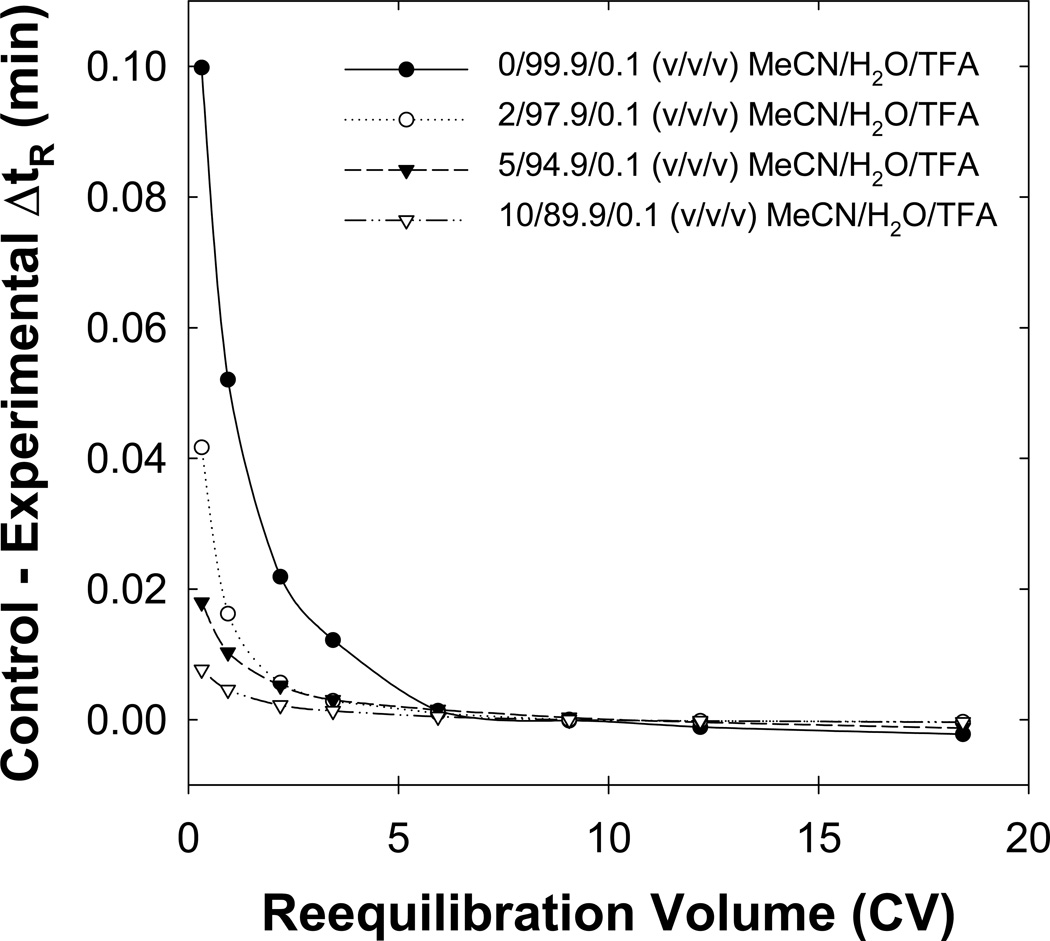
To study selectivity changes, we calculated the difference in retention time (ΔtR = tR,2 – tR,1) for adjacent peaks as a function of the reequilibration time. Furthermore, this difference in retention time is correlated with changes in the resolution (Rs) of the solute pair as shown in eqn. 1 where W is the solute’s baseline peak width. Fig. 14 shows that large changes in selectivity
| (1) |
occur when “weak” initial eluents were used but these selectivity changes become small after only five column volumes of reequilibration for all initial eluent strengths tested. All experiments discussed above (excluding those on SB-C18 using a TEAP buffer) show significantly smaller selectivity changes after much less than five column volumes of reequilibration (data not shown).
Fig. 14.
Effect of the initial eluent strength on the selectivity of the “worst solute pair.” Other conditions are described in Fig. 12.
3.11 The practical need for full equilibrium
Large changes in solute retention might occur as a function of the reequilibration time, especially when the eluent does not contain n-butanol (see Section 3.10). However, longer reequilibration times typically resulted in retention changes of the “worst” solute by less than 0.010 min and even smaller changes in the selectivity of the “worst” solute pair. Such small changes in retention time (0.01 min) and selectivity are probably acceptable in the vast majority of routine chromatographic work. Thus, only the most exacting work will require full equilibrium.
One requires accurate and reproducible data to parameterize models of gradient elution retention time as a function of conditions (gradient time, composition, temperature) to accurately predict retention and thus optimize a method. Thus, for modeling purposes one should use longer reequilibration times (i.e. five to ten column volumes) to ensure that sufficiently accurate values of retention time are obtained. Furthermore, only a few runs are required during method development. Thus, the need for longer reequilibration times to obtain full equilibration during method development is not a significant limitation. Conversely, a long reequilibration time would significantly impede sample throughput for routine separations. We recommend adding n-butanol to the eluent during method development only when one requires fast (ca. better than 3 column volumes) full equilibrium for the final separation.
4. Conclusions
In this study we found ways to reduce the time need to bring about full equilibrium for basic compounds in buffered eluents. Two factors strongly affect full equilibrium: stationary phase wetting and pH equilibration. Use of higher flow rates and eluent strengths or the addition of a small amount (1– 3 % (v/v)) of an ancillary solvent (n-propanol or n-butanol) to the eluent improved the rate of achieving full equilibrium. Some buffer types (TFA, FA), even without butanol in the eluent, allowed equilibration just as rapidly as did neutral solutes in unbuffered eluents but others equilibrated more slowly (TEAP). Furthermore some types of stationary phases (well endcapped, very high purity silica) behaved well with all buffers but some phases were slow to equilibrate with the TEAP buffer system. Use of larger pore size packings decreased the time to reach full equilibrium. Separations done with smaller gradient ranges often required less time to get to full equilibrium. Under all conditions we found that changes in retention and selectivity are often small (< 0.01 min) requiring less than five column volumes of reequilibration when eluents with 1 % (v/v) n-butanol are used. Obtaining full equilibrium is probably only important during method development so as to obtain accurate modeling of solute retention and when fast reequilibration (less than 3 column volumes) is also required.
Acknowledgements
The authors acknowledge financial support from the National Institutes of Health (grant # 5R01GM054585-09). We also thank Professor Peter Schoenmakers for his critical comments and suggestions involving the importance of stationary phase wetting on full equilibrium.
Footnotes
Publisher's Disclaimer: This is a PDF file of an unedited manuscript that has been accepted for publication. As a service to our customers we are providing this early version of the manuscript. The manuscript will undergo copyediting, typesetting, and review of the resulting proof before it is published in its final citable form. Please note that during the production process errors may be discovered which could affect the content, and all legal disclaimers that apply to the journal pertain.
References
- 1.Snyder LR, Glajch JL, Kirkland JJ. Practical HPLC Method Development. New York: Wiley-Interscience; 1996. [Google Scholar]
- 2.Snyder LR, Dolan JW. High-Performance Gradient Elution: The Practical Application of the Linear-Solvent-Strength Model. Hoboken, New Jersey: John Wiley & Sons, Inc.; 2007. [Google Scholar]
- 3.Snyder LR. Gas Chromatography, Proceedings of the International Symposium on Gas Chromatography (Europe); 1971. p. 81. [Google Scholar]
- 4.Dolan JW. LC-GC. 2003;21:968. [Google Scholar]
- 5.Cole LA, Dorsey JG. Anal. Chem. 1990;62:16. doi: 10.1021/ac00200a004. [DOI] [PubMed] [Google Scholar]
- 6.Warner DL, Dorsey JG. LC-GC. 1997;15:254. [Google Scholar]
- 7.Schellinger AP, Stoll DR, Carr PW. J. Chromatogr. A. 2005;1064:143. doi: 10.1016/j.chroma.2004.12.017. [DOI] [PubMed] [Google Scholar]
- 8.Marchand DH, Williams LA, Dolan JW, Snyder LR. J. Chromatogr. A. 2003;1015:53. doi: 10.1016/s0021-9673(03)01216-0. [DOI] [PubMed] [Google Scholar]
- 9.Schellinger AP, Stoll DR, Carr PW. J. Chromatogr. A. 2008 doi: 10.1016/j.chroma.2008.01.062. in press. [DOI] [PMC free article] [PubMed] [Google Scholar]
- 10.Thompson JD, Brown JS, Carr PW. Anal. Chem. 2001;73:3340. doi: 10.1021/ac010091y. [DOI] [PubMed] [Google Scholar]
- 11.Scott RPW, Simpson CF. Faraday Symp. Chem. Soc. 1980;15:69. [Google Scholar]
- 12.Rafferty JL, Zhang L, Siepmann JI, Schure MR. Anal. Chem. 2006 doi: 10.1021/ac0705115. in preparation. [DOI] [PubMed] [Google Scholar]
- 13.Patthy M. J. Chromatogr. A. 1992;592:143. [Google Scholar]
- 14.Bosch E, Espinosa S, Roses M. J. Chromatogr. A. 1998;824:137. [Google Scholar]
- 15.Laitinen HA. Chemical Analysis: An Advanced Text and Reference. New York: McGraw-Hill Book Company, Inc.; 1960. [Google Scholar]
- 16.Espinosa S, Bosch E, Roses M. J. Chromatogr. A. 2002;964:55. doi: 10.1016/s0021-9673(02)00558-7. [DOI] [PubMed] [Google Scholar]
- 17.Subirats X, Bosch E, Roses M. J. Chromatogr. A. 2004;1059:33. doi: 10.1016/j.chroma.2004.09.085. [DOI] [PubMed] [Google Scholar]
- 18.McDonald PD. Advances in Chromatography. New York: Marcel Dekker; 2003. p. 323. [PubMed] [Google Scholar]
- 19.Schellinger AP, Carr PW. LC-GC. 2004;22:544. [Google Scholar]


