

Summary
Reactive oxygen species are implicated in many human diseases and aging process. Much of the evidence is based on experimental data indicating increasing rates of lipid peroxidation in disease states and the ameliorating effects of antioxidants. It is becoming increasingly evident that the natural antioxidants, which have basically a phenolic structure, play an important role in protecting tissues against free radical damage. Eugenol (4-allyl-2 methoxyphenol), is one among such naturally occurring phenolic compounds. The antioxidant activity of eugenol is evaluated by the extent of protection offered against free radical mediated lipid peroxidation using both in vitro and in vivo studies. The in vitro lipid peroxidation is induced in mitochondria by (Fe(II)-ascorbate) or (Fe(II) + H2O2). The lipid peroxidation is assessed colorimetrically by measuring the formation of thiobarbituric acid reactive substances (TBARS) following the reaction of oxidized lipids with TBA. Eugenol inhibits both iron and Fenton reagent mediated lipid peroxidation. The inhibitory activity of eugenol is about five fold higher than α-tocopherol and about ten fold less than the synthetic antioxidant, BHT. The in vivo antioxidant activity of eugenol is evaluated by the determination of certain biochemical parameters (SGOT, Cyt.P450, glucose-6-phosphatase), peroxidation products and histopathological examination of •CCl3 radical induced hepatotoxicity in rats. Eugenol significantly inhibits the rise in SGOT activity and cell necrosis without protecting the endoplasmic reticulum (ER) damage as assessed by its failure to prevent a decrease in glucose-6-phosphatase activity. The protective action of eugenol has been found to be due to interception of secondary radicals derived from ER lipids rather than interfering with primary radicals of CCl4 (•CCl3/CCl3OO•).
Keywords: reactive oxygen species, antioxidants, eugenol, lipid peroxidation, TBARS, carbon tetrachloride
1. INTRODUCTION
Reactive oxygen species (ROS) are continuously generated in aerobic cells as by-products of oxidative metabolism (1). ROS at low levels have been shown to play important roles acting as secondary messengers for signal transduction pathways associated with cell growth and differentiation (2). Increased production of ROS above the normal physiological levels can damage lipids, proteins, and DNA leading to cellular injury (3). However, cells possess enzymatic and non-enzymatic antioxidant defense systems to protect against such damage. Oxidative stress is caused by production of oxidants exceeding the antioxidant capacity of the cells (4). Oxidative stress has been shown to be involved in many pathological conditions such as cardiovascular diseases, cancer, diabetes, arthritis and aging process (3, 5). The toxicity of a wide range of chemicals and drugs is also associated with oxidative stress (6). The contentious issue of research in this area has been to understand whether a given exogenous antioxidant elicits beneficial responses against ROS mediated injury. Several studies have suggested that a diet rich in antioxidants either delays or protects against age associated diseases (7,8,9).
Compounds, that have phenolic groups, have long been known to exhibit antioxidant properties by quenching free radical species through loss of a hydrogen atom. During this process the antioxidant phenolic group is converted into a phenoxyl radical species which is more stable due to electron delocalization within adjacent benzene rings or dimerization. Thus phenoxyl radical is less harmful and does not react with many substrate molecules. The antioxidant property of the phenolic group is dependent on the ease with which it can lose electron to scavenge a radical.
(·OH= hydroxyl radical, ROH = phenolic compound). Several studies suggest that natural and synthetic antioxidants protects against ROS mediated cellular damage (8). The synthetic antioxidants such as BHT, BHA and propyl gallate (PG) are extensively used in food processing industries as preservatives (9). The toxicity concerns of some of these synthetic antioxidants have therefore shifted the focus to the identification of naturally occurring antioxidants (10). By and large the natural antioxidants have phenolic structure and these may occur in a variety of plants. Examples of common plant phenolic antioxidants include flavonoids, cinnamic acid derivatives, coumrins, tocopherols and polyfunctional organic compounds (11).
Spices are used in food preparations not only as flavoring and aromatic agents but also for a multitude of their medicinal values. The active principles, which are mostly phenolic compounds, are responsible for the flavor, aroma, pungency and the medicinal value of whole spice (12). Eugenol is one of the several phenolic compounds, and is found in various plants like basil, cinnamon and clove. It is the major component of clove oil, known for its aroma and medicinal values. The structure of eugenol is depicted in Fig 1. The antioxidant activity of eugenol was evaluated using both in vitro and in vivo methods. Rat liver mitochondria are used as a substrate, in view of the fact that this organelle is rich in polyunsaturated fatty acids that are more susceptible to lipid peroxidation than proteins and DNA.
Fig.1. Chemical nature of eugenol.
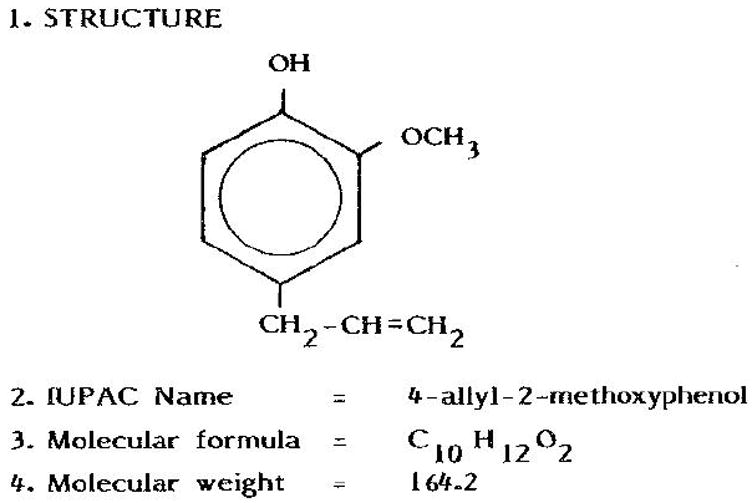
Eugenol is a naturally occurring phenolic compound found in many plant products.
The inhibition of lipid peroxidation in vitro by an antioxidant may not necessarily imply that the same antioxidant would protect against free radical mediated injury in vivo as well. In order to elicit protective responses from the free radical mediated damage in vivo, the antioxidant has to gain access and be present at the loci in the cell where the free radicals attack. One of the frequently used methods to induce oxidative stress in animals is to expose them to carbon tetrachloride (CCl4) or acetaminophen. This model has been typically used for many years to investigate the effect of antioxidants in the liver xenobiotic metabolism (13, 14). Therefore in our studies to evaluate the antioxidant activity of eugenol in vivo, oxidative stress was induced in rats by administering CCl4 (hepatotoxicant). For the in vitro studies however, lipid peroxidation was induced in mitochondria by (Fe(II)-ascorbate) or (Fe(II) + H2O2) systems.
2. Materials and Reagents
2.1 . Induction of lipid peroxidation in vitro (Fe(II)-ascorbate or Fe(II)-H2O2 induced peroxidation)
-
1
Mitochondria: Mitochondria are prepared from the liver tissue of adult rats that are fasted overnight. After decapitation the liver is rapidly excised and placed immediately in ice cold KCl (1.15%) solution. Use of sucrose is avoided in view of its interference with the estimation of malondialdehyde. Ten grams of liver is minced and homogenized in 30 ml ice cold KCl solution using a Potter-Elvehjem homogenizer. The homogenate is centrifuged at 800 g for 10 min at 2-4 °C to sediment cell debris and nuclei. The supernatant is separated and centrifuged again at 14000 g for 10 min at 2-4 °C to pellet the mitochondria. The mitochondria are suspended in 0.15 M KCl or 0.15 M NaCl solution and stored in refrigerator (48 to 72 hours). The protein content of the mitochondrial preparation is determined by the method of Lowry et al (15). For all experiments the mitochondrial preparation is diluted in 0.15 M KCl solution to obtain a concentration of 1mg protein/ml.
-
2
0.125M KCl - 0.025 M Tris-HCl buffer pH 7.4: Prepare 0.25 M KCl by dissolving 18.635 g in 1000 ml deionized distilled (dd) water. Dissolve 3.03 g TRIS ultra pure in 500 ml of 0.25 M KCl solution, adjust the pH to 7.4 with 1M HCl and make up the volume to 1000 ml with dd water. Store buffer at 4 °C; this is stable for 3 months.
-
3
Ethanol (70%): 30 ml water mixed with 70 ml absolute ethanol.
-
4
Eugenol solution (E-5504, Sigma). 40 mM eugenol stock solution is prepared by diluting 154 μl (164.2 mg) of eugenol in 24.846 ml 70 % alcohol. This solution is kept in a dark bottle and stored at 4 °C. The stock solutions are prepared once a week. Working standards are freshly prepared on the day of the experiment and used.
2 mM eugenol: 50μl eugenol stock is made up to 1ml with 70% alcohol.
4 mM eugenol: 100 μl eugenol stock is made up to 1 ml with 70% alcohol
6 mM eugenol: 150 μl eugenol stock is made up to 1 ml with 70% alcohol
8 mM eugenol: 200 μl eugenol stock is made up to 1 ml with 70 % alcohol.
10 mM eugenol: 250 μl eugenol stock is made up to 1 ml with 70% alcohol
-
6
Malondialdehyde (MDA): 4.0 mM stock MDA is prepared by hydrolyzing 9.6 μl (8.812 mg) of 1,1,3,3-tetraethoxypropane (T9889, Sigma) in 10 ml 0.1N HCl (100° C for 5 min). The stock is stored for a maximum of one week in cold. 100 μl of this solution is diluted to 10 ml (100 fold dilution) in KCl-Tris buffer saline, pH 7.4 which corresponds to 40 μM or 40 nmoles/ml MDA. Working standards are prepared freshly every day.
-
6
α - Tocopherol (47783, Sigma): Small aliquots of α-tocopherol are dissolved in 10 ml ethanol and stored in a brown bottle in refrigerator. The optical density of the stock solution is measured at 292 nm after appropriate dilutions. The concentration of this stock α-tocopherol is calculated using the mM extinction coefficient of 3.26. The final concentration of α- tocopherol is adjusted to 10 mM with 70% ethanol.
-
7
Butylated hydroxytolune (BHT), 99 %(W218405 Aldrich): 25 mM stock BHT is prepared by dissolving 139 mg in 25 ml of 70% ethanol. It can be stored in cold for upto 3 months. 100 μl of stock is diluted to 10 ml (100 fold) with 70% ethanol to obtain 0.25 mM working solution.
-
8
Ferrous sulfate (Fe-II) (1mM): Dissolve 13.90 mg in 50 ml of dd water (This solution should be prepared just before use).
-
9
Ascorbic acid (10mM): 17.61 mg is dissolved in 10 ml of dd water. (This solution is prepared every day)
-
10
TCA (20% w/v): 20 g dissolved in 100 ml of dd water.
-
11
TBA (0.67%) (5500, Sigma): 670 mg TBA dissolved in 80 ml of dd water and then heated at 50 °C for 45 min in a water bath and the volume made up to 100 ml.
-
12
0.15 M NaCl: Dissolve 8.766 g in dd water and dilute to 1 liter.
-
13
Ferrous sulfate (8 mM): Dissolve 22.24 mg in 10 ml dd water.
-
14
Hydrogen peroxide (H2O2) (H-1009, Sigma): 10 mM stock hydrogen peroxide is prepared by diluting 11.32 μl of H2O2 (30%) in 100 ml dd water. The exact concentration of this solution is determined by absorption at 240nm using the molar extinction coefficient of 40 M−1 cm −1. Stock solutions are prepared everyday.
2.2. In vivo lipid peroxidation
Rats: Rats weighing 225-275 g obtained from the Institute’s colony.
1.15% KCl solution: 1.15 g dissolved in minimum water and diluted to 100 ml.
Starch (5%) solution: Dissolve 5 g soluble starch in 80 ml distilled water, warm until it forms slurry and make up to a final volume of 100 ml.
-
Cytochrome p-450:
Sodium dithionite:
Carbon monoxide gas: CO gas cylinder is procured from commercial sources.
0.1M Phosphate buffer pH 7.4: Prepare 0.1 M disodium phosphate (Na2HPO4) by dissolving 14.186 g in dd water and dilute to1 liter. Prepare 0.1 M monosodium phosphate (NaH2PO4) by dissolving 12 g in dd water and dilute to 1 liter. Adjust the pH of disodium phosphate solution to 7.4 with monosodium phosphate solution.
-
Serum glutamic-oxaloacetic transaminase (SGOT):
0.2 mM L-Aspartate potassium (A6558, Sigma): Dissolve 3.424 g in 80 ml of 0.1M phosphate buffer, adjust the pH to 7.4 with 1 N NaOH, and make up the volume to 100 ml. Dispense in aliquots and store frozen; thaw an aliquot on the day of use.
0.1 mM α-Ketoglutarate sodium (K1875, Sigma): 1.681 g dissolved in 80 ml of 0.1 M phosphate buffer and adjusted the pH to 7.4. The volume is made up to 100ml. Dispense in aliquots and store frozen; thaw an aliquot on the day of use.
1mM NADH dipotassium salt (N 4505, Sigma): 7.416 mg dissolved in phosphate buffer and diluted to 10 ml. Prepared freshly before use and kept in dark (photo sensitive).
Malic dehydrogenase solution (M 9004, Sigma): Keep refrigerated.
0.1M Phosphate buffer pH 7.4: see section 2.2.4.3
-
Glucose 6-phosphatase (G-6-pase)
G-6-pase substrate solution: 130 mg glucose-6-phosphate (G7879, Sigma) and 130 mg barium chloride (BaCl2) are suspended in 2 ml distilled water. This suspension is dissolved by adding a minimum amount of 1N HCl. To this 72 mg of anhydrous sodium sulfate (Na2SO4) is added, mixed well and centrifuged. The BaSO4 is precipitated; the supernatant is checked for the completion of precipitation by the addition of a very small amount of Na2SO4. The pH of the supernatant is adjusted to 6.5 with 0.5N NaOH and the volume is made up to 5 ml.
Maleate Buffer (100mM): 1.1607 g maleic acid is dissolved in 70 ml, and the pH is adjusted to 6.5 with NaOH, volume is made up to 100 ml.
TCA 10% (w/v): 10 grams to 100 ml in dd water.
-
TBARS
20% TCA: See the section 2.1.10
0.67% TBA: See section 2.1.11
n-Butanol
3. Methods
Thiobarbituric acid (TBA) test is a commonly used method to determine lipid peroxidation. This method is based on the reaction of TBA with malondialdehyde (MDA), one of the aldehyde products of lipid peroxidation. The sample is heated with TBA under acidic conditions; MDA forms an adduct with TBA and produces a pink colored product, which is measured spectrophotometrically at 532 nm (16). There is considerable controversy regarding the specificity of TBA for MDA because several other substances in tissues and body fluids can also react nonspecifically with TBA producing a chromogen with absorbance between 530 to 535 nm. However, MDA has been shown to be a predominant product when cellular organelles are subjected to peroxidation in vitro. Hence TBA assay has been extensively used for studies on lipid peroxidation in vitro.
3.1 In vitro lipid peroxidation
3.1.1. Fe(II)-ascorbic acid induced peroxidation
Lipid peroxidation is induced in mitochondria using ferrous sulfate and ascorbate (17). Ferrous iron is known to initiate lipid peroxidation, and ascorbate enhances the ferrous ion mediated peroxidation by its ability to maintain the iron in the reduced state. The exact mechanism of iron mediated lipid oxidation is not known. It is believed that iron perferryl ion (Fe(III) --- O·2−), hydroxyl radical (•OH), maintenance of specific Fe(II)-Fe(III)--O2 ratio or combination of all these radical species initiates the peroxidation.
The contents and volume of the reagents are shown in table 1A.
Eugenol is added 2 min prior to initiation of reaction with iron.
The samples are incubated at 37°C for 60 min.
Peroxidation is terminated by adding 1.0 ml 20% TCA solution and 50 μl 0.2% BHT solution to samples
One ml of 20% TCA solution and 50 μl of 0.2% BHT solution are added to standards (table 1B).
One ml of thiobarbituric acid solution is added and heated for 15 min at 100 °C in water bath or dry bath. Subsequently the tubes are kept on ice for cooling.
The tubes are centrifuged at 3000 rpm to precipitate the proteins.
The OD of the supernatant is read at 532 nm to measure the TBARS.
- The values of MDA in samples are calculated using MDA standards (Fig.2) and expressed in nmoles/mg microsomal protein.
Table 1.
| A: Inhibitory effect of eugenol on Fe(II)-ascorbate induced lipid peroxidation in rat liver mitochondria. | |||||||||
|---|---|---|---|---|---|---|---|---|---|
| Antioxidant | Mitochondri (ml) |
KCl- Tris Buffer (ml) |
70% ethanol |
Antioxidant | Final antioxidant concentration |
Ascorbate (200μM) |
Fe(II) (10μM) |
OD at 530 |
MDA (nmol/ mg protein) |
| 0 | 0.5 | 1.5 | - | - | - | - | - | 0.011 | 0.705 |
| 0 (cont) | 0.5 | 1.46 | 10μl | - | - | 20 μl | 10 μl | 0.673 | 31.7 |
| Eugenol 2 mM | 0.5 | 1.46 | ---- | 10 μl | 10 μM | 20 μl | 10 μl | 0.350 | 16.5 |
| Eugenol 4 mM | 0.5 | 1.46 | ---- | 10 μl | 20 μM | 20 μl | 10 μl | 0.154 | 7.24 |
| Eugenol 6 mM | 0.5 | 1.46 | ---- | 10 μl | 30 μM | 20 μl | 10 μl | 0.078 | 3.67 |
| Eugenol 8 mM | 0.5 | 1.46 | ---- | 10 μl | 40 μM | 20 μl | 10 μl | 0.043 | 2.02 |
| Eugenol 10 mM | 0.5 | 1.46 | ---- | 10 μl | 50 μM | 20 μl | 10 μl | 0.009 | 0.476 |
| α-tocoph 10 mM | 0.5 | 1.46 | -- | 10 μl | 50 μM | 20 μl | 10 μl | 0.375 | 17.7 |
| BHT 0.25 mM | 0.5 | 1.46 | -- | 10 μl | 1.25 μM | 20 μl | 10 μl | 0.324 | 15.25 |
| B. MDA standards | |||
|---|---|---|---|
| MDA (nmoles) | MDA Std volume |
Buffer | OD at 532 |
| 0.0 | 0.0 | 2 ml | 0.008 |
| 0.625 | 31.25 | 1.969 | 0.034 |
| 1.25 | 62.5 | 1.937 | 0.059 |
| 2.5 | 125 | 1.875 | 0.133 |
| 5.0 | 250 | 1.750 | 0.222 |
| 10.0 | 500 | 1.5 | 0.438 |
Fig.2. Malondialdehyde standard curve.
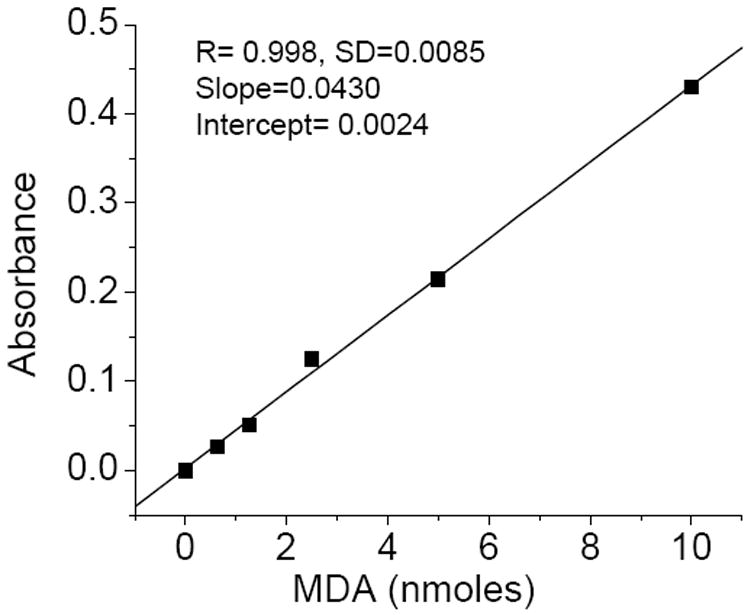
The preparation of MDA, the contents of reaction mixture and incubation conditions are described in materials and reagents (2.1.) and methods section (3.1.1)
3.1.2. Fenton reagent (Fe(II) +H2O2) induced lipid peroxidation
Ferrous iron in presence of H2O2 is known to induce lipid peroxidation (18). This reaction is conducted in 0.15 M NaCl, pH 7.0 since some buffering agents are known to scavenge hydroxyl radicals.
The contents and volumes of the reaction mixtures are shown in table 2.
Eugenol is added 2 min prior to initiation of reaction with ferrous sulfate
After adding all the reagents, the samples are incubated at 37 °C for 60 min.
Peroxidation is terminated by adding 1.0 ml 20% TCA solution and 50 μl 0.2% BHT solution.
1 ml of TBA solution is added and heated for 15 min at 100 °C in water bath. The tubes are transferred on to ice for cooling.
The tubes are centrifuged to precipitate the proteins.
The OD of the supernatant is measured at 532 nm and the MDA concentration is determined using standard curve (Fig 2) (see above).
Table 2.
Inhibitory effect of eugenol on Fe(II)-H2O2 induced lipid peroxidation in rat liver mitochondria.
| Antioxidant | Mitochondria 0.5mg | 0.15M NaCl (ml) | 70% alcohol | antioxidant (μl) | Final antioxidant | H2O2 (100 μM) | Ferrous (200 μM) | OD at 530 | nmoles MDA/mg protein |
|---|---|---|---|---|---|---|---|---|---|
| 0 | 0.5 ml | 1.5 | - | - | - | - | - | 0.0112 | 0.72 |
| 0 (cont) | 0.5 ml | 1.420 | 10ul | - | - | 20 μl | 50 μl | 0.640 | 30.1 |
| Eugenol 2 mM | 0.5 ml | 1.420 | ---- | 10ul | 10 μM | 20 μl | 50 μl | 0.340 | 16.2 |
| Eugenol 4 mM | 0.5 ml | 1.420 | ---- | 10ul | 20 μM | 20 μl | 50 μl | 0.218 | 10.4 |
| Eugenol 6 mM | 0.5 ml | 1.420 | ---- | 10ul | 30 μM | 20 μl | 50 μl | 0.142 | 6.7 |
| Eugenol 8 mM | 0.5 ml | 1.420 | ---- | 10ul | 40 μM | 20 μl | 50 μl | 0.032 | 1.5 |
| Eugenol 10 mM | 0.5 ml | 1.420 | ---- | 10ul | 50 μM | 20 μl | 50 μl | 0.014 | 0.64 |
| α-tocoph 10 mM | 0.5 ml | 1.420 | --- | 10ul | 50 μM | 20 μl | 50 μl | 0.382 | 18.0 |
| BHT 0.25 mM | 0.5 ml | 1.420 | --- | 10ul | 1.25 μM | 20 μl | 50 μl l | 0.318 | 15.0 |
In vivo lipid peroxidation
Effect of eugenol on in vivo lipid peroxidation mediated by CCl4
CCl3OO· radical initiates lipid peroxidation in the liver cells leading to hepatotoxicity
-
Animals and treatment:
Male rats weighing 200-250 g are divided into 5 groups, each group containing a minimum of 6 rats.
Varying doses of eugenol (0.2, 1, 5, 25 mg) are suspended in 5% soluble starch and administered to rats by oral gavage such that the administered volume would correspond to 2.5 ml/kg.
Each dose of eugenol is given thrice at different time intervals. These are prior to (-1hr) along with (0hr) and after (+3hr) the administration of CCl4.
CCl4 suspended in peanut oil (0.4 ml/kg) is given i.p adjusting the administered volume to 2.5 ml/kg body wt.
Blood is collected after 24 hrs from orbital sinus and the rats are sacrificed after 48 hrs of dosing with CCl4.
Blood sample and liver tissue are collected.
Blood is centrifuged at 3000 RPM for 10 min. The plasma is separated and stored at -80 °C.
Liver microsomes: Rats are killed by decapitation; livers are rapidly excised and placed immediately in ice cold 1.15% KCl solution. 10 g liver is minced and homogenized in ice cold 30 ml KCl solution. The homogenate is centrifuged at 12,000 g for 10 min at 4 °C to remove cell debris, nuclei and mitochondria. The supernatant containing microsomes is centrifuged at 105,000 g for 60 min at 2 to 4 °C. The microsomal pellet is resuspended in 1.15% KCl. The protein content of this preparation is determined by the method of Lowry as mentioned above. Microsomes are stored at -80 °C and all the analysis is completed within a week.
-
Determination of TBARS in liver.
2 grams of liver is placed in 5 ml of cold 20% TCA solution
Liver is minced and homogenized using Polytron homogenizer.
The homogenate is centrifuged at 3000 rpm for 10 min.
2 ml of supernatant is incubated with 2 ml of 0.67% 2-thiobarbituric acid at 100°C for 15 min and chilled on ice.
The color is extracted into 2 ml of n-butanol and absorbance is measured immediately at 532 nm.
The amount of TBARS is calculated using molar extinction coefficient of MDA as 1.56 × 10⁵.
-
Serum glutamic-oxaloacetic transaminase (SGOT):
SGOT activity is determined according to Karmen et al (19)
20 μl clear non-hemolysed serum is added to 680 μl phosphate buffer, pH 7.4.
Further, 100 μl aspartate solution, 100μl NADH and 50 μl malic dehydrogenase are added and the tubes are shaken by hand.
The tubes are allowed to stand at room temperature for 15 min.
The reaction is initiated by addition of 50 μl of α-ketoglutarate and kept at 25°C for 5 min. The change in optical density is measured in a Hitachi spectrometer at 340 nm against blank.
The activity is expressed as units per ml of serum/minute. One unit is equal to a decrease in optical density of 0.001 under conditions described.
-
Cytochrome p-450 is determined according to the method of Omura and Sato (20)
1 ml microsomal suspension (1mg protein) in 0.1 M phosphate buffer pH 7.0 is treated with few grains of dithionite and taken in the reference and sample cuvettes.
The base line is recorded from 400 nm to 500 nm in Hitachi spectrophotometer.
The contents of the sample cuvette are transferred into a tube and carbon monoxide gas is gently bubbled for one minute in chemical fume hood.
The contents are transferred back to the sample cuvette and the spectrum is recorded again from 400 nm to 500 nm. The intense peak appears approximately at 450 nm.
- The cytochrome p450 concentration is determined by the difference in absorption between 450 nm and 490 nm of reduced p450 with CO (as CO complex) and without CO using extinction coefficient of 91 mM-1cm -1
0.091 = O.D difference with CO and without CO that corresponds to 1 nmol/ml
-
Glucose 6-phosphatase (G-6-Pase)
G-6-Pase activity in microsomes is determined according to the method of Swanson (1955) (21); the released inorganic phosphorus is determined according to Chen et al (1956) (22)
50 μl microsomes from the stock of 2mg/ml are added to 850 μl 0.05 M maleic acid buffer pH 6.5.
Further, 100 μl substrate solution is added and mixed well.
The mixture is incubated at 37 °C for 15 min.
The reaction is terminated by adding 1 ml of 10% TCA and chilled on ice.
The samples are centrifuged at 3000 RPM for 15 min.
An aliquot of the supernatant solution is used for determination of inorganic phosphorus.
-
Histopathological examination of the liver
Small slices of about 20mm × 15mm × 2 to 3 mm thick portions from the middle lobe of the liver are fixed in 10% neutral formalin (10 ml of 37 – 40 % commercial formaldehyde solution made up to 100 ml with phosphate buffer pH 7.4). Tissues are processed in an automated tissue processor in ascending grades of isopropanol (70% , 80% 100%) one hour in each station followed by one hour of 3x chloroform for clearing and finally 3 hours of 3x paraffin infiltration ( 58 – 60 °C) under a vacuum. Paraffin blocks of the tissue are made and sectioned in a rotary manual microtome using disposable knife blades. 6 μm paraffin sections are stained with Meyer’s hematoxylin-eosin (AFIP methods). Tissue sections are examined under a 10 x objective with a final magnification of 125x. Hepatocellular necrosis is graded as follows: No necrosis =0; Necrosis around centrilobular vein= 1.0; Necrosis or fatty changes involving 1/3 of the lobule 2.0; Necrosis of more than 1/3 of lobule = 3.0. Figure 3 shows the liver histology:
Fig.3. Effect of eugenol administration on CCl4 induced liver necrosis.
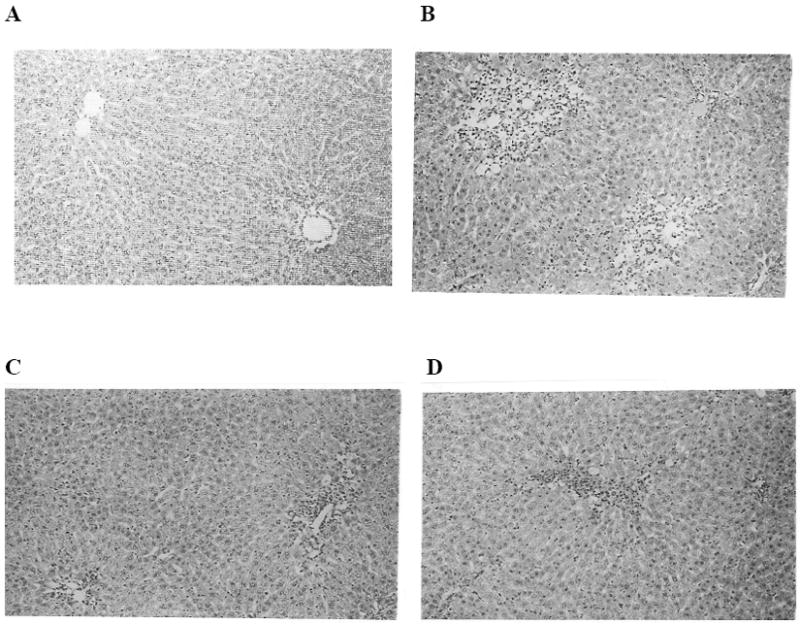
A) Photograph of liver from control rat, which received only vehicles (starch and peanut oil) exhibited normal liver architecture. Hematotoxylin (HE) × 100. B) Histology of liver from CCl4 treated rat indicating centrizonal necrosis. Necrosis score 2.0. C) Liver necrosis of rat treated with eugenol (1mg /kg body wt) + CCl4 (liver necrosis is 1.25). D) Liver necrosis showing moderate centrizonal necrosis from a rat, which received eugenol (5 mg/kg body wt) and CCl4
4. NOTES
Metal contamination is common in water and buffer solutions. Metals like iron and copper, in presence of reducing agents, activate oxygen which oxidizes the lipids, proteins and DNA. Therefore, it is very important to use metal free water for the preparation of reagents. Water from Milli Q water system at resistivity of 18 Mega ohms cm -1 is preferable.
Metal free buffers and water can be prepared by passing through Chelex 100 (200-400 mesh sodium form) resin.
Metal contamination in solutions can be verified easily by monitoring the loss of ascorbic acid based on its absorbance at 265 nm. Metals promote autoxidation of ascorbic acid (23).
When preparing mitochondria or microsomes, keep liver on ice, and homogenize it in ice cold saline to minimize the oxidation of lipids.
Store microsomes and mitochondria in deaerated isotonic solutions in the refrigerator. Use within 48 hours. Do not freeze the mitochondria or microsomes when using them as substrates for lipid peroxidation.
Phenolic antioxidants, vitamin E and BHT are soluble in alcohol. Alcohol also scavenges radical species. Care should be taken to ensure that the total alcohol concentration in incubation mixture is less than 0.5%.
Prepare ferrous sulfate solution in water just before use. Do not prepare iron solution in buffers. Always use freshly prepared solutions.
Add test compounds 2 to 5 minutes prior to addition of peroxidation inducer and mix it well.
Break-down products of lipid hydroperoxides formed during the heating process also produces color similar to MDA. Add 50μl of 0.2% BHT to minimize this lipid hydroperoxide contribution to MDA color soon after the reaction is completed.
Keep marbles on test tubes to minimize the evaporation of water while heating the reaction mixtures for MDA determination. Replace if there is any water loss.
Stock hydrogen peroxide is standardized with potassium permanganate method or by molar extinction coefficient. Working standard solutions of lower concentrations should be prepared just before use.
The possible interactions of antioxidants with TBA color development can be tested by adding a test compound to MDA standard or sample control soon after stopping the reaction with TCA.
5. Conclusion
An antioxidant is defined as any substance that, when present at low concentrations compared with those of an oxdizable substrate, significantly delays or prevents oxidation of that substrate (24). The oxidation of substrates is prevented by either directly scavenging ROS or indirectly by inhibiting the production of ROS and promoting the antioxidant defense system. This chapter describes the evaluation of the antioxidant activity of eugenol by testing the free radical scavenging activity and/or inhibition of radical production. Since eugenol is a lipophilic compound, it’s ability to scavenge chain propagating radicals (alkoxyl and peroxyl), which form during lipid peroxidation is mainly investigated. Mitochondria are rich in polyunsaturated fatty acids, highly susceptible to lipid peroxidation and major sources for free radical generation. Therefore, liver mitochondria are used as substrates for lipid peroxidation studies.
The results show that eugenol inhibits iron and ·OH radical initiated lipid peroxidation with IC 50 values of 10 μM and 14 μM respectively. The inhibitory activity of eugenol is 5 times more than α-tocopherol and 10 times less than BHT. Eugenol is incorporated into mitochondrial membrane and inhibits lipid peroxidation by acting as chain breaking agent (25, 26).
Eugenol (0.2, 1.0, 5.0 or 25 mg/kg) when given orally at three different times in relation to the time of CCl4 dosing (i.p administration of 0.4 mg/kg), i.e. prior to (-1 hr), along with (0 hr) or after (+ 3 hrs), prevented significantly the rise in SGOT activity, lipid peroxidation as well as liver necrosis. The protective effect was more evident at 1 mg and 5 mg eugenol doses than at 0.2 and 25 mg does. However, the decrease in microsomal G-6-pase activity by CCl4 treatment was not prevented by eugenol suggesting that the damage to endoplasmic reticulum is not protected (27). The protective effect of eugenol against CCl4 induced hepatotoxicity is due to interception of secondary radicals derived from oxidized lipids of endoplasmic reticulum rather than interference with generation and reactions of primary radicals (•CCl3/CClOO•)
Table 3.
Effect of eugenol treatment on serum GOT, microsomal P450, G-6-Pase and hepatic necrosis in rats administered CCl4.
| Treatment | Serum GOT U/ml | Cyt- P450 nmol/mg protein | G-6-Pase μmol Pi released /hr/mg protein | Hepatic necrosis score |
|---|---|---|---|---|
| Control | 18 ± 4 | 0.74 ± 0.10 | 10.5 ± 0.57 | 0.0 |
| CCl4 (0.4ml/kg) | 380 ± 45 | 0.38 ± 0.04* | 2.6 ±0.41* | 2.0 ± 0.0 |
| CCl4 (0.4ml/kg) + Eugenol (0.2mg/kg) | 225 ± 35* | 0.36 ± 0.03* | 2.8 ± 0.24* | 2.0 ± 0.0 |
| CCl4 (0.4ml/kg) + Eugenol (1.0 mg/kg) | 160 ± 20** | 0.41 ± 0.04* | 2.4 ± 0.11* | 1.5 ± 0.28* |
| CCl4 (0.4ml/kg) + Eugenol (5.0 mg/kg) | 150 ± 21*** | 0.34 ± 0.028* | 2.5 ± 0.22* | 1.25 ± 0.25* |
| CCl4 (0.4ml/kg) + Eugenol (25mg/kg) | 220 ± 27* | 0.45 ± 0.036* | 2.2 ± 0.10* | 2.0 ± 0.25 |
Serum is collected after 24 hrs of CCl4 and assayed for GOT activity. An asterisk indicated a significant difference between CCl4 and eugenol + CCl4 treatment.
p< 0.01,
P<0.01,
P<0.01.
Rats are sacrificed after 48 hrs of CCl4 dose. Microsomal cyto-p450, G-6-phosphatase* significantly different from controls, P< 0.01 and liver necrosis, * significantly different from CCl4 treatment, P< 0.01.
Results are mean ± SE for 4-6 rats
Acknowledgments
Grant support: This research was supported by National Institute of Nutrition, Indian Council of Medical Research, Hyderabad, India and Intramural Research Program of the NIH, National Institute on Aging.
References
- 1.Stogner SW, Payne DK. Oxygen toxicity. Ann Pharmacother. 1992;26:1554–1562. doi: 10.1177/106002809202601214. [DOI] [PubMed] [Google Scholar]
- 2.Hoidal JR. Reactive oxygen species and cell signaling. Am J Respir Cell Mol Biol. 2001;25:661–663. doi: 10.1165/ajrcmb.25.6.f213. [DOI] [PubMed] [Google Scholar]
- 3.Beckman KB, Ames BN. The free radical theory of aging matures. Physiol Rev. 1998;78:547–581. doi: 10.1152/physrev.1998.78.2.547. [DOI] [PubMed] [Google Scholar]
- 4.McCord JM. Human disease, free radicals, and the oxidant/antioxidant balance. Clin Biochem. 1993;26:351–357. doi: 10.1016/0009-9120(93)90111-i. [DOI] [PubMed] [Google Scholar]
- 5.Droge W. Free radicals in the physiological control of cell function. Physiol Rev. 2002;82:47–95. doi: 10.1152/physrev.00018.2001. [DOI] [PubMed] [Google Scholar]
- 6.Valko M, Morris H, Cronin MT. Metals, toxicity and oxidative stress. Curr Med Chem. 2005;12:1161–1208. doi: 10.2174/0929867053764635. [DOI] [PubMed] [Google Scholar]
- 7.Ames BN, Shigenaga MK, Hagen TM. Oxidants, antioxidants, and the degenerative diseases of aging. Proc Natl Acad Sci U S A. 1993;90:7915–7922. doi: 10.1073/pnas.90.17.7915. [DOI] [PMC free article] [PubMed] [Google Scholar]
- 8.Lopez-Velez M, Martinez-Martinez F, Del Valle-Ribes C. The study of phenolic compounds as natural antioxidants in wine. Crit Rev Food Sci Nutr. 2003;43:233–244. doi: 10.1080/10408690390826509. [DOI] [PubMed] [Google Scholar]
- 9.Daniel JW. Metabolic aspects of antioxidants and preservatives. Xenobiotica. 1986;16:1073–1078. doi: 10.3109/00498258609038984. [DOI] [PubMed] [Google Scholar]
- 10.Shahidi F. Antioxidants in food and food antioxidants. Nahrung. 2000;44:158–163. doi: 10.1002/1521-3803(20000501)44:3<158::AID-FOOD158>3.0.CO;2-L. [DOI] [PubMed] [Google Scholar]
- 11.Scalbert A, Williamson G. Dietary intake and bioavailability of polyphenols. J Nutr. 2000;130:2073S–2085S. doi: 10.1093/jn/130.8.2073S. [DOI] [PubMed] [Google Scholar]
- 12.Singh UP, Singh DP, Maurya S, Maheshwari R, Singh M, Dubey RS, Singh RB. Investigation on the phenolics of some spices having pharmacotherapeuthic properties. J Herb Pharmacother. 2004;4:27–42. [PubMed] [Google Scholar]
- 13.Yasuda H, Izumi N, Shimada O, Kobayakawa T, Nakanishi M. The protective effect of tinoridine against carbon tetrachloride hepatotoxicity. Toxicol Appl Pharmacol. 1980;52:407–413. doi: 10.1016/0041-008x(80)90335-x. [DOI] [PubMed] [Google Scholar]
- 14.Gee DL, Bechtold MM, Tappel AL. Carbon tetrachloride-induced lipid peroxidation: simultaneous in vivo measurements of pentane and chloroform exhaled by the rat. Toxicol Lett. 1981;8:299–306. doi: 10.1016/0378-4274(81)90117-x. [DOI] [PubMed] [Google Scholar]
- 15.Lowry OH, Rosebrough NJ, Farr AL, Randall RJ. Protein measurement with the Folin phenol reagent. J Biol Chem. 1951;193:265–275. [PubMed] [Google Scholar]
- 16.Wilbur KM, Bernheim F, Shapiro OW. The thiobarbituric acid reagent as a test for the oxidation of unsaturated fatty acids by various agents. Arch Biochem. 1949;24:305–313. [PubMed] [Google Scholar]
- 17.Fortney SR, Lynn WS., Jr Role of Ascorbate and Cysteine on Swelling and Lipid Peroxidation in Rat Liver Mitochondria. Arch Biochem Biophys. 1964;104:241–247. doi: 10.1016/s0003-9861(64)80010-2. [DOI] [PubMed] [Google Scholar]
- 18.Minotti G, Aust SD. The requirement for iron (III) in the initiation of lipid peroxidation by iron (II) and hydrogen peroxide. J Biol Chem. 1987;262:1098–1104. [PubMed] [Google Scholar]
- 19.Karmen A. A note on the spectrometric assay of glutamic-oxalacetic transaminase in human blood serum. J Clin Invest. 1955;34:131–133. [PubMed] [Google Scholar]
- 20.Omura T, Sato R. The Carbon Monoxide-Binding Pigment of Liver Microsomes. I. Evidence for Its Hemoprotein Nature. J Biol Chem. 1964;239:2370–2378. [PubMed] [Google Scholar]
- 21.Swanson MA. Glucose 6-phosphatase from liver. Methods Enzymol. 1955;2:541–543. [Google Scholar]
- 22.Chen PS, Toribara TY, Warner H. Microdetermination of Phosphorus. Analytical Chemistry. 1956;28:1756–1758. [Google Scholar]
- 23.Buettner GR. In the absence of catalytic metals ascorbate does not autoxidize at pH 7: ascorbate as a test for catalytic metals. J Biochem Biophys Methods. 1988;16:27–40. doi: 10.1016/0165-022x(88)90100-5. [DOI] [PubMed] [Google Scholar]
- 24.Halliwell B. How to characterize an antioxidant: an update. Biochem Soc Symp. 1995;61:73–101. doi: 10.1042/bss0610073. [DOI] [PubMed] [Google Scholar]
- 25.Nagababu E, Lakshmaiah N. Inhibitory effect of eugenol on non-enzymatic lipid peroxidation in rat liver mitochondria. Biochem Pharmacol. 1992;43:2393–2400. doi: 10.1016/0006-2952(92)90318-d. [DOI] [PubMed] [Google Scholar]
- 26.Nagababu E, Lakshmaiah N. Inhibition of microsomal lipid peroxidation and monooxygenase activities by eugenol. Free Radic Res. 1994;20:253–266. doi: 10.3109/10715769409147521. [DOI] [PubMed] [Google Scholar]
- 27.Nagababu E, Sesikeran B, Lakshmaiah N. The protective effects of eugenol on carbon tetrachloride induced hepatotoxicity in rats. Free Radic Res. 1995;23:617–627. doi: 10.3109/10715769509065281. [DOI] [PubMed] [Google Scholar]