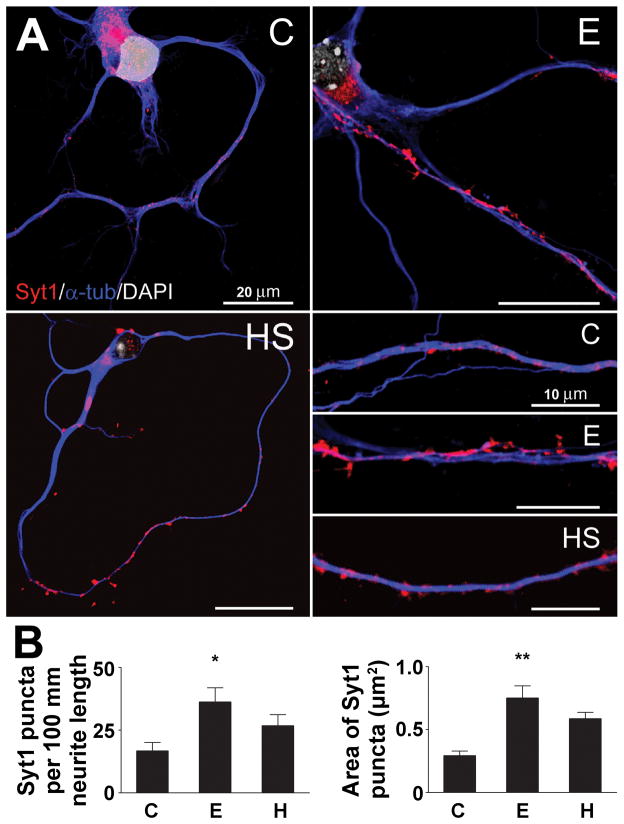
Figure 3. Ethanol treatment increases Syt1-positive clusters of immunoreactivity in cortical neurons.
A, Visualization of cortical neurons after treatment with 60 mM ethanol (E), a 42°C heat shock (HS) or vehicle control (C). Immunocytochemistry was performed using anti-Syt1 and anti-a-tubulin antibodies, and DAPI nuclear staining
B, Increase in the number and size of Syt1-positive clusters after neurons were treated with ethanol. The graphs show the number of Syt1-positive clusters per 100 mm neurite length and the average cluster size after neurons were exposed to 60 mM ethanol (E), a 42°C heat shock treatment (HS) or vehicle control (C). The quantification was performed with ImageJ software. The data were compared with control values by 1-way ANOVA with Dunnett’s multiple-comparison post-hoc test (n ≥ 6; length: F = 3.750, df = 22; area: F = 4.977, df = 569). All data are mean ± SEM (* significantly different at the level of p < 0.05, ** p < 0.01).

