Abstract
Ion mobility and mass spectrometry measurements have been used to examine the populations of different solution structures of the nonapeptide bradykinin. Over the range of solution compositions studied, from 0:100 to 100:0 methanol:water and 0:100 to 90:10 dioxane:water, evidence for ten independent populations of bradykinin structures in solution is found. In some solutions as many as eight structures may coexist. The solution populations are substantially different than the gas-phase equilibrium distribution of ions, which exhibits only three distinct states. Such a large number of coexisting structures explains the inability of traditional methods of characterization such as nuclear magnetic resonance spectroscopy and crystallography to determine detailed structural features for some regions of this peptide.
Ion mobility spectrometry (IMS) measurements of bradykinin (BK) ions show vast changes in the number (and relative abundance) of peaks when the solution composition is changed. When compared with populations that are known for the gas-phase quasi-equilibrium distribution of states,1 we find that the changes with solution composition must correspond to different numbers of structures in solution. It appears that during the electrospray ionization (ESI)2 process, populations of structures that are associated with solution equilibria are stabilized as solvent is removed, and the different species can be delineated based on differences in their gas-phase collision cross sections.3 The evaporative cooling that occurs during the ESI-drying process leads to a freezing out of different populations,4,5 making the gas-phase determination of the number of existing solution states highly complementary to efforts to determine conformations in solution by traditional methods.
The BK nonapeptide (Arg1–Pro2–Pro3–Gly4–Phe5–Ser6–Pro7–Phe8–Arg9) is a member of the kinins, a set of molecules discovered in 1909 that possess hypotensive activity.6 It was isolated in 1956,7 synthesized in 1960,8 and has been studied extensively because of its pain producing effect, involvement in inflammation, and its close association with numerous physiological conditions, including: sepsis; asthma; myocardial infarctions; and hyperalgesia.9–11 Despite the tremendous interest in this molecule, only a fraction of its structure is characterized in detail. Circular dichroism,12 Raman spectroscopy,13 nuclear magnetic resonance,14 and molecular modeling studies reveal that the BK Ser6–Pro7–Phe8–Arg9 residues favor a β-turn motif,15 whereas the region Arg1–Phe5 is apparently unstructured. This combination of ordered and disordered regions hinders a complete determination of the BK structure. Here, we show that at least ten different conformers exist across the range of solutions that are typically used to investigate BK. This plurality suggests that the uncharacterized Arg1–Phe5 region favors specific structures, but no single state dominates to the point that detailed geometries can be determined.
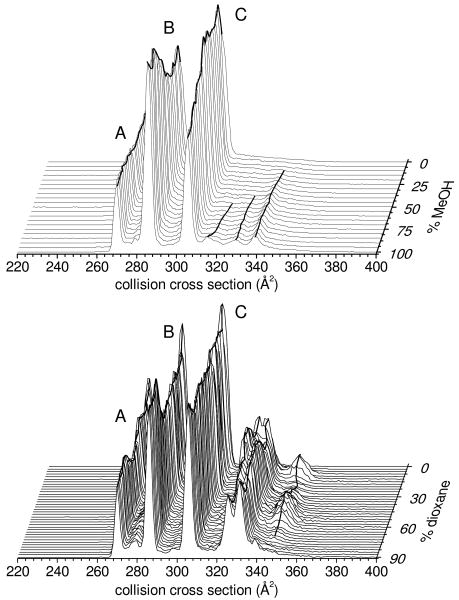
Figure 1 shows IMS distributions, plotted as collision cross sections (Ω),16 for [BK+3H]3+ ions that are typical upon electrospraying ∼10-6 to 10-4 M BK from 21 different methanol:water and 37 different dioxane:water solutions. These data were recorded with a home-built ∼2 m long drift tube that was filled with 3.00 ± 0.02 Torr of He (300 K) and utilized a drift field of 10.0 V·cm-1. IMS separations are often sensitive to differences in structures of the gas-phase ions.3,16–18 It is noteworthy that ESI of these solutions also produces [BK+2H]2+. Here, we focus on [BK+3H]3+ because many different structures are resolved. The IMS distribution for [BK+2H]2+ is dominated by a single broad peak, although field-asymmetric IMS measurements resolve six structures for this ion.19 As observed in Figure 1, the IMS distributions for [BK+3H]3+ contain three sharp peaks (at Ω = 269, 285, and 305 Å2) corresponding to the gas-phase structures A, B, and C, assigned previously.1 A close examination of these data shows that as the solution is changed, these peaks vary in abundance. For example, in the methanol:water data set peak B is favored from 100% methanol solutions; C is favored in more aqueous solutions.
Figure 1.
IMS distributions of [BK+3H]3+ from 21 different methanol:water (top) and 37 different dioxane:water (bottom) solutions, plotted on a collision cross section scale. These data represent the average of three data sets. Abundant conformers A, B, and C are labeled. Peak maxima are connected with solid lines to illustrate changes in conformation abundances.
In addition to these sharp features, some solutions produce ions having larger cross sections, extending to ∼350 Å2. The methanol:water system shows at least three reproducible features exist as elongated forms as the methanol concentration is increased. Significant populations of ions having larger cross sections are observed in dioxane:water solutions; additionally, the relative abundances of these peaks vary dramatically with solution composition. For example, ions with the largest cross section (Ω = 348 Å2) exhibit a remarkable dependence on the solution composition; they first appear when as little as 5% dioxane is added, then decrease as dioxane is increased to ∼20%, and subsequently increase and decrease again (from ∼30 to 60% dioxane).
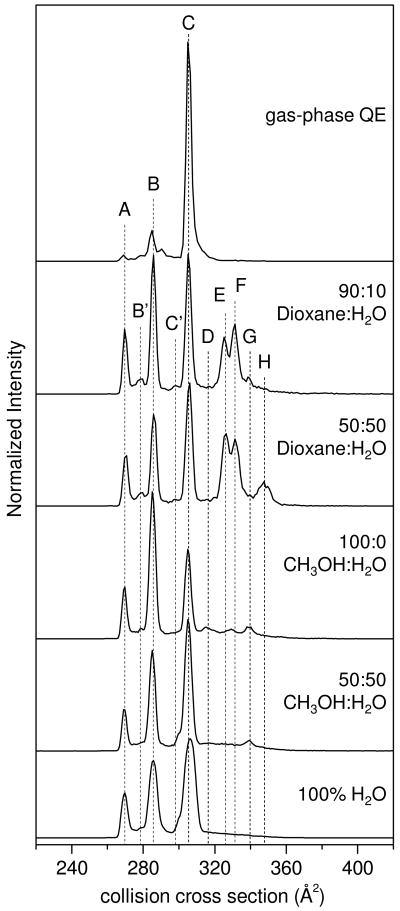
More insight into the origin of these peaks can be obtained by comparing these distributions with those that are known to correspond to structures that are formed in the gas phase.1 Using IMS–IMS techniques (described in detail elsewhere20) it is possible to select and activate any of the peaks shown in Figure 1. The activation energy that is used is above all barriers associated with transitions between states, but below the energy required for dissociation. This process results in a heating and cooling cycle that effectively anneals selected structures into more stable forms.18 The uppermost trace in Figure 2 is typical of that obtained upon selection of any of the ten reproducible peak maxima that are formed under different solution conditions. This is the gas-phase quasi-equilibrium distribution of states.1 It is dominated by the B (Ω = 285 Å2) and C (Ω = 305 Å2) structures, which comprise ∼16 ± 3 and 80 ± 2 percent of the gas-phase ion population, respectively; additionally, some more compact features [including peak A (Ω = 269 Å2)] account for the remaining 2 ± 0.3 percent of the population. That our present data appear so different than the gas-phase quasi-equilibrium distribution requires that there are substantial barriers between the ions that are initially formed from different solutions and those gas-phase structures that are favored upon annealing in the absence of solvent.
Figure 2.
Selected [BK+3H]3+ collision cross section profiles for five ESI solution conditions, and the gas-phase quasi-equilibrium (QE) distribution obtained by collisional annealing of a single conformer to form peaks A, B, and C. Dashed lines are inserted in order to guide the eye along peak centers for the ten labeled features.
As can be observed from Figure 2, BK distributions from several example solution conditions (0:100 CH3OH:H2O, 50:50 CH3OH:H2O, 100:0 CH3OH:H2O, 50:50 dioxane:H2O, and 90:10 dioxane:H2O) differ not only from the gas-phase equilibrium distribution, but are also dramatically different from one another. Substantially greater populations of the A and B states are produced and these solution-dependent data show many additional peaks– especially in regions beyond the 305 Å2 limit observed for ions formed from selection and activation of states in the gas phase. In total, there are ten reproducible peaks when all of the different solutions are considered. IMS data for some solutions (e.g., 90:10 dioxane:water) reveal that at least eight peaks are observed from a single solution. The structural differences that are observed for ions produced from these solutions require that transitions between states are influenced by the solvent composition.
The number of unique structures that are influenced by the solution composition can be assessed by examining the changes in peak intensities in Figures 1 and 2. This analysis is important for assessing how many unique conformations are present in solution because it rules out the possibility that multiple gas-phase ion structures originating from the same population of solution states are responsible for the large number of peaks. From studies that consider competition with [BK+2H]2+, we rule out that variations in the IMS spectra for [BK+3H]3+ are due only to changes associated with competition between charge states. It is interesting to consider how populations may evolve toward the gas-phase equilibrium distribution in the final stages of droplet evaporation. Simulations of mixed solvent clusters show changes in solvent composition in these small droplets.21 We cannot rule out such an effect here, however, our measured populations remain dependent on initial solution composition.
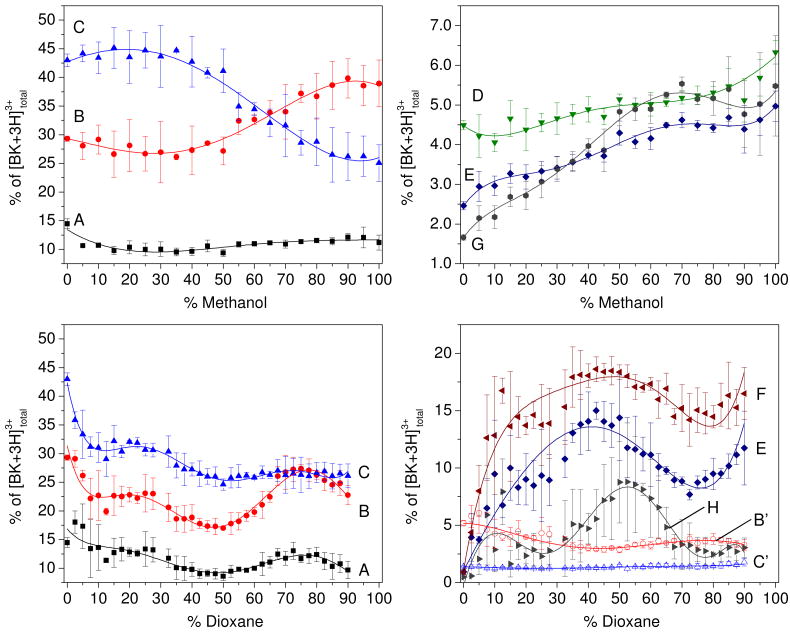
These arguments can be seen more clearly from the detailed analysis shown in Figure 3. The intensities of the largest peaks A, B, and C vary independently with solution composition. In 100% water, the A, B, and C peaks comprise ∼15, 30 and 45% of the distribution, respectively. In the methanol:water system the relative intensity of A remains virtually unchanged as the fraction of methanol is increased, whereas peak B increases from ∼25 to 40%, and peak C decreases from ∼40 to 25% (as the percentage of methanol is increased from 50 to 100%). In the dioxane:water system, all three A, B, and C peaks decrease in intensity (when dioxane is increased to ∼50%) and then the A and B states increase somewhat (as dioxane is increased from 50 to 90%). These variations require that each state is present as an independent population in solution. From a similar analysis of the smaller features it appears that in every case peaks also behave independently as the solution compositions vary. In total, this analysis provides evidence for at least ten distinct structural types across these ranges of solutions. This plurality of states is consistent with the lack of detailed structural information from conventional techniques, which are sensitive to only one, or at most a few, structures. But, it also suggests that the Arg1–Phe5 region is not completely random.
Figure 3.
Peak integrations as a percent of the total [BK+3H]3+ distribution for the ten labeled features in Figure 2. Percentage values for peaks A, B, C, D, E, and G are shown on top for the methanol:water solution set. Values for peaks A, B, C, F, E, H, and intermediate peaks B′ and C′ are shown below for the dioxane:water data set. Error bars represent the standard deviation from a triplicate analysis. Each set of points was fit with a polynomial function to illustrate change in conformer abundance as a function of solution composition.
Unlike the D through H structures that are formed only from specific solutions, we find it remarkable that the A, B, and C states can be formed in the gas phase (upon selection and ion activation) from any of the ten resolved peaks. One explanation is that A, B, and C emerge from solution as other structures and rapidly evolve into these preferred gas-phase conformations. That is, there are no substantive barriers between the solution- and gas-phase conformers, and that as the final solvent molecules leave the system these gas-phase structures are favored. Another interpretation is that the A, B, and C ion structures are left unchanged during the ESI process. In this interpretation, the solvent is irrelevant in establishing structure! This conclusion is especially intriguing because each of the A, B, and C states is observed directly from every solution condition, and can also be prepared in the absence of any solution. It becomes even more interesting if these large peaks not only retain, but actually form the structured Ser6–Arg9 β-turn motif that is measurable in solution.14 This idea extends several recent reports about large complexes22 as well as early oligomerization steps associated with peptide aggregation,5 which have suggested that these systems retain elements of solution structure in the gas phase.
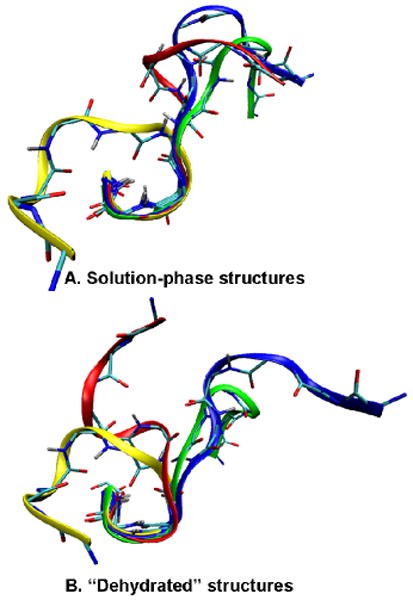
Enhanced sampling molecular dynamics simulations that provide insight about candidate structures for solution-phase and dehydrated [BK+3H]3+ ions are valuable in guiding our explanation of these results. These simulations are analogous to calculations described elsewhere.23,24 Here, we use the AMBER FF99SB all-atom force field and the GB/SA implicit solvent model to represent an aqueous environment. Dehydrated structures are generated from solution-phase candidate structures via energy minimization steps in vacuo; cross sections for dehydrated conformers that are favored are calculated using the trajectory method, available through the MOBCAL software.25 This approach mimics the transition of the molecule from solution to the gas phase.26 These simulations yield four populations of states, and the calculated cross sections for many low-energy structures agree with values measured for the A, B, and C populations. Figure 4 shows representative structures from these four populations. Each candidate structure is protonated on the N-terminus and the guanidine groups of Arg1 and Arg9. The solution-phase simulations appear to capture the Ser6–Arg9 β-turn motif (in three of the four structural types), consistent with experimental measurements in solution.14,15 The Arg1–Phe5 region shows structural variations that arise from charge solvation of the guanidine group of Arg1 by backbone carbonyl groups. Other populations (not shown) have cross sections that match the E and F peaks. These ions emerge as more elongated (almost linear) structures with each guanidine group protonated and the third proton freely migrating along the full length of the peptide. This theoretical treatment captures the idea that upon drying, solution structures can be trapped as stable gas-phase geometries. In the case of the A, B, and C states, the well-defined solution β-turn motif (Ser6–Arg9) persists, and it is the remaining region (Arg1–Phe5) that leads to distinct populations. Thus, the populations of states that are trapped upon dehydration reflect the solution composition. It is unknown to what extent the defined geometries associated with the Arg1–Phe5 region that persist in the gas phase resemble the antecedent solution structures.
Figure 4.

Examples of four low-energy conformations of solution-phase structures (A) and dehydrated structures (B) superimposed on the backbone atoms of Ser6–Pro7–Phe8–Arg9. Calculated cross sections of solution-phase structures are: 299 Å2 (blue); 285 Å2 (red); 274 Å2 (yellow); 296 Å2 (green). Cross sections of dehydrated structures are: 303 Å2 (blue); 285 Å2 (red); 271 Å2 (yellow); 297 Å2 (green).
Regardless of whether the gas-phase structures are identical to those in solution, the current data show that it is possible to monitor populations even when regions appear as “unstructured” from traditional techniques. These data underscore the importance of developing accurate, predictive computational tools that capture the transition from the solvated to the dehydrated state.
Acknowledgments
We gratefully acknowledge the partial funding for instrumentation development from the NIH (RC1GM090797-02) and from the Indiana University METAcyte initiative that is funded by a grant from the Lilly Endowment. L. Chen and D. H. Russell gratefully acknowledge support for this research by the Robert A. Welch Foundation (A-1176) and the U. S. Department of Energy, Division of Chemical Sciences, BES (BES-DE-FG-04ER-15520).
References
- 1.Pierson NA, Valentine SJ, Clemmer DE. J Phys Chem B. 2010;114:7777. doi: 10.1021/jp102478k. [DOI] [PMC free article] [PubMed] [Google Scholar]
- 2.Fenn JB, Mann M, Meng CK, Wong SF, Whitehouse CM. Science. 1988;246:64. doi: 10.1126/science.2675315. [DOI] [PubMed] [Google Scholar]
- 3.Hoaglund-Hyzer CS, Counterman AE, Clemmer DE. Chem Rev. 1999;99:3037. doi: 10.1021/cr980139g. [DOI] [PubMed] [Google Scholar]
- 4.Lee SW, Freivogel P, Schindler T, Beauchamp JL. J Am Chem Soc. 1998;120:11758. [Google Scholar]
- 5.Bernstein SL, Dupuis NF, Lazo ND, Wyttenbach T, Condron MM, Bitan G, Teplow DB, Shea JE, Ruotolo BT, Robinson CV, Bowers MT. Nat Chem. 2009;1(4):326. doi: 10.1038/nchem.247. [DOI] [PMC free article] [PubMed] [Google Scholar]
- 6.Abelous JE, Bardier E. CR Soc Biol. 1909;66:511. [Google Scholar]
- 7.Anrade SO, Roche E Silva M. Biochem J. 1956;64:701. doi: 10.1042/bj0640701. [DOI] [PMC free article] [PubMed] [Google Scholar]
- 8.Boissonnas RA, Guttmann St, Jaquenoud PA. Helv Chim Acta. 1960;43:1349. [Google Scholar]
- 9.Garcia LJ. Handb Exp Pharmacol. 1978;50:464. [Google Scholar]
- 10.Regoli D, Barabé J. Pharmacol Rev. 1980;32:1. [PubMed] [Google Scholar]
- 11.Hall JM, Morton IKM. In: The Kinin System. Farmer SG, editor. Academic Press; San Diego, CA: 1997. pp. 9–43. [Google Scholar]
- 12.Cann JR, Stewart JM, Matsueda GR. Biochemistry. 1973;12:3780. doi: 10.1021/bi00743a029. [DOI] [PubMed] [Google Scholar]
- 13.Takeuchi H, Harada I. J Raman Spectrosc. 1990;21:509. [Google Scholar]
- 14.Young JK, Hicks RP. Biopolymers. 1994;34:611. doi: 10.1002/bip.360340504. [DOI] [PubMed] [Google Scholar]
- 15.Hicks RP. Curr Med Chem. 2001;8:627. doi: 10.2174/0929867013373237. [DOI] [PubMed] [Google Scholar]
- 16.Mason EA, McDaniel EW. Transport Properties of Ions in Gases. Wiley; New York: 1988. [Google Scholar]
- 17.von Helden G, Hsu MT, Kemper PR, Bowers MT. J Chem Phys. 1991;95:3835–3837. [Google Scholar]
- 18.Hunter J, Fye J, Jarrold MF. Science. 1993;260:784. doi: 10.1126/science.260.5109.784. [DOI] [PubMed] [Google Scholar]
- 19.Shvartsburg AA, Li F, Tang K, Smith RD. Anal Chem. 2006;78:3706. doi: 10.1021/ac052020v. [DOI] [PMC free article] [PubMed] [Google Scholar]
- 20.Koeniger SL, Merenbloom SI, Valentine SJ, Jarrold MF, Udseth HR, Smith RD, Clemmer DE. Anal Chem. 2006;78:4161. doi: 10.1021/ac051060w. [DOI] [PubMed] [Google Scholar]
- 21.Ahadi E, Konermann L. J Am Chem Soc. 2011;133:9354. doi: 10.1021/ja111492s. [DOI] [PubMed] [Google Scholar]
- 22.Ruotolo BT, Giles K, Campuzano I, Sandercock AM, Bateman RH, Robinson CV. Science. 2005;310:1658. doi: 10.1126/science.1120177. [DOI] [PubMed] [Google Scholar]
- 23.Gao YQ, Yang L. J Chem Phys. 2006;125:114103. doi: 10.1063/1.2244548. [DOI] [PubMed] [Google Scholar]
- 24.Chen L, Shao Q, Gao YQ, Russell DH. J Phys Chem A. 2006;115:4427. doi: 10.1021/jp110014j. [DOI] [PubMed] [Google Scholar]
- 25.Mesleh MF, Hunter JM, Shvartsburg AA, Schatz GC, Jarrold MF. J Phys Chem. 1996;100:16082. [Google Scholar]
- 26.Grabenauer M, Wu C, Soto P, Shea JE, Bowers MT. J Am Chem Soc. 2010;132:532. doi: 10.1021/ja905595k. [DOI] [PubMed] [Google Scholar]


