

Abstract
Rat umbilical cord matrix stem cells (UCMSC) have been shown to exhibit a remarkable ability to control rat mammary adenocarcinoma (Mat B III) cell proliferation both in vivo and in vitro. To study the underlying mechanisms and genes involved in Mat B III growth attenuation, total RNA was extracted from the naïve rat UCMSC alone and those co-cultured with Mat B III in Transwell culture dishes. Gene expression profiles of naive rat UCMSC alone and those co-cultured with Mat B III cells were investigated by microarray analysis using an Illumina RatRef-12 Expression BeadChip. The comparison of gene expression profiles between untreated and co-cultured rat UCMSC identified five up-regulated candidate genes (follistatin (FST), sulfatase1 (SULF-1), glucose phosphate isomerase (GPI), HtrA serine peptidase (HTRA1), and adipocyte differentiation-related protein (ADRP)) and two down-regulated candidate genes (transforming growth factor, beta-induced, 68kDa (TGFβI) and podoplanin (PDPN)) based upon the following screening criteria: 1) expression of the candidate genes should show at least a 1.5 fold change in rat UCMSC co-cultured with Mat B III cells; 2) candidate genes encode secretory proteins; and 3) they encode cell growth-related proteins. Following confirmation of gene expression by real time-PCR, ADRP, SULF-1 and GPI were selected for further analysis. Addition of specific neutralizing antibodies against these three gene products individually in co-cultures of 1:20 rat UCMSC:Mat B III cells significantly increased cell proliferation, implying that these gene products are produced under the co-cultured condition and functionally attenuate cell growth. Immunoprecipitation followed by Western blot analysis demonstrated that these proteins are indeed secreted into the culture medium. Individual over-expression of these three genes in rat UCMSC significantly enhanced UCMSC-dependent inhibition of cell proliferation in co-culture. These results suggest that ADRP, SULF-1 and GPI act as tumor suppressor genes, and these genes might be involved in rat UCMSC-dependent growth attenuation of rat mammary tumors.
Keywords: Rat umbilical cord matrix stem cells, Rat mammary tumor cells, Mat B III, Microarray, Real time PCR, Thymidine uptake, Tumor suppressor genes, ADRP, GPI, SULF-1
Introduction
Umbilical cord matrix stem cells (UCMSC) represent a promising source of therapeutics for various diseases including cancer. The tumor-tropism of UCMSC has been reported1–3 and was utilized for targeted delivery of therapeutic genes for cancer therapies in mouse preclinical studies4, 5 This type of stem cell-based cancer-targeted delivery of therapeutic genes, drugs, or nanoparticles has been successfully tested with UCMSC as well as with various mesenchymal stem cells (MSC) from bone marrow, neuronal tissues or adipose tissues6–10. The benefit of using UCMSC is the ease of preparing relatively large quantities of stem cells without feeder cells2, 11, the absence of ethical concerns with the origin of the stem cells, and the lack of tumorigenicity of the cells3.
Recently, Khakoo et al. showed that bone marrow-derived MSC have intrinsic antitumor effects on Kaposi sarcoma in a nude mouse model12. Through in vitro and in vivo studies they proved that MSC cause antitumor effects through direct contact with the Kaposi sarcoma cells. On the contrary, several studies have reported that bone marrow MSC support tumor growth both directly and indirectly 13–15. Since tumor cells appear to recruit circulating bone marrow MSC and create the appropriate tumor micro environment, supporting tumor growth may be a reasonable function for bone marrow MSC. However, Ganta et al. have shown that naïve rat UCMSC have an anti-proliferative effect on rat Mat B III mammary adenocarcinoma cells in vitro and have demonstrated that rat UCMSC treatment completely abolishes Mat B III grafts in vivo with no recurrence during a lengthy survival study 2. This powerful antitumor effect has been confirmed in interspecies transplantation in pancreatic14 and lung carcinoma-bearing mice16. The rat UCMSC antitumor effect does not appear to be cell contact-dependent since conditioned medium from rat UCMSC2, 16, as well as rat UCMSC separated from cancer cells by Transwell inserts, significantly attenuated cancer cell growth. In addition, rat UCMSC-dependent attenuation of cell proliferation may be more pronounced by exposure to tumor cells such as Mat B III cells. These findings suggest that rat UCMSC produce specific factors with an anti-proliferative effect and expression of these factors may be increased in the presence of Mat B III cells. However, the existence and identity of rat UCMSC-dependent anti-proliferative factors has yet to be clarified.
To clarify the anti-proliferative factors produced by rat UCMSC, the following hypotheses were formulated: 1) rat UCMSC-dependent antitumor factors are produced by specific genes; 2) these factors should be secretory gene products and are cell growth regulation-related proteins; and 3) the proteins’ expression profiles may be modified when rat UCMSC are co-cultured with mammary tumor cells. Testing these hypotheses will clarify the underlying mechanisms and potential genes involved in rat UCMSC-dependent tumor growth attenuation. Accordingly, gene expression profiles of naive rat UCMSC alone and those co-cultured with Mat B III cells were investigated by microarray analysis using a rat genome-wide gene expression bead chip. The microarray analysis initially suggested 16 candidate genes. The differential expression of 7 genes was confirmed by quantitative real-time PCR (qRT-PCR). Further analysis revealed that at least three genes have a tumor suppressor function and are associated with rat UCMSC-dependent antitumor activity.
Materials and Methods
Cell culture
Rat UCMSC were harvested from E19 pregnant Fisher 344 rats according to the method previously described2. The rat UCMSC were maintained in low-serum defined medium containing the following mixture per 100 mL: 57 mL low-glucose DMEM (Invitrogen, Carlsbad, CA), 37 mL MCDB 201 (Sigma-Aldrich, St Louis, MO), 2 mL fetal bovine serum (FBS;Equitech Bio, Inc., Kerrville, TX), 1 mL 100× insulin-transferrin-selenium-X (Invitrogen); 1 mL 0.15 g/mL AlbuMax1 (Invitrogen), 1 mL 100× Pen/Strep (Invitrogen), 10 nmol/L dexamethasone (Sigma-Aldrich), 100 μmol/L ascorbic acid 2-phosphate (Sigma-Aldrich), 10 ng/mL epidermal growth factor (R&D Systems, Minneapolis, MN), and 10 ng/mL platelet derived growth factor-BB (R&D Systems). The Mat B III rat mammary adenocarcinoma cell line (ATCC, Manassas, VA) was maintained in McCoy’s 5A modified medium (Invitrogen) supplemented with 10% FBS and 1% of 100× Pen/Strep (Invitrogen). Primary rat uterus fibroblasts from Fisher 344 rat pups were prepared following an established method17. Rat uterus fibroblasts were cultured in DMEM/Ham’s F-12 medium (1:1) (Invitrogen) supplemented with 10% FBS and 1% of 100× Pen/Strep (Invitrogen). All cells were cultured at 37°C in a humidified atmosphere containing 5% CO2.
Antibodies
Rabbit and goat polyclonal antibodies against adipose differentiation-related protein (ADRP), sulfatase-1 (SULF-1), glucose phosphate isomerase (GPI), decorin, and glyceraldehyde-3-phosphate dehydrogenase (GAPDH) were purchased from Santa Cruz Biotechnology, Inc. (Santa Cruz, CA). Horseradish peroxidase-conjugated anti-rabbit, anti-goat IgG antibodies were obtained from GE Healthcare Bioscience Corp (Piscataway, NJ) and Santa Cruz Biotechnology, Inc.
Indirect Co-culture of rat UCMSC with Mat B III cells and RNA isolation
Indirect co-culture of rat UCMSC (1 × 10⁵ cells per dish) with Mat B III cells (1.5 × 10⁶ cells per dish) were carried out using a Transwell cell culture system (Corning Life Sciences, Lowell, MA), which allows free diffusion of substances without contact between tumor cells and stem cells. Mat B III cells were cultured in a Transwell insert with a porous membrane (10 cm in diameter, pore size 0.4 μm), and rat UCMSC were maintained in the bottom of the culture dish using defined medium. Total RNA was isolated from the rat UCMSC co-cultured with or without Mat B III cells using TRIzol (Invitrogen) according to the manufacturer’s protocols. The concentration and quality of the samples were measured by the NanoDrop ND-1000 spectrophotometer (NanoDrop Technologies, USA) and Agilent 2100 bioanalyzer (Agilent Technologies, Inc. Santa Clara, CA), respectively.
Microarray analysis procedures
Microarray experiments including RNA quality evaluation, hybridization, and initial data analysis were carried out at the National Institute on Aging, National Institutes of Health (Baltimore, MD). For each sample, biotinylated cRNA was prepared using an Illumina Total Prep RNA Amplification Kit (Applied Biosystems, Foster City, CA, USA). Briefly, 5μg of total RNA were converted to double stranded cDNA using T7-oligo (dT) primers, followed by an in vitro transcription (IVT) reaction to amplify biotinylated cRNA as described in manufacturer’s instructions (Illumina Inc., San Diego, CA). The biotinylated cRNA was hybridized to a RatRef-12 Expression BeadChip platform that contains 22,519 probes (Illumina Inc.). The hybridization, washing, and scanning were performed according to the manufacturer’s instructions. The chips were scanned using a BeadScan 2.3.0.10 (Illumina Inc.) at a multiplier setting of 2. The microarray images were registered and extracted automatically during the scan using the manufacturer’s default settings.
Microarray data analysis
The resulting microarray dataset was analyzed with DIANE 6.0, a spreadsheet-based microarray analysis program. An overview of DIANE can be found online at http://www.grc.nia.nih.gov/branches/rrb/dna/diane_software.pdf. Raw intensity data for each experiment was normalized by z transformation. Intensity data were first log10-transformed and used for the calculation of z scores18. Z scores were calculated by subtracting the average gene intensity from the raw intensity data for each gene and dividing that result by the S.D. of all the measured intensities. Gene expression differences between any two experiments were calculated by taking the difference between the observed gene z scores. The significance of calculated z differences can be directly inferred from measurements of the S.D. of the overall z difference distribution. Assuming a normal distribution profile, z differences are assigned significance according to their relation to the calculated S.D. of all the z differences in any one comparison. To facilitate comparison of z difference between several different experiments, z differences were divided by the appropriate S.D. to give the z ratios. Further hierarchical cluster analysis was performed using open source software Cluster 3.0 and Java Treeview.
Quantitative real time-polymerase chain reaction (qRT-PCR)
Microarray results were validated by qRT-PCR using the same RNA samples as those used for the microarray. qRT-PCR was carried out using the iScript One-Step RT-PCR Kit with SYBR Green (Bio-Rad, Hercules, CA), and the reactions were conducted on the real-time PCR detection system iCycler (Bio-Rad. Hercules, CA). The PCR was performed as follows: 45 cycles with initial incubation at 50°C for 10 min, 95°C for 5 min, and final extension at 72°C for 4 min. Each cycle consisted of denaturation for 10 sec at 95°C, annealing for 20 sec at 58°C, and extension for 50 sec at 72°C. The results were quantified as Ct values, where Ct is defined as the threshold cycle of PCR at which the amplified product is first detected and signifies relative gene expression (the ratio of target/control). qRT-PCR results were analyzed by the comparative Ct method19. The primers used in this study are indicated in Table 2.
Table 2.
List of the primers used for qRT-PCR
| Gene Symbol | Forward Primer (5′-3′) | Reverse primer (5′-3′) |
|---|---|---|
| ADRP | CATTCAAGACCAGGCCAAAC | AGGAGGTAACATTGCGGAAC |
| SULF-1 | AAACAGTGCAACCCAAGACC | TTGCCAGTTGGTGTCTGAAG |
| GPI | TGCCAAAGAGTGGTTTCTCC | CTTCACTTTGTCCGTGTTCG |
| PDPN | AAAGCCCAAGTTGAGGAACC | TCCATCGTCCAGAAAGAAGC |
| FST | TGCTGCTACTCTGCCAATTC | TGCAACACTCTTCCTTGCTC |
| HTRA1 | TTATCGCTGATGTGGTGGAG | AATGAATCCTGACCCACTCG |
| TGFβI | GCGGCTAAAGTCTCTCCAAGGT | TGACACTCACCACATTGTTTTTCA |
| GAPDH | AGACAGCCGCATCTTCTTGT | CTTGCCGTGGGTAGAGTCAT |
[3H]-thymidine uptake assay
In the [3H]-thymidine incorporation assay, rat UCMSC (2.5× 10³ cells per well) were plated in 24 well culture plates and were cultured in a CO2 incubator overnight. Mat B III cells (5×10⁴ cells per well) were added to the culture plates on the next day. Cells were cultured an additional 24 h and pulsed for the last 4 h of the culture time with 1.0 μCi [3H]-thymidine per well. Mat B III cells in suspension culture were collected into 1.5mL centrifuge tube and the free [3H]-thymidine in the medium was washed away with PBS. The [3H]-thymidine taken by Mat B III cells and rat UCMSC was solubilized by 0.2 M NaOHseparately, combined and counted by the Packard liquid scintillation counter Tri-Carb 2100TR (Perkin-Elmer Life Science, Boston, MA, USA). For proteins neutralizing experiment, neutralizing antibodies (1–4 μg per well) were added to the culture medium 2 h prior to beginning co-culture with Mat B III cells.
Live cell counting
Rat UCMSC (1.25 × 10³ cells per well) were plated in 24 well culture plates and were cultured in a CO2 incubator overnight. Neutralizing antibodies (1μg per well) were added to the culture medium 2 h prior to be/ginning co-culture with Mat B III cells (2.5 × 10⁴ cells per well). Cells were co-cultured an additional 48 h and live cells were counted after trypan blue staining (0.2% trypan blue for 5 min).
Immunoprecipitation and Western blotting
Rat UCMSC (2.5 × 10⁵ cells per dish) were seeded in 10 cm culture dishes and were cultured in a CO2 incubator overnight. Mat B III cells (4 × 10⁶ cells per dish) were added to the rat UCMSC and further incubated for 24 h. Mat B III cells alone (4 × 10⁶ cells per dish) were also separately cultured for 24 h. One mL of the culture medium was collected from each culture dish and pre-cleared with 30 μL of protein A agarose resin slurry (50%, Thermo Fisher Scientific, Rockford, IL) for 2 h at 4°C. Supernatant from each sample was separately collected into new tubes after centrifugation at 13,000 rpm for 5 min at 4°C. Three μg/mL of respective gene-specific antibody against ADRP, GPI or SULF-1 was added and incubated overnight at 4°C with gentle rocking. At the end of the incubation, 70 μL of protein A agarose resin slurry was added and incubated for an additional 3–4 h at 4°C. The agarose resin-antibody-protein complexes were washed three times with ice-cold 1× Tris buffered saline (TBS), followed by centrifugation at 6,500 rpm for 5 min. Protein-antibody complexes were dissociated from the protein A agarose resin by adding 30μl of 2× sample loading buffer and boiling for 5 min. Protein samples were separated by 8 or 12% SDS-PAGE, electroblotted onto nitrocellulose membrane (GE Healthcare Bioscience Corp) and blocked with 4% nonfat dry milk in 0.1% Tween 20 in phosphate buffered saline (PBST) for 1 h at room temperature. The membranes were washed and incubated with specific antibodies against SULF-1, ADRP, or GPI (1:200, Santa Cruz Biotechnology) with 0.1% nonfat dry milk in PBST for 1 h at room temperature and then incubated with secondary antibody (1:2000, GE Healthcare Biosciences Corp.). The protein expression signal was detected with SuperSignal West Femto Maximum Sensitivity Substrate (Pierce, Rockford, IL).
Over-expression of candidate genes
Rat UCMSC (2.5 × 10³ cells per well) were seeded in 24 well plates and were cultured in a CO2 incubator overnight. The next day, cells were transfected with human ADRP, human GPI, or human SULF-1 plasmid DNA (Open Biosystem, Huntsville, AL) using FuGENE HD Transfection Reagent (Roche Applied Science) according to manufacturer’s instructions. Since these human genes are highly homologous with rat genes (homology: ADRP, 77%; GPI, 86%; SULF1, 60%), human genes were used in this study. After transfection, cells were incubated for 48 h. Successful gene transfection was confirmed by qRT-PCR. Mat B III cells (5 × 10⁴ cells per well) were added to the transfected rat UCMSC in the 24 well plates and further incubated for 24 h. At the end of the incubation, the [3H]-thymidine uptake assay was performed to monitor cell proliferation as described above. [3H]-thymidine uptake by Mat B III cells co-cultured with GFP transfected rat UCMSC was used as negative control. As a control study, these three genes were also transfected rat uterus fibroblasts and treated identically as rat UCMSC.
Transient gene knockdown of candidate genes in rat UCMSC
Knockdown of candidate genes in rat UCMSC was carried out using small interfering RNA (siRNA). For gene knockdown, rat UCMSC (2.5 × 10³ cells per well) were seeded in a 24 well plate, cultured in a CO2 incubator. After 20 h cells were transfected with respective siRNA for SULF-1, ADRP, GPI genes or scramble RNA (Sigma-Aldrich) as a universal negative control using N-TER transfection reagent (Sigma-Aldrich) following manufacturer’s instructions. After 6 h of transfection with the siRNA, transfected rat UCSMC were co-cultured withMat B III cells (5×10⁴ cells per well). DNA synthesis was measured by [3H]-thymidine uptake assay after 24 and 48 h of co-culture. Efficiency of knock down was confirmed by qRT-PCR.
Statistical analysis
All data are reported as mean ± SE. Statistical significance was assessed by one-way ANOVA. Group comparisons were deemed significant for 2-tailed P values below 0.05.
Results
Screening of unique tumoricidal genes by microarray analysis
To screen genes associated with rat UCMSC-dependent growth attenuation of rat mammary tumor cells, genome-wide microarray analyses were carried out using an Illumina RatRef-12 Expression BeadChip, which contains 22,519 distinctive rat oligonucleotide probes. Although this microarray chip does not contain all rat genes, it encompasses the largest number of rat genes available at the time of the analysis. In this study, total RNA was extracted from the rat UCMSC either co-cultured with or without Mat B III cells in Transwell culture dishes; the two cell types were separated by a porous membrane. The quality of the extracted RNA was proven to be homogeneous and high (Supplemental Fig. 1). For unique gene screening, the following criteria were set to identify candidate genes: 1) candidate gene expression should show at least a 1.5 fold change in rat UCMSC co-cultured with Mat B III cells; 2) they encode secretory proteins; and 3) they encode cell growth regulation-related proteins. Data analysis by Z-normalization of the hybridization signals identified sixteen genes which were differentially expressed in the two culture conditions, i.e., their expression levels were at least 1.5 fold different (Fig. 1). Nine of these genes were up-regulated in rat UCMSC and seven of these genes were down-regulated when co-cultured with the Mat B III cells (Table 1). Among these genes, a total of five up-regulated genes (HTRA1, SULF-1, GPI, ADRP, and FST) and two down-regulated genes (TGFβI and PDPN) were further characterized as candidate genes associated with growth regulation of tumor cells, i.e., these genes encode secretory proteins and are associated with cell growth regulation.
Figure 1. Gene clustering of secretory protein encoding genes.

Expression levels of mRNA (z-score) of rat UCMSC alone, Mat B III cells alone, and rat UCMSC co-cultured with Mat B III cells (co-rUCMSC). Underlined genes were further characterized.
Table 1. Z-ratio of differentially expressed genes in rat UCMSC co-cultured with Mat B III cells.
Total RNA was extracted from rat UCMSC 24 h after culture with or without co-culturing with Mat B III rat mammary carcinoma cells. Co-culture was carried out in Transwell culture dishes so that the two types of cells were not mixed with each other. Microarray analysis was performed as described in the Methods to identify genes differentially expressed in rat UCMSC co-cultured with Mat B III cells relative to rat UCMSC not exposed to co-culture.
| Gene | Z-ratio |
|---|---|
| ADRP | 1.581055553 |
| HTRA1 | 1.905298131 |
| GPI | 2.077145532 |
| P4HA1 | 2.275806017 |
| COL1A2 | 2.432693795 |
| SULF1 | 2.738457286 |
| FST | 4.78920589 |
| SERPINE2 | 5.333449106 |
| PTGS2 | 6.077754681 |
| LOXL1 | −1.561672755 |
| BGN | −1.793571385 |
| LTBP4 | −1.83925686 |
| PAM | −2.334943964 |
| PDPN | −2.469104398 |
| PDIA5 | −3.113440321 |
| TGFβI | −3.790700019 |
The mRNA expression of these seven genes in rat UCMSC was verified by qRT-PCR using the total RNA extracted for microarray analysis (Fig. 2). Of the five up-regulated genes selected from microarray analysis, all five genes showed concordant results between microarray analysis and qRT-PCR. However, although PDPN and TGFβI showed significantly decreased expression in microarray analysis (Table 1), their expression was determined by qRT-PCR to be identical to the un-stimulated rat UCMSC levels. The mRNA expression of seven genes was reevaluated by qRT-PCR using separately prepared samples. Their expression patterns were similar to qRT-PCR results described above (data not shown). Accordingly, overall results suggest that the data obtained from qRT-PCR correlate well with the microarray results. Results from both analyses suggest that the sensitivity of the two methods appears to be different in each gene. However, the qRT-PCR method may be more sensitive than the microarray. It is important to note that the fold change obtained by the qRT-PCR assays was bigger than the z-ratios in the array data. This is because the z-ratios are z-differences divided by standard deviation and not fold change ratios. Out of the seven genes, five genes (HTRA1, SULF-1, ADRP, FST, and TGFβI) have been characterized as tumor suppressor genes, one gene (GPI) has been identified as a metastasis support gene, and one gene (PDPN) has been identified as a tumor promoter gene in published studies20, 21. Based on the preliminary screening of their growth attenuation ability (ADRP>SULF-1>GPI>FST>HTRA1) measured by [3H]-thymidine uptake assay in the presence of specific neutralizing antibodies, the extent of the differential expression, and individual characterization of these genes, SULF-1, GPI, and ADRP were further studied to determine their roles in the rat UCMSC-dependent tumor growth attenuation.
Figure 2. Fold changes in expression of genes differentially expressed in rat UCMSC co-cultured with Mat B III cells relative to rat UCMSC not co-cultured was measured by qRT-PCR analysis of candidate genes selected initially by microarray analysis.

Fold changes in expression was confirmed by qRT-PCR analysis.
Detection of candidate gene products in culture medium by Western blot analysis
To confirm that ADRP, GPI, and SULF-1 products are indeed secreted proteins, the presence of these proteins in the culture medium was analyzed by Western blot analysis. Individual proteins were collected from the culture medium by immunoprecipitation as described in the Methods section. All three of the gene products were detected in the culture media from rat UCMSC alone, Mat B III cells alone, and the co-culture of rat UCMSC and Mat B III cells (Fig. 3). Although protein levels were not quantitatively determined due to the technical difficulty of normalization with loading standard, rat UCMSC–dependent production of these proteins seems higher than those by Mat B III cells since only small number of rat UCMSC (1:16 = rat UCMSC: Mat B III cells) produced protein bands similar to those by Mat B III cells alone. These results support our hypothesis that these proteins are produced by rat UCMSC, secreted from the cells, and could potentially play a role in the control of tumor cell proliferation.
Figure 3. Detection of SULF-1, ADRP, and GPI in the culture medium by Western blot analysis.
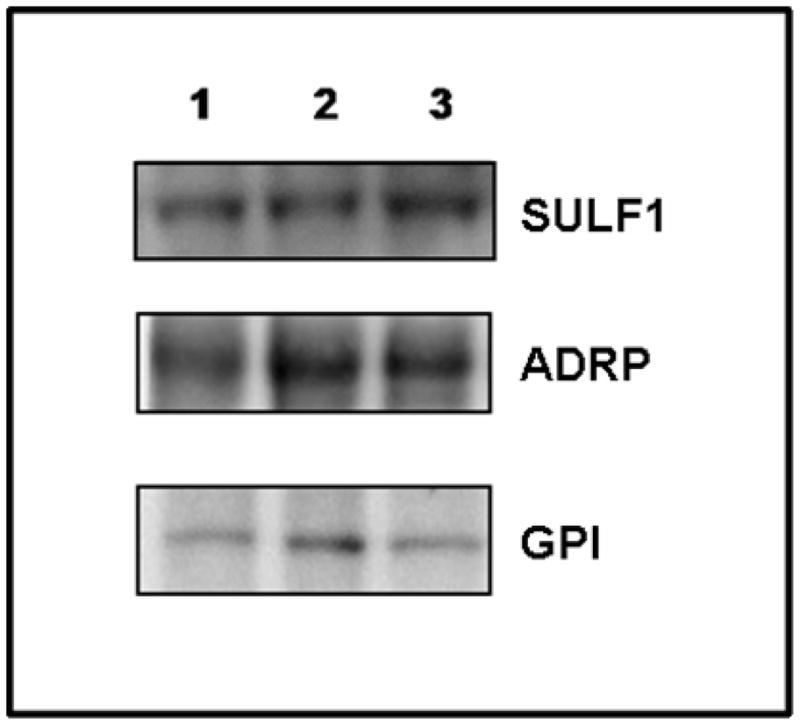
Rat UCMSC and Mat B III cells were either cultured individually or co-cultured together in defined medium. Three gene products were immunoprecipitated using specific goat polyclonal antibodies against SULF-1, ADRP, or GPI. Each immunoprecipitate was subjected to SDS-PAGE and then immunoblotted using rabbit polyclonal antibodies against SULF-1, ADRP and GPI. Lane1, immunoprecipitated protein from the medium from rat UCMSC cultured alone; Lane2, immunoprecipitated proteins from the medium from Mat B III cells cultured alone; Lane3, immunoprecipitated proteins from the medium of rat UCMSC and Mat B III cells co-cultured at a ratio of 1 to 16.
Neutralizing antibodies specific to selected candidate genes increased cell proliferation
In the initial experimental optimization study, it was found that a small number of rat UCMSC (2.5 × 10³ cells) significantly inhibited [3H]-thymidine uptake by Mat B III cells (5 × 10⁴ cells) when they were co-cultured together (rat UCMSC:Mat B III = 1:20, Fig. 4). Accordingly, the lowest rat UCMSC cell number exhibiting a growth attenuation effect (1:20 ratio) was used for all of the following direct co-culture experiments. As shown in Fig. 5, when SULF-1, GPI, and ADRP proteins were inhibited by their neutralizing antibodies, rat UCMSC-dependent inhibition of [3H]-thymidine uptake was decreased, suggesting that all three genes play a role in the Mat B III cell growth attenuation by rat UCMSC. As a control experiment, rat UCMSC were co-cultured with Mat B III cells in the presence of an anti-decorin antibody (a gene not differentially expressed in rat UCMSC co-cultured with Mat B III cells). However, the anti-decorin antibody did not alter the [3H]-thymidine uptake (Supplemental Fig. 2). As an additional control experiment, rat UCMSC were replaced with rat uterus fibroblasts. However, rat uterus fibroblasts did not show any growth attenuation of Mat B III cells (data not shown). These results were further confirmed by live cell counting. As shown in Fig. 6, total live cell numbers were significantly increased when the SULF-1, GPI, or ADRP proteins were inhibited by their neutralizing antibodies. These results clearly suggest that rat UCMSC-dependent attenuation of mammary tumor cell growth is rat UCMSC-specific, and the three selected genes play a role in rat UCMSC-dependent growth attenuation.
Figure 4. Optimization of the cell ratio of rat UCMSC to Mat B III cells for [3H]-thymidine uptake assay.

In order to evaluate the most appropriate growth inhibition of Mat B III cells by rat UCMSC, both cells were co-cultured at various ratios as indicated in the figure. [3H]-thymidine uptake was determined at 24 h after co-culturing of both cell types. Each value represents means ± SE of triplicate determinations. *, P < 0.05, compared with rat UCMSC alone or Mat B III alone.
Figure 5. The effect of neutralizing antibodies against ADRP (ADFP), SULF-1 and GPI on cell proliferation of Mat B III cells co-cultured with rat UCMSC.

[3H]-thymidine uptake was determined at 24 h after co-culturing rat UCMSC with Mat B III cells in the presence or absence of anti-ADRP (left column), -SULF-1 (middle column), and -GPI (right column) antibodies (4 μg/well). Each value represents mean ± SE of triplicate determinations. *, P value < 0.05, compared with thymidine uptake by Mat B III cells co-cultured with rat UCMSC in the absence of antibody.
Figure 6. The effect of neutralizing antibodies against ADRP (ADFP), SULF-1 and GPI on live cell count of Mat B III cells co-cultured with rat UCMSC.

Total live cell numbers were counted after 48 h of co-culture in the presence or absence of anti-ADRP, SULF-1, and GPI antibodies (1 μg/well). The experiment was performed twice with triplicate determinations. Each value represents means ± SE of samples. *, P < 0.05, compared with Mat B III cells co-cultured with rat UCMSC in the absence of antibodies and in the presence of control IgG.
Knockdown of candidate genes increased the cell proliferation
To confirm the results obtained from neutralizing antibody-based attenuation of gene function, three selected genes were knocked down by specific siRNA. Specific siRNA-dependent attenuation of mRNA expression for the three genes was approximately 80% for ADRP, 70% for GPI, and 77% for SULF-1 when 20nM siRNA was transfected. Gene knockdown for ADRP, GPI, and SULF-1 increased rat UCMSC-dependent cell proliferation approximately 67.1%, 40.5% and 49.9%, respectively (Fig.7). These results confirmed that the three selected genes play a role in rat UCMSC-dependent growth attenuation.
Figure 7. The effect of gene-specific siRNA against ADRP (ADFP), SULF-1 and GPI on cell proliferation of Mat B III cells co-cultured with rat UCMSC.

[3H]-thymidine uptake was determined at 24 h after co-culturing gene-specific siRNA transfected rat UCMSC with Mat B III cells. The experiment was performed twice with triplicate determinations. Each value represents means ± SE of samples. *, P < 0.05, compared with Mat B III cells co-cultured with rat UCMSC transfected with control scramble RNA.
Over-expression of candidate genes inhibited cell growth
To confirm that ADRP, GPI, and SULF-1 are indeed functional tumor suppressors, the effect of over-expression of these genes in rat UCMSC was analyzed using a [3H]-thymidine uptake assay. The qRT-PCR confirmed that expression of ADRP, GPI, and SULF-1 were respectively 3.0 ± 0.7, 2.0 ± 0.5, and 2.5 ± 0.4 (mean ± SE, triplicate determinations) fold higher than those of non-transfected rat UCMSC at 48 h after the transfection. While [3H]-thymidine uptake in rat UCMSC over-expressing these genes was not altered, [3H]-thymidine uptake significantly decreased to approximately 70%, 71% and 66%, respectively, in Mat B III co-cultured with rat UCMSC transfected with ADRP, GPI, or SULF-1 48 h prior to the co-culture as compared with GFP transfected cells (Fig. 8). This enhancement of rat UCMSC-dependent attenuation of the [3H]-thymidine uptake in Mat B III rat mammary carcinoma cells is attributable to the gene products of over-expressed genes. Therefore, it is suggested that these genes, which are differentially up-regulated in rat UCSMC co-cultured with Mat B III (Fig. 2), are at least partially responsible for growth attenuation of the Mat B III cells.
Figure 8. The effect of ADRP (ADFP), GPI, and SULF-1 over-expression of rat UCMSC on cell proliferation in co-cultured Mat B III cells.

ADRP (ADFP), GPI, and SULF-1 were over-expressed in rat UCMSC using the transfection reagent FuGENE HD and cultured for 48 h. Mat B III cells were co-cultured with rat UCMSC transfected with individual genes. [3H]-thymidine uptake was determined after 24 h co-culture of Mat B III cells and gene-over-expressing rat UCMSC. Each value represents mean ± SE of triplicate determinations. *, P value < 0.05, compared with [3H]-thymidine uptake by Mat B III cells co-cultured with GFP-transfected rat UCMSC.
Discussion
Increasing evidence suggests that adult stem cells can be effective therapeutic tools for various diseases including cancer 1, 2, 13, 22, 23. Indeed, multiple adult stem cells engineered to express therapeutic genes have been reported to be very effective in attenuating various cancers 3, 4, 22. A few papers have also reported that naïve adult stem cells have an intrinsic ability to attenuate growth of several types of cancer cells, such as Kaposi’s sarcoma and glioma12, 24, 25. We reported earlier that un-engineered rat UCMSC attenuate rat mammary carcinoma2, mouse pancreatic carcinoma16, and lung carcinoma26 in immunocompetent animals. A drawback of cancer cytotherapy using engineered stem cells could be unexpected gene expression of the transfected gene or, if viral vectors are used, mutation of the vector genes into a virulent form or insertion into inappropriate genomic regions. Thus, if naïve stem cells can be used for cancer cytotherapy, the safety of cytotherapy will be increased significantly. Accordingly, the aim of the present study was to determine the molecular mechanism of the intrinsic tumoricidal activity in rat UCMSC. In the present study, we identified potential genes involved in the intrinsic tumoricidal ability of rat UCMSC against rat malignant breast carcinoma cells in vitro. The study provides evidence that multiple tumor suppressor genes are involved in rat UCMSC-dependent tumoricidal activity. This evidence can be utilized for the future development of a safe cancer-targeted cytotherapy for breast carcinoma.
Microarray analysis provides the means to perform genome-wide parallel analysis of genes in a single assay, resulting in a semi-quantitative assessment of changes in mRNA expression. Although the Illumina RatRef-12 Expression BeadChip used for this study does not cover entire the entire rat genome, this chip covers over 22,500 rat genes. From our microarray analysis, we screened only 16 significant genes that are differentially expressed in rat UCMSC co-cultured with Mat B III rat mammary carcinoma cells (Fig. 1). Among these 16 genes, seven genes were further screened based on the criteria that they should produce secretory proteins and their gene products should be involved in tumor growth regulation. Differential expression of these seven genes was further confirmed by qRT-PCR using the same RNA samples (Fig. 2). A remarkable finding in this screening was that five genes (ADRP, FST, HTRA1, SULF-1 and TGFβI) are known tumor suppressor genes27–33, and the first four out of these five genes were determined to be over-expressed by both microarray and qRT-PCR. Although the GPI gene has been identified as a metastasis promoter gene21, it was shown to be significantly up-regulated in rat UCMSC when they were co-cultured with Mat B III cells. In contrast, expression of the TGFβI and PDPN genes was down-regulated in microarray analysis but slightly up-regulated in qRT-PCR. Up-regulation of multiple tumor suppressor genes in rat UCMSC is conceivable and reasonable, since we have previously found that rat UCMSC significantly attenuate tumor growth in vivo and in vitro2, 16. Therefore, screening of the intrinsic tumoricidal genes in rat UCMSC by genome wide microarray and confirming their expression by qRT-PCR analysis appears to have produced useful information.
Among the seven genes screened, although qRT-PCR analysis indicated that ADRP, GPI, and HTRA1 exhibited the highest up-regulation when rat UCMSC were co-cultured with mammary carcinoma cells, SULF-1 draws our attention since SULF-1 up-regulation attenuates breast cancer cells by decreasing heparin binding growth factor signaling30. Although the GPI gene is known to be associated with metastasis21, up-regulation in rat UCMSC was very high when they were co-cultured with Mat B III cells. Accordingly, ADRP, GPI and, SULF-1 were further characterized by their potential function. For this characterization purpose, the [3H]-thymidine uptake assay was utilized, since this assay is a sensitive evaluation of cell proliferation34, 35. The proportion of the cells in co-culture was determined by varying their ratio from 1:40-1:2 (Fig. 4). As shown in Figure 4, a 1:20 ratio of rat UCMSC:Mat B III showed the best attenuation effect. Although a lower ratio of rat UCMSC (1:2–1:4) exhibited Mat B III cell growth attenuation effect, its effect was less pronounced. This result may suggest that rat UCMSC may possess both growth attenuation and promotion effects and the growth attenuation effect is more visible in a higher ratio of two cells while the growth promotion effect is more pronounced at a lower ratio in co-culture. Accordingly, a 1:20 ratio was used for most of the following experiments.
As described in the results, individual neutralizing antibodies against the three gene products significantly increased not only [3H]-thymidine uptake (Fig. 5) but also direct cell counts (Fig. 6) by Mat B III cells co-cultured with rat UCMSC. These results were further confirmed using gene-specific siRNA-dependent knockdown of mRNA. As shown in Figure 7, individual gene-specific siRNA transfection significantly increased [3H]-thymidine uptake. These results suggest that these three gene proteins are secretory and attenuate cell proliferation of Mat B III cells. Negative control experiments confirmed that the effect of these neutralizing antibodies was specific to these three tumor suppressor proteins, since a neutralizing antibody against the tumor suppressor protein decorin (non-differentially expressed) and control IgG did not show any effect on [3H]-thymidine uptake by Mat B III cells. In addition, over-expression of these selected genes in rat UCMSC significantly enhanced their ability to attenuate growth suppression of Mat B III cells in co-culture (Fig. 8). Furthermore, co-culture with rat uterus fibroblasts did not affect Mat B III cell proliferation (data not shown). Product secretion from the three identified genes was confirmed by immunoprecipitation of the proteins in the culture medium and resultant Western blot analysis (Fig. 3). These results suggest that the tumoricidal effect of rat UCMSC is specific and at least, in part, carried out by up-regulation of multiple tumor suppressor genes. However, these gene-dependent tumor suppressor functions are only partially responsible for the tumoricidal action of rat UCMSC, since the present study identified at least 16 genes are involved in this rat UCMSC-dependent tumor growth attenuation. In addition, it is noteworthy to point out that these gene products were also produced in Mat B III tumor cells (Fig.3). Therefore, it is possible that tumor cell-dependent production of these tumor suppressor proteins also play a role in cell growth control by autocrine and paracrine manner. A surprising discovery in the present study is that GPI, which has been considered to be associated with tumor metastasis, acted as a cell growth suppressor in this experiment. Although it is unclear whether GPI acts as a tumor suppressor in vivo, this possibility might be of interest as a future study. Larmonier et al. have reported that nitric oxide plays a role in bone marrow mesenchymal stem cell-induced growth alteration of cancer cells25. However, rat UCMSC-dependent growth attenuation in vitro may not be due to nitric oxide since nitric oxide is very unstable in culture media36.
In summary, the present study demonstrates that rat UCMSC significantly attenuate growth of Mat B III rat mammary carcinoma cells in culture. Rat UCMSC-dependent tumor cell growth attenuation is associated with up-regulation of multiple tumor suppressor genes in rat UCMSC. These tumor suppressor proteins were shown to be secretory regulators of tumor cell proliferation. These results clearly suggest that naïve UCMSC are a potential cytotherapeutic tool for breast cancer therapy.
Supplementary Material
Acknowledgments
We are grateful to Mr. William H. Wood III (National Institute on Aging, NIH) for his excellent technical assistance in microarray analysis. This work was supported by Kansas State University (KSU) Terry C. Johnson Center for Basic Cancer Research, Kansas Bioscience Authority Collaborative Cancer Research Initiative grant, Kansas State Legislative Appropriation, KSU College of Veterinary Medicine Dean’s fund, NIH grants P20 RR017686, P20 RR016475, P20 RR01556 and R21 CA135599 and by the Intramural Research Program of the NIH, National Institute on Aging.
List of abbreviations
- ADRP
adipose differentiation-related protein, adipophilin, ADFP, perilipin
- BGN
biglycan
- COL1A2
collagen, type I, alpha 2
- FST
follistatin
- GAPDH
glyceraldehyde-3-phosphate dehydrogenase
- GPI
glucose phosphate isomerase
- HTRA-1
HtrA serine peptidase 1
- LOXL1
lysyl oxidase-like 1
- LTBP4
latent transforming growth factor beta binding protein 4
- Mat B III
Fisher 344 rat derived mammary adenocarcinoma cell line
- MSC
Mesenchymal stem cells
- PAM
peptidylglycine alpha-amidatingmonooxygenase
- PDIA5
protein disulfide isomerase family A, member 5
- PDPN
podoplanin
- PTGS2
prostaglandin-endoperoxide synthase 2 (prostaglandin G/H synthase and cyclooxygenase)
- P4HA1
prolyl 4-hydroxylase, alpha polypeptide 1
- qRT-PCR
Quantitative real-time polymerase chain reaction
- SERPINE2
Serpin peptidase inhibitor, clade E (nexin, plasminogen activator inhibitor type 1), member 2
- siRNA
Small interfering Ribonucleic acid
- SULF-1
sulfatase-1
- TGFβI
transforming growth factor beta-induced
- UCMSC
umbilical cord matrix stem cells
Footnotes
Authors contributions
DU and NO have equally contributed. Microarray analysis including RNA quality evaluation, hybridization, and initial data analysis was carried out by YZ and KB at National Institute on Aging, National Institute of Health (Baltimore, MD). MP and DT prepared rat UCMSC. MT organized overall research.
References
- 1.Ayuzawa R, Doi C, Rachakatla RS, Pyle MM, Maurya DK, Troyer D, Tamura M. Naive human umbilical cord matrix derived stem cells significantly attenuate growth of human breast cancer cells in vitro and in vivo. Cancer Lett. 2009;280(1):31–7. doi: 10.1016/j.canlet.2009.02.011. [DOI] [PMC free article] [PubMed] [Google Scholar]
- 2.Ganta C, Chiyo D, Ayuzawa R, Rachakatla R, Pyle M, Andrews G, Weiss M, Tamura M, Troyer D. Rat umbilical cord stem cells completely abolish rat mammary carcinomas with no evidence of metastasis or recurrence 100 days post-tumor cell inoculation. Cancer Res. 2009;69(5):1815–20. doi: 10.1158/0008-5472.CAN-08-2750. [DOI] [PubMed] [Google Scholar]
- 3.Rachakatla RS, Marini F, Weiss ML, Tamura M, Troyer D. Development of human umbilical cord matrix stem cell-based gene therapy for experimental lung tumors. Cancer Gene Ther. 2007;14(10):828–35. doi: 10.1038/sj.cgt.7701077. [DOI] [PubMed] [Google Scholar]
- 4.Matsuzuka T, Rachakatla RS, Doi C, Maurya DK, Ohta N, Kawabata A, Pyle MM, Pickel L, Reischman J, Marini F, Troyer D, Tamura M. Human umbilical cord matrix-derived stem cells expressing interferon-beta gene significantly attenuate bronchioloalveolar carcinoma xenografts in SCID mice. Lung Cancer. 2010 doi: 10.1016/j.lungcan.2010.01.003. [DOI] [PMC free article] [PubMed] [Google Scholar]
- 5.Rachakatla RS, Troyer D. Wharton’s jelly stromal cells as potential delivery vehicles for cancer therapeutics. Future Oncol. 2009;5(8):1237–44. doi: 10.2217/fon.09.99. [DOI] [PubMed] [Google Scholar]
- 6.Rachakatla RS, Balivada S, Seo GM, Myers CB, Wang H, Samarakoon TN, Dani R, Pyle M, Kroh FO, Walker B, Leaym X, Koper OB, Chikan V, Bossmann SH, Tamura M, Troyer DL. Attenuation of mouse melanoma by A/C magnetic field after delivery of bi-magnetic nanoparticles by neural progenitor cells. ACS Nano. 2010;4(12):7093–104. doi: 10.1021/nn100870z. [DOI] [PMC free article] [PubMed] [Google Scholar]
- 7.Frank RT, Edmiston M, Kendall SE, Najbauer J, Cheung CW, Kassa T, Metz MZ, Kim SU, Glackin CA, Wu AM, Yazaki PJ, Aboody KS. Neural stem cells as a novel platform for tumor-specific delivery of therapeutic antibodies. PLoS One. 2009;4(12):e8314. doi: 10.1371/journal.pone.0008314. [DOI] [PMC free article] [PubMed] [Google Scholar]
- 8.Ling X, Marini F, Konopleva M, Schober W, Shi Y, Burks J, Clise-Dwyer K, Wang RY, Zhang W, Yuan X, Lu H, Caldwell L, Andreeff M. Mesenchymal Stem Cells Overexpressing IFN-beta Inhibit Breast Cancer Growth and Metastases through Stat3 Signaling in a Syngeneic Tumor Model. Cancer Microenviron. 2010;3(1):83–95. doi: 10.1007/s12307-010-0041-8. [DOI] [PMC free article] [PubMed] [Google Scholar]
- 9.Dwyer RM, Kerin MJ. Mesenchymal stem cells and cancer: tumor-specific delivery vehicles or therapeutic targets? Hum Gene Ther. 2010;21(11):1506–12. doi: 10.1089/hum.2010.135. [DOI] [PubMed] [Google Scholar]
- 10.Josiah DT, Zhu D, Dreher F, Olson J, McFadden G, Caldas H. Adipose-derived stem cells as therapeutic delivery vehicles of an oncolytic virus for glioblastoma. Mol Ther. 2010;18(2):377–85. doi: 10.1038/mt.2009.265. [DOI] [PMC free article] [PubMed] [Google Scholar]
- 11.Mitchell KE, Weiss ML, Mitchell BM, Martin P, Davis D, Morales L, Helwig B, Beerenstrauch M, Abou-Easa K, Hildreth T, Troyer D, Medicetty S. Matrix cells from Wharton’s jelly form neurons and glia. Stem Cells. 2003;21(1):50–60. doi: 10.1634/stemcells.21-1-50. [DOI] [PubMed] [Google Scholar]
- 12.Khakoo AY, Pati S, Anderson SA, Reid W, Elshal MF, Rovira, Nguyen AT, Malide D, Combs CA, Hall G, Zhang J, Raffeld M, Rogers TB, Stetler-Stevenson W, Frank JA, Reitz M, Finkel T. Human mesenchymal stem cells exert potent antitumorigenic effects in a model of Kaposi’s sarcoma. J Exp Med. 2006;203(5):1235–47. doi: 10.1084/jem.20051921. [DOI] [PMC free article] [PubMed] [Google Scholar]
- 13.Hall B, Dembinski J, Sasser AK, Studeny M, Andreeff M, Marini F. Mesenchymal stem cells in cancer: tumor-associated fibroblasts and cell-based delivery vehicles. Int J Hematol. 2007;86(1):8–16. doi: 10.1532/IJH97.06230. [DOI] [PubMed] [Google Scholar]
- 14.Rhodes LV, Antoon JW, Muir SE, Elliott S, Beckman BS, Burow ME. Effects of human mesenchymal stem cells on ER-positive human breast carcinoma cells mediated through ER-SDF-1/CXCR4 crosstalk. Mol Cancer. 2010;9:295. doi: 10.1186/1476-4598-9-295. [DOI] [PMC free article] [PubMed] [Google Scholar]
- 15.Klopp AH, Gupta A, Spaeth E, Andreeff M, Marini F. Concise Review: Dissecting a Discrepancy in the Literature: Do Mesenchymal Stem Cells Support or Suppress Tumor Growth? Stem Cells. 2011;29(1):11–19. doi: 10.1002/stem.559. [DOI] [PMC free article] [PubMed] [Google Scholar]
- 16.Doi C, Maurya DK, Pyle MM, Troyer D, Tamura M. Cytotherapy with naive rat umbilical cord matrix stem cells significantly attenuates growth of murine pancreatic cancer cells and increases survival in syngeneic mice. Cytotherapy. 2010;12(3):408–17. doi: 10.3109/14653240903548194. [DOI] [PMC free article] [PubMed] [Google Scholar]
- 17.Prowse KR, Greider CW. Developmental and tissue-specific regulation of mouse telomerase and telomere length. Proc Natl Acad Sci U S A. 1995;92(11):4818–22. doi: 10.1073/pnas.92.11.4818. [DOI] [PMC free article] [PubMed] [Google Scholar]
- 18.Cheadle C, Cho-Chung YS, Becker KG, Vawter MP. Application of z-score transformation to Affymetrix data. Appl Bioinformatics. 2003;2(4):209–17. [PubMed] [Google Scholar]
- 19.Schmittgen TD, Livak KJ. Analyzing real-time PCR data by the comparative C(T) method. Nat Protoc. 2008;3(6):1101–8. doi: 10.1038/nprot.2008.73. [DOI] [PubMed] [Google Scholar]
- 20.Hoshino A, Ishii G, Ito T, Aoyagi K, Ohtaki Y, Nagai K, Sasaki H, Ochiai A. Podoplanin-positive fibroblasts enhance lung adenocarcinoma tumor formation: podoplanin in fibroblast functions for tumor progression. Cancer Res. 2011;71(14):4769–79. doi: 10.1158/0008-5472.CAN-10-3228. [DOI] [PubMed] [Google Scholar]
- 21.Funasaka T, Hogan V, Raz A. Phosphoglucose isomerase/autocrine motility factor mediates epithelial and mesenchymal phenotype conversions in breast cancer. Cancer Res. 2009;69(13):5349–56. doi: 10.1158/0008-5472.CAN-09-0488. [DOI] [PMC free article] [PubMed] [Google Scholar]
- 22.Aboody KS, Brown A, Rainov NG, Bower KA, Liu S, Yang W, Small JE, Herrlinger U, Ourednik V, Black PM, Breakefield XO, Snyder EY. Neural stem cells display extensive tropism for pathology in adult brain: evidence from intracranial gliomas. Proc Natl Acad Sci U S A. 2000;97(23):12846–51. doi: 10.1073/pnas.97.23.12846. [DOI] [PMC free article] [PubMed] [Google Scholar]
- 23.Studeny M, Marini FC, Champlin RE, Zompetta C, Fidler IJ, Andreeff M. Bone marrow-derived mesenchymal stem cells as vehicles for interferon-beta delivery into tumors. Cancer Res. 2002;62(13):3603–8. [PubMed] [Google Scholar]
- 24.Kang SG, Jeun SS, Lim JY, Kim SM, Yang YS, Oh WI, Huh PW, Park CK. Cytotoxicity of human umbilical cord blood-derived mesenchymal stem cells against human malignant glioma cells. Childs Nerv Syst. 2008;24(3):293–302. doi: 10.1007/s00381-007-0515-2. [DOI] [PubMed] [Google Scholar]
- 25.Larmonier N, Ghiringhelli F, Larmonier CB, Moutet M, Fromentin A, Baulot E, Solary E, Bonnotte B, Martin F. Freshly isolated bone marrow cells induce death of various carcinoma cell lines. Int J Cancer. 2003;107(5):747–56. doi: 10.1002/ijc.11463. [DOI] [PubMed] [Google Scholar]
- 26.Maurya DK, Doi C, Kawabata A, Pyle MM, King C, Wu Z, Troyer D, Tamura M. Therapy with un-engineered naive rat umbilical cord matrix stem cells markedly inhibits growth of murine lung adenocarcinoma. BMC Cancer. 2010;10:590. doi: 10.1186/1471-2407-10-590. [DOI] [PMC free article] [PubMed] [Google Scholar]
- 27.Yao M, Tabuchi H, Nagashima Y, Baba M, Nakaigawa N, Ishiguro H, Hamada K, Inayama Y, Kishida T, Hattori K, Yamada-Okabe H, Kubota Y. Gene expression analysis of renal carcinoma: adipose differentiation-related protein as a potential diagnostic and prognostic biomarker for clear-cell renal carcinoma. J Pathol. 2005;205(3):377–87. doi: 10.1002/path.1693. [DOI] [PubMed] [Google Scholar]
- 28.Yao M, Huang Y, Shioi K, Hattori K, Murakami T, Nakaigawa N, Kishida T, Nagashima Y, Kubota Y. Expression of adipose differentiation-related protein: a predictor of cancer-specific survival in clear cell renal carcinoma. Clin Cancer Res. 2007;13(1):152–60. doi: 10.1158/1078-0432.CCR-06-1877. [DOI] [PubMed] [Google Scholar]
- 29.Lai JP, Yu C, Moser CD, Aderca I, Han T, Garvey TD, Murphy LM, Garrity-Park MM, Shridhar V, Adjei AA, Roberts LR. SULF1 inhibits tumor growth and potentiates the effects of histone deacetylase inhibitors in hepatocellular carcinoma. Gastroenterology. 2006;130(7):2130–44. doi: 10.1053/j.gastro.2006.02.056. [DOI] [PubMed] [Google Scholar]
- 30.Narita K, Staub J, Chien J, Meyer K, Bauer M, Friedl A, Ramakrishnan S, Shridhar V. HSulf-1 inhibits angiogenesis and tumorigenesis in vivo. Cancer Res. 2006;66(12):6025–32. doi: 10.1158/0008-5472.CAN-05-3582. [DOI] [PubMed] [Google Scholar]
- 31.Talmadge JE. Follistatin as an inhibitor of experimental metastasis. Clin Cancer Res. 2008;14(3):624–6. doi: 10.1158/1078-0432.CCR-07-2216. [DOI] [PubMed] [Google Scholar]
- 32.Irigoyen M, Pajares MJ, Agorreta J, Ponz-Sarvise M, Salvo E, Lozano MD, Pio R, Gil-Bazo I, Rouzaut A. TGFBI expression is associated with a better response to chemotherapy in NSCLC. Mol Cancer. 2010;9:130. doi: 10.1186/1476-4598-9-130. [DOI] [PMC free article] [PubMed] [Google Scholar]
- 33.Zurawa-Janicka D, Skorko-Glonek J, Lipinska B. HtrA proteins as targets in therapy of cancer and other diseases. Expert Opin Ther Targets. 2010;14(7):665–79. doi: 10.1517/14728222.2010.487867. [DOI] [PubMed] [Google Scholar]
- 34.Pusztai L, Lewis CE, McGee JO. Growth arrest of the breast cancer cell line, T47D, by TNF alpha; cell cycle specificity and signal transduction. Br J Cancer. 1993;67(2):290–6. doi: 10.1038/bjc.1993.55. [DOI] [PMC free article] [PubMed] [Google Scholar]
- 35.Rulten SL, Hodder E, Ripley TL, Stephens DN, Mayne LV. Alcohol induces DNA damage and the Fanconi anemia D2 protein implicating FANCD2 in the DNA damage response pathways in brain. Alcohol Clin Exp Res. 2008;32(7):1186–96. doi: 10.1111/j.1530-0277.2008.00673.x. [DOI] [PubMed] [Google Scholar]
- 36.Southan GJ, Szabo C. Selective pharmacological inhibition of distinct nitric oxide synthase isoforms. Biochem Pharmacol. 1996;51(4):383–94. doi: 10.1016/0006-2952(95)02099-3. [DOI] [PubMed] [Google Scholar]
Associated Data
This section collects any data citations, data availability statements, or supplementary materials included in this article.