Abstract
Objective
Acoustic analysis of voice is typically conducted on recordings of sustained vowel phonation. This study applied perturbation and nonlinear dynamic analyses to the vowels /a/, /i/, and /u/ in order to determine vowel selection effects on analysis. Patients and Methods: Forty subjects (20 males and 20 females) with normal voices participated in recording. Traditional parameters of fundamental frequency, signal-to-noise ratio, percent jitter, and percent shimmer were calculated for the signals using CSpeech. Nonlinear dynamic parameters of correlation dimension and second-order entropy were also calculated.
Results
Perturbation analysis results were largely incongruous in this study and in previous research. Fundamental frequency results corroborated previous work, indicating higher fundamental frequency for /i/ and /u/ and lower fundamental frequency for /a/. Signal-to-noise ratio results showed that /i/ and /u/ have greater harmonic levels than /a/. Results of nonlinear dynamic analysis suggested that more complex activity may be evident in /a/ than in /i/ or /u/.
Conclusion
Percent jitter and percent shimmer may not be useful for description of acoustic differences between vowels. Fundamental frequency, signal-to-noise ratio, and nonlinear dynamic parameters may be applied to characterize /a/ as having lower frequency, higher noise, and greater nonlinear components than /i/ and /u/.
Key Words: Acoustic analysis, Vowel selection, Perturbation analysis, Nonlinear dynamic analysis
Introduction
Acoustic measures of voice, including perturbation and nonlinear dynamic analyses, are usually calculated from sustained vowel recordings to avoid the effects of speech intonation and interactions between the larynx and vocal tract on signal assessment. These measures are usually applied to /a/, /i/, and /u/ sustained vowels, which are referred to as the corner or point vowels in phonetics literature and are nearly ubiquitous throughout world languages. These monikers reflect the articulatory definitions of the vowels, which form a triangle in two-dimensional space. /i/ is produced with the tongue positioned forward and high in the mouth, while /u/ is produced with the tongue back and high in the mouth and /a/ is produced with the tongue back and low in the mouth. All other vowel sounds are produced within the extreme articulatory dimensions of the corner vowels. Tongue height and other articulatory adjustments made for different sustained vowels may alter laryngeal cartilage position, glottal area, and vocal tract and vocal fold tension [1,2].
Fant's [3] source-filter theory describes the mechanism of speech production. The source in this model is the glottal airflow as modified by the vibrating vocal folds during voiced sound production. Vocal fold movement produces a complex harmonic signal, basic properties of which are periodicity, expressed by fundamental frequency (F0), and signal-to-noise ratio (SNR). In the human voice, nonlinear qualities are produced by air pressure and flow in the glottis, stress-strain curves of vocal fold tissue, and forces of vocal fold collision [4]; these nonlinear properties are introduced at the level of the source and are quantifiable using nonlinear dynamic analysis techniques. The filter is the vocal tract, which linearly alters the source wave during its transmission to the environment. During production of different vowel sounds, the configuration of the filter varies, and it has been determined that size and location of vocal tract constriction affect qualities of signal frequency and stability, as measured by perturbation analysis [5,6].
The effects of vowel selection on F0 have been established. The tongue, hyoid bone, and larynx are connected by muscles and ligaments; when the tongue is raised by genioglossus muscle contraction, the hyoid bone moves anteriorly and tension on the larynx and vocal folds increases, increasing F0, and vice versa [2]. Therefore, a high tongue position, such as that for /i/ or /u/, results in a higher F0, while a low tongue position, such as that for /a/, lowers F0[2]. Though it is difficult to differentiate the F0 of /i/ from /u/, the F0 values of these high vowels have consistently been found to be significantly higher than that of the low vowel /a/ [1,7,8].
The effects of vowels on jitter and shimmer measures are less clear. Orlikoff [9] found that most acoustic studies applying multiple vowels in analysis reported lower perturbation for high vowels and higher perturbation for low vowels, with many conflicting results. While a few studies have found shimmer values to be lowest for /u/, intermediate for /i/, and highest for /a/ [7,10,11], a recent study found shimmer to be lowest for /i/, intermediate for /a/, and highest for /u/ [12]. Jitter results are more difficult to interpret. Some researchers have found jitter to be the lowest for /a/, intermediate for /u/, and highest for /i/ [7,10,11], but other studies have found conflicting results [12,13,14], including the opposite finding of highest jitter for /a/ and lowest jitter for /i/ [8]. From these ambiguous results, it is evident that vowel effects on perturbation analysis are inconclusive, especially for jitter.
Chaos is the pseudorandom behavior exhibited by a nonlinear deterministic system. Because no human voice demonstrates perfect periodicity, human vocal folds may exhibit some inherent chaotic properties. Giovanni et al. [15] applied Lyapunov exponents to normal and pathological voices and found that the nonlinear dynamic parameter provided nonredundant information complementary to other acoustic analyses. Therefore, nonlinear dynamics is a useful method of measuring vocal aperiodicity. Some previous analysis of vowel effects on nonlinear dynamic parameters has been conducted. Tokuda et al. [16] found through surrogate data analysis that a nonlinear dynamic correlation may exist between waveform-pitch patterns of Japanese vowels. Koga and Nakagawa [17] analyzed vowels through calculation of the largest Lyapunov exponents from a time series and the surrogation method, finding that the largest Lyapunov exponent was highest for /a/, intermediate for /i/, and lowest for /u/ [17]. A study of the four Chinese tones applied the correlation dimension to investigate differences between tones in vowels [18]. However, the effects of vowel selection on nonlinear dynamics measures for clinical voice data have not been fully addressed in the literature.
The purpose of this study was to examine the effects of the vowels /a/, /i/, and /u/ on acoustic analysis measures. Sustained vowels as spoken by normal subjects were analyzed via perturbation and nonlinear dynamic measures. SNR and F0 were applied to quantify basic acoustic properties of the vowel sources. Perturbation measures of percent jitter and percent shimmer were also applied to characterize the filtered vowel signals. Nonlinear dynamic measures of correlation dimension and second-order entropy were used to quantify the nonlinear properties of the vowel signal sources. This study examined the changes in acoustic analysis measures resultant to vowel selection, especially for nonlinear dynamic analysis and SNR, acoustic measures not previously applied for acoustic vowel discrimination.
Methods
Subjects
The Institutional Review Board at the University of Wisconsin School of Medicine and Public Health approved the protocol and consent procedure used in this study. Forty native English speakers (20 men and 20 women) participated in recording. All subjects were in good health at the time of recording and declared no history of vocal fold pathologies or voice problems.
Recording Procedure
Sustained vowel audio recordings were made at a sampling rate of 44.1 kHz in a sound-attenuated room with the recording microphone (AKG Acoustics, Vienna, Austria) positioned 10 cm from the mouth. During the recording session, subjects were instructed to sustain phonations of /a/ (as in the word ‘bother’), /i/ (as in the word ‘beet’), and /u/ (as in the word ‘boot’) vowel sounds at a comfortable pitch and volume for at least 5 s. Two trials of /a/, /i/, and /u/ phonation were recorded for each subject. A middle stationary segment, x(ti), ti = iΔt, Δt = 1/fs, i = 1, 2,…, with a length of 1 s was selected for analysis from each sustained vowel. The 1-second segments excluded voice onset and offset to avoid effects of speech intonation and interactions of the larynx and vocal tract on analysis.
Perturbation Analysis
Perturbation, the cycle-to-cycle variation present in a waveform, is commonly analyzed for an acoustic signal using the parameters of jitter and shimmer. Jitter measures the cycle-to-cycle frequency variation of a signal, while shimmer measures the cycle-to-cycle amplitude variation [19]. Perturbation parameters of percent jitter and percent shimmer were calculated for the segments with CSpeech software, version 4.0 (Madison, Wisc., USA) [20,21]. F0, which quantifies vocal fold vibratory frequency, and SNR, which is measured in decibels and reflects the dominance of the harmonic signal over noise, were also calculated with CSpeech.
Nonlinear Dynamic Analysis
Phonation is a nonlinear process involving biomechanical and aerodynamic factors. Nonlinear dynamics measures, such as correlation dimension (D2) and second-order entropy (K2), have complemented perturbation measurement due to an ability to accurately describe both periodic and aperiodic signals [22]. Correlation dimension is a geometric measure describing the strength of correlation between two points in phase space. D2 quantifies the number of degrees of freedom that may be necessary to describe a dynamic system; a complex system has a high dimension and may require greater degrees of freedom to describe its state [23]. Second-order entropy is the lower bound of the Kolmogorov entropy, which quantifies the rate of information loss for a dynamic system over time. A perfectly periodic system has a Kolmogorov entropy of zero, while a complex system with finite degrees of freedom has a finite and positive Kolmogorov entropy value [24].
Correlation dimension and second-order entropy values of selected segments were calculated based on our numerical algorithms that were applied previously to analyze excised larynx phonations [25] and pathological human voices [26,27,28]. In brief, the time delay technique was used to reconstruct an m-dimensional delay-coordinate phase space Xi = {x(ti), x(ti) – τ},…, x(ti – (m – 1)τ)} [29], where m is the embedding dimension and τ is the time delay. m was determined according to the embedding theorem [30]. When m > 2D + 1, where D is the Hausdorff dimension, the reconstructed phase space is topologically equivalent to the original phase space. The mutual information procedure proposed by Fraser and Swinney [31] was used to estimate the proper time delay τ. The correlation integral C(r) was calculated using the improved algorithm proposed by Theiler [32], where r is the radius around Xi. C(r) measures the number of distances between points in the reconstructed phase space that are smaller than the radius r. C(r) has a power law behavior C(r) ∝ rD2e–mτK2, which reveals the geometrical scaling property of the attractor [24]. For sufficiently large m, D2 and K2 were derived in the scaling region [23]. In order to ensure the reliable calculation of D2 and K2, the standard deviation of the estimated values should be less than 5%.
Statistical Analysis
Given the previously established sexual dichotomy in morphological, physiological, and acoustic measures of voice [33], data were analyzed separately by sex. Significance was set at the p = 0.05 confidence level for all tests. Because it could not be predefined whether the groups were from normally distributed populations, we applied the Friedman repeated measures one-way analysis of variance (ANOVA) on ranks. The statistical significance level was set at p = 0.05. In order to determine how any two groups were statistically different, a post hoc Tukey test, used for multiple pairwise comparisons of groups with equal sample size, was performed. SigmaStat 3.0 and SigmaPlot 8.0 software (SPSS Inc., Chicago, Ill., USA) were used to statistically analyze and graph data.
Results
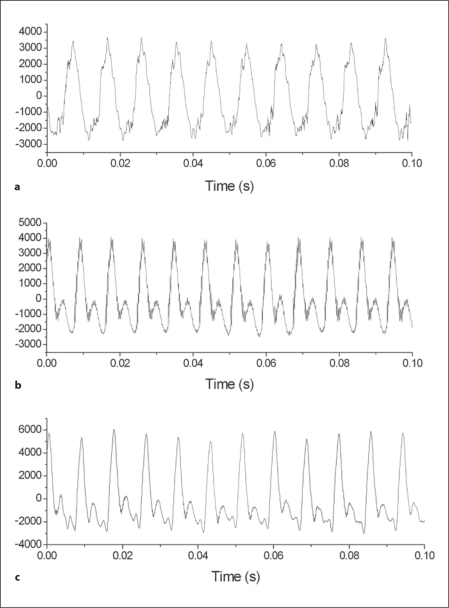
Typical waveforms of /a/, /i/, and /u/ vowels from a male subject are given in figure 1. For a typical male subject, percent jitter was highest for /a/ (0.56), intermediate for /u/ (0.46) and lowest for /i/ (0.27), while percent shimmer was highest for /u/ (3.87), intermediate for /a/ (2.87), and lowest for /i/ (1.43). SNR was highest for /i/ (23 dB), intermediate for /u/ (19.1 dB), and lowest for /a/ (17.4 dB). The male voice demonstrated its highest F0 for /u/ (117.1 Hz), intermediate F0 for /i/ (116.8 Hz), and lowest F0 for /a/ (106.4 Hz). For nonlinear dynamic parameters of both D2 and K2, values were highest for /a/ (1.685 and 0.174, respectively), intermediate for /i/ (1.567 and 0.145, respectively), and lowest for /u/ (1.488 and 0.102, respectively).
Fig. 1.
The waveforms of /a/ (a), /i/ (b), and /u/ (c) for a typical male voice.
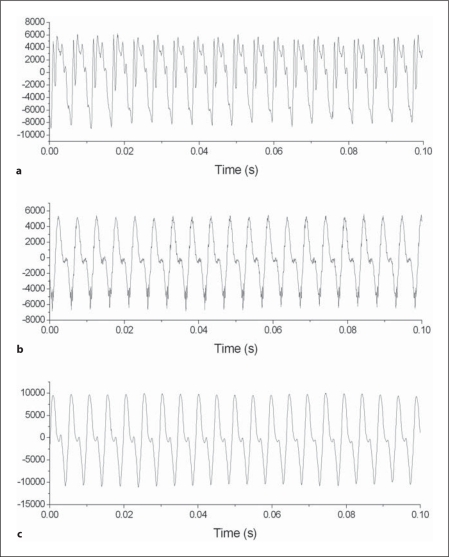
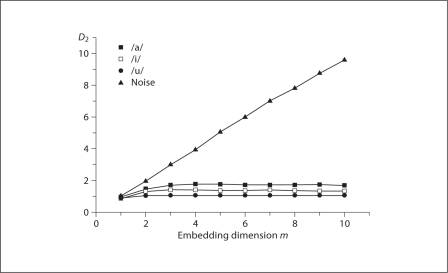
Typical waveforms of /a/, /i/, and /u/ vowels from a female subject are given in figure 2. For a typical female subject, percent jitter was highest for /u/ (1.08), intermediate for /i/ (0.48), and lowest for /a/ (0.43). Percent shimmer was highest for /u/ (1.75), intermediate for /a/ (1.54), and lowest for /i/ (1.44). The female voice demonstrated its highest SNR for /i/ (26.1 dB), intermediate SNR for /u/ (25.8 dB), and lowest SNR for /a/ (24.5 dB), while F0 was highest for /u/ (203.8 Hz), intermediate for /i/ (195.6 Hz), and lowest for /a/ (186.5 Hz). D2 was highest for /i/ (1.76), intermediate for /a/ (1.67), and lowest for /u/ (1.46), and K2 was highest for /a/ (0.177), intermediate for /i/ (0.146), and lowest for /u/ (0.13) (fig. 3).
Fig. 2.
The waveforms of /a/ (a), /i/ (b), and /u/ (c) for a typical female voice.
Fig. 3.
The estimated D2 versus the embedding dimension m for /a/, /i/, /u/ from a typical female voice, and for random noise.
To confirm these findings, comparisons among all acoustic analysis results for /a/, /i/, and /u/ from males and females were made. Table 1 summarizes the results of acoustic analysis for males and females. The Friedman ANOVA on ranks indicated that significant differences between the vowel cohorts were evident for most measured perturbation and nonlinear dynamic parameters. Therefore, the Tukey test was applied to determine pairwise statistical differences. Statistical analysis results are given in table 2.
Table 1.
Results of acoustic analysis (mean± standard deviation) for /a/, /i/, and /u/ sustained vowel phonation from males and females
| Male |
Female |
|||||
|---|---|---|---|---|---|---|
| /a/ | /i/ | /u/ | /a/ | /i/ | /u/ | |
| % jitter | 0.537±0.458 | 0.348±0.254 | 0.401±0.307 | 0.355±0.140 | 0.413±0.436 | 0.740±0.668 |
| % shimmer | 2.656±1.375 | 1.491±0.859 | 2.939±2.245 | 1.638±0.522 | 1.314±1.045 | 3.520±3.723 |
| SNR, dB | 20.490±4.404 | 26.138±3.660 | 24.293±5.477 | 23.893±2.875 | 26.682±3.554 | 25.035±6.265 |
| F0, Hz | 112.980±18.361 | 117.160±21.979 | 117.925±66.713 | 207.505±19.151 | 211.465±32.381 | 213.483±29.928 |
| D2 | 1.881±0.360 | 1.622±0.235 | 1.592±0.255 | 1.624±0.151 | 1.652±0.265 | 1.607±0.154 |
| K2 | 0.180±0.007 | 0.154±0.050 | 0.135±0.034 | 0.172±0.054 | 0.151±0.005 | 0.141±0.049 |
Percent jitter, percent shimmer, SNR, F0, D2 and K2 measures were collected for each signal.
Table 2.
Results of post hoc Tukey tests to evaluate acoustic analysis results of the /a/, /i/, and /u/ vowel cohorts from males and females
| Male |
Female |
|||||
|---|---|---|---|---|---|---|
| /a/vs. /i/ | /a/vs. /u/ | /i/vs. /u/ | /a/vs. /i/ | /a/vs. /u/ | /i/vs. /u/ | |
| % jitter | 4.743∗ | 2.372 | 2.372 | 1.818 | 3.241 | 5.060∗ |
| % shimmer | 6.641∗ | 1.897 | 4.743∗ | 5.692∗ | 1.897 | 7.589∗ |
| SNR, dB | 7.036∗ | 5.297∗ | 1.739 | 5.376∗ | 2.688 | 2.688 |
| F0, Hz | 3.399∗ | 6.799∗ | 3.399∗ | 4.506∗ | 5.692∗ | 1.186 |
| D2 | 4.743∗ | 4.981∗ | 0.237 | N/A | N/A | N/A |
| K2 | 3.320∗ | 6.641∗ | 3.320∗ | 3.399∗ | 3.953∗ | 0.533 |
Cohorts were compared on measures of percent jitter, percent shimmer, SNR, F0, D2, and K2.
An asterisk denotes statistical significance at the p = 0.05 level. N/A indicates that the Friedman test found no significant difference between cohorts; as a result, no post hoc test was performed.
Male Subjects
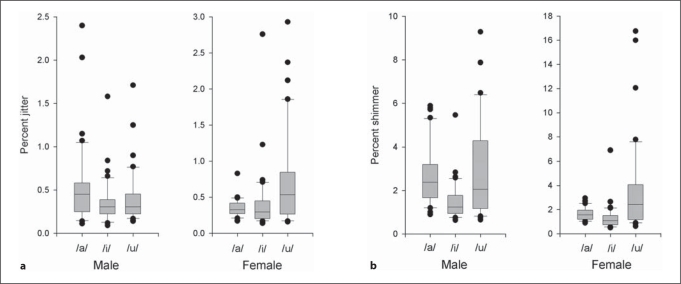
In male subjects, vowel effects produced different results for perturbation measures of percent jitter and percent shimmer. Percent jitter values were highest for /a/, intermediate for /u/, and lowest for /i/, as shown in figure 4a, and the /a/ cohort's percent jitter was significantly higher than that of the /i/ cohort (p < 0.05). Percent shimmer values were highest for /u/, intermediate for /a/, and lowest for /i/, as shown in figure 4b. The /u/ and /a/ cohorts had significantly larger percent shimmer than the /i/ cohort (p < 0.05).
Fig. 4.
Comparisons of distribution of percent jitter (a) and percent shimmer (b) for the /a/, /i/, and /u/ signal cohorts from males and females. The line inside the box marks the median, whiskers show 10th and 90th percentiles, and the dots are the outlying points.
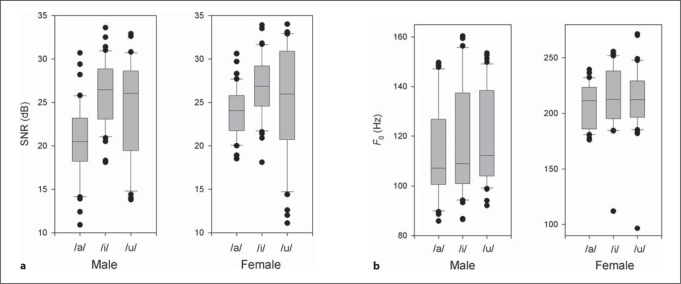
Results of vowel selection on the traditional parameters of SNR and F0 were similar. SNR values were highest for /i/, intermediate for /u/, and lowest for /a/, as shown in figure 5a. F0 values were highest for /u/, intermediate for /i/, and lowest for /a/, as shown in figure 5b. All pairwise comparisons showed significant differences for these two measures (p < 0.05).
Fig. 5.
Comparisons of distribution of SNR (a) and F0 (b) for the /a/, /i/, and /u/ signal cohorts from males and females. The line inside the box marks the median, whiskers show 10th and 90th percentiles, and the dots are the outlying points.
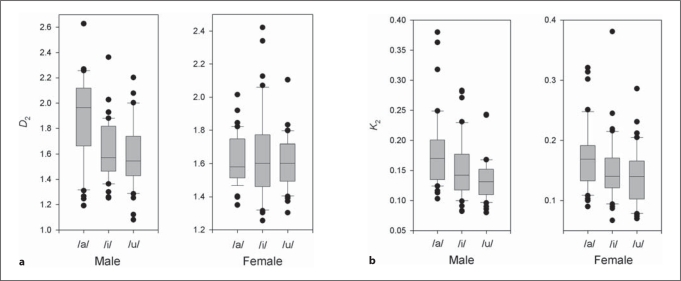
Nonlinear dynamic analysis results showed that parameters were affected similarly by vowel selection. For D2 and K2 measures, /a/ produced the highest values, with /i/ intermediate and /u/ lowest, as shown in figure 6a, b, respectively. D2 measures of /a/ were significantly higher than both /i/ and /u/ (p < 0.05), and all pairwise comparisons of vowel cohorts were significantly different for K2 measures (p < 0.05).
Fig. 6.
Comparisons of distribution of D2 (a) and K2 (b) for the /a/, /i/, and /u/ signal cohorts from males and females. The line inside the box marks the median, whiskers show 10th and 90th percentiles, and the dots are the outlying points.
Female Subjects
As in male subjects, female subjects’ vowel selection produced different results for perturbation measures of percent jitter and percent shimmer. Percent jitter values were highest for /u/, intermediate for /i/, and lowest for /a/, as shown in figure 4a. The /u/ cohort had significantly higher percent jitter than the /a/ cohort (p < 0.05). In percent shimmer, /u/ values were highest, /a/ values were intermediate, and /i/ values were lowest, as shown in figure 4b. Percent shimmer values of the /i/ cohort were significantly lower than those of the /u/ and /a/ cohorts (p < 0.05).
Traditional parameters of F0 and SNR showed similar vowel effects in females. SNR was highest for /i/, intermediate for /u/, and lowest for /a/, as shown in figure 5a, and SNR of the /i/ cohort was significantly higher than SNR of the other two cohorts (p < 0.05). For F0, /u/ values were highest, /i/ values were intermediate, and /a/ values were lowest, as shown in figure 5b. In this case, /a/ values were significantly lower than those of the high vowel cohorts (p < 0.05).
Differing from nonlinear dynamic analysis results from male subjects, the Friedman test found no significant difference between vowel cohorts for D2 from females. However, D2 values were highest for /i/, intermediate for /a/, and lowest for /u/, as shown in figure 6a. Vowel selection in female voice had a significant effect on K2 values. K2 values were highest for /a/, intermediate for /i/, and lowest for /u/, as shown in figure 6b, and the /a/ cohort values were significantly higher than those of the high vowels (p < 0.05).
Discussion
Previously established effects of vowel selection on F0 [1,2,7,8] were supported by the results of this study. For both males and females, F0 measures of the high vowels /u/ and /i/ were found to be significantly higher than F0 of the low vowel /a/ (fig. 5b). /u/ F0 was significantly larger than /i/ F0 for males, but for females, F0 measures of the low vowels were not significantly differentiable. This inability to statistically distinguish F0 values of /i/ and /u/ had been noted in previous studies [1,7,8]. Vowel selection effects on SNR values were comparable to those on F0 measurement. Again, /a/ produced lower values than the high vowels /i/ and /u/ (fig. 5a). Together, results of F0 and SNR analysis indicate that production of low vowels, such as /a/, may be performed at a lower vocal fold vibratory rate, introducing greater noise levels to the signal than high vowel production. This is known as the intrinsic pitch of vowels and is often attributed to mechanical coupling resulting in anterior positioning of the hyoid bone and forward tilting of the thyroid cartilage, creating an anterior pull on the vocal folds and increasing fold tension for high vowels such as /i/ and /u/ [1,2,33].
In this study, perturbation parameters proved unpredictable resultant to vowel effects. Male percent jitter results, which indicate that the low vowel /a/ had greater frequency perturbation than /u/ and /i/, echoed the results of previous work (fig. 4a) [8,13]. Conversely, female percent jitter results showed /a/ to have lower levels of frequency perturbation than the high vowels; this, too, corroborated a previous finding (fig. 4a) [11]. Male and female percent shimmer results of this study were the same and corroborated the work of Kiliç et al. [12] (fig. 4b). Percent shimmer calculation indicated that the low vowel /a/ had intermediate values; this result did not distinguish high from low vowels, as was the case with other measured acoustic parameters. On the whole, the results of this study and previous work they corroborate stand against a variety of results for perturbation analysis of vowels. In recent years, it has been suggested that the algorithms employed to calculate perturbation parameters may only be useful for nearly periodic voice signals and may not reliably analyze strongly aperiodic signals [34,35]. Further, jitter and shimmer have been found to be affected by a number of recording and analysis conditions, including microphone type and placement [36], analysis systems [37,38], and environmental noise [39,40]. Given variable past performance in the literature and sensitivity to signal, recording, and analysis system types, it seems that percent jitter and percent shimmer may not be capable of acoustic discrimination of vowels.
Several studies have investigated the effects of filter configuration and properties on perturbation measures. Horii [41] used a contact microphone to eliminate acoustic effects of the vocal tract and found no significant differences in jitter or shimmer among eight vowels. Orlikoff [9] held F0 and sound pressure level at a constant level during vowel production and found that jitter and shimmer did not vary significantly among vowels in electroglottographic recordings. Lin et al. [6] investigated effects of head and tongue position on F0 and perturbation analysis. Head extension, thought to cause hyoid-larynx complex changes analogous to the vocal fold tension present in high vowels, resulted in increased F0 and decreased perturbation measures. Tongue protrusion, analogous to the tongue position in low vowels, resulted in decreased F0 and increased perturbation measures [6]. Therefore, it appears that F0 variation, sound pressure level variation, and acoustic filtering of the vocal tract are necessary to generate significant vowel effects on measures of perturbation. This study was in agreement with previous studies regarding effects of vowel on F0; however, vowel effects on perturbation results remain inconclusive.
Nonlinear dynamic analysis of the /a/, /i/, and /u/ vowels produced results in agreement with previous work, which found nonlinear parameters to be highest for /a/, intermediate for /i/, and lowest for /u/ [17,18]. Here, the parameters D2 and K2 were applied for nonlinear analysis. The /a/ vowel produced significantly greater K2 in males and females, as well as D2 in males, than the high vowels /i/ and /u/ (fig. 6). This indicates that low vowels, such as /a/, may possess greater complexity than high vowels, such as /i/ and /u/. It appears that nonlinear dynamic findings are relatively consistent with the results of traditional F0 and SNR analysis, which also measure properties of the voice source, in that all four parameters tend to distinguish low from high vowels for both males and females. The low vowel /a/ had lesser harmonic activity in its signals, as indicated by its lowest SNR values, and the slowest vibratory frequencies, as indicated by F0 values. Generally, this vowel also exhibited more complex behaviors, as indicated by its highest D2 and K2 values. Conversely, the high vowels /i/ and /u/ had greater harmonic activity and higher vocal fold vibratory frequencies, and demonstrated less complexity.
Conclusion
This study applied perturbation and nonlinear dynamic analyses to normal vowels in order to determine vowel selection effects on acoustic analysis. Results indicated that vowel effects on perturbation analysis are inconsistent among this and previous studies; this suggests that percent jitter and percent shimmer are not useful parameters in reliably describing acoustic differences between vowels. Results for F0 corroborated previous work, indicating highest F0 for /i/ and /u/ and lowest F0 for /a/. SNR results showed that /i/ and /u/ demonstrated greater noise than /a/. Results of nonlinear dynamic analysis suggested that more complex activity is evident in /a/ than in /i/ and /u/, as signified by higher D2 and K2 values for /a/. To confirm the acoustic effects of vowel selection as found in this study, vowel effects on acoustic perturbation and nonlinear dynamic analyses should be studied in other voice types, such as dysphonic voices. Future studies could also investigate the effects of vowels on nonlinear dynamic analysis when variables such as filter effects, F0, and sound pressure level are eliminated through electroglottographic measurement and other controls.
Acknowledgements
This study was supported by NIH Grant RO1 DC006019 from the National Institute of Deafness and Other Communication Disorders. The authors would like to express their gratitude to Christopher Vang, who aided in data analysis.
References
- 1.Higgins MB, Netsell R, Schulte L. Vowel-related differences in laryngeal articulatory and phonatory function. J Speech Lang Hear Res. 1998;41:712–724. doi: 10.1044/jslhr.4104.712. [DOI] [PubMed] [Google Scholar]
- 2.Honda K. Relationship between pitch control and vowel articulation. In: Bless DM, Abbs JH, editors. Vocal Fold Physiology: Contemporary Research and Clinical Issues. San Diego: College-Hill; 1983. pp. 286–297. [Google Scholar]
- 3.Fant G. Acoustic Theory of Speech Production. ed 2. The Hague: Mouton; 1970. Source-filter description of speech production; pp. 15–21. [Google Scholar]
- 4.Jiang JJ, Zhang Y, McGilligan C. Chaos in voice, from modeling to measurement. J Voice. 2006;20:2–17. doi: 10.1016/j.jvoice.2005.01.001. [DOI] [PubMed] [Google Scholar]
- 5.Howard DM. The real and the non-real in speech measurements. Med Eng Phys. 2002;24:493–500. doi: 10.1016/s1350-4533(02)00054-1. [DOI] [PubMed] [Google Scholar]
- 6.Lin E, Jiang J, Noon SD, Hanson DG. Effects of head extension and tongue protrusion on voice perturbation measures. J Voice. 2000;14:8–16. doi: 10.1016/s0892-1997(00)80090-9. [DOI] [PubMed] [Google Scholar]
- 7.Ramig LA, Ringel RL. Effects of physiological aging on selected acoustic characteristics of voice. J Speech Hear Res. 1983;26:22–30. doi: 10.1044/jshr.2601.22. [DOI] [PubMed] [Google Scholar]
- 8.Linville SE, Korabic EW. Fundamental frequency stability characteristics of elderly women's voices. J Acoust Soc Am. 1980;23:202–209. doi: 10.1121/1.394642. [DOI] [PubMed] [Google Scholar]
- 9.Orlikoff RF. Vocal stability and vocal tract configuration: an acoustic and electroglottographic investigation. J Voice. 1995;9:173–181. doi: 10.1016/s0892-1997(05)80251-6. [DOI] [PubMed] [Google Scholar]
- 10.Horii Y. Vocal shimmer in sustained phonation. J Speech Hear Res. 1980;23:202–209. doi: 10.1044/jshr.2301.202. [DOI] [PubMed] [Google Scholar]
- 11.Sorensen D, Horii Y. Frequency and amplitude perturbation in the voices of female speakers. J Commun Disord. 1983;16:57–61. doi: 10.1016/0021-9924(83)90027-8. [DOI] [PubMed] [Google Scholar]
- 12.Kiliç MA, Öğüt F, Dursun G, Okur E, Yildirim I, Midilli R. The effects of vowels on voice perturbation measures. J Voice. 2004;18:318–324. doi: 10.1016/j.jvoice.2003.09.007. [DOI] [PubMed] [Google Scholar]
- 13.Wilcox KA, Horii Y. Age and changes in vocal jitter. J Gerontol. 1980;35:194–198. doi: 10.1093/geronj/35.2.194. [DOI] [PubMed] [Google Scholar]
- 14.Sussman JE, Sapienza C. Articulatory, developmental, and gender effects on measures of fundamental frequency and jitter. J Voice. 1994;8:145–156. doi: 10.1016/s0892-1997(05)80306-6. [DOI] [PubMed] [Google Scholar]
- 15.Giovanni A, Ouaknine M, Triglia J-M. Determination of largest Lyapunov exponents of voice signal: application to unilateral laryngeal paralysis. J Voice. 1999;13:341–354. doi: 10.1016/s0892-1997(99)80040-x. [DOI] [PubMed] [Google Scholar]
- 16.Tokuda I, Miyano T, Aihara K. Surrogate analysis for detecting nonlinear dynamics in normal vowels. J Acoust Soc Am. 2004;110:3207–3217. doi: 10.1121/1.1413749. [DOI] [PubMed] [Google Scholar]
- 17.Koga H, Nakagawa M. A chaotic synthesis model of vowels. J Phys Soc Jpn. 2003;72:751–761. [Google Scholar]
- 18.Hu S, Zhang Y, Du G. Nonlinear dynamic characteristic analysis of speech for Chinese. Chin J Acoust. 2000;19:230–239. [Google Scholar]
- 19.Titze IR. Principles of Voice Production. Upper Saddle River: Prentice-Hall; 1994. [Google Scholar]
- 20.Milenkovic P, Read C. CSpeech Version 4, User's Manual. Madison, 1992.
- 21.Milenkovic P. Least mean square measures of voice perturbation. J Speech Hear Res. 1987;30:529–538. doi: 10.1044/jshr.3004.529. [DOI] [PubMed] [Google Scholar]
- 22.Zhang Y, McGilligan C, Zhou L, Vig M, Jiang J. Nonlinear dynamic analysis of voices before and after surgical excision of vocal polyps. J Acoust Soc Am. 2004;115:2270–2277. doi: 10.1121/1.1699392. [DOI] [PubMed] [Google Scholar]
- 23.Grassberger P, Procaccia I. Measuring the strangeness of strange attractors. Physica D. 1983;9:189–208. [Google Scholar]
- 24.Grassberger P, Procaccia I. Estimation of the Kolmogorov-entropy from a chaotic signal. Phys Rev A. 1983;28:2591–2593. [Google Scholar]
- 25.Jiang JJ, Zhang Y, Ford CN. Nonlinear dynamics of phonations in excised larynx experiments. J Acoust Soc Am. 2003;114:2198–2205. doi: 10.1121/1.1610462. [DOI] [PubMed] [Google Scholar]
- 26.Zhang Y, Jiang JJ, Biazzo L, Jorgensen M. Perturbation and nonlinear dynamic analysis of voices from patients with unilateral laryngeal paralysis. J Voice. 2005;19:519–528. doi: 10.1016/j.jvoice.2004.11.005. [DOI] [PubMed] [Google Scholar]
- 27.Jiang JJ, Zhang Y. Nonlinear dynamic analysis of speech from pathologic subjects. Electron Lett. 2002;38:294–295. [Google Scholar]
- 28.Packard NH, Crutchfield JP, Farmer JD, Shaw RS. Geometry from a time series. Phys Rev Lett. 1980;45:712–716. [Google Scholar]
- 29.Takens F. Detecting strange attractors in turbulence. In: Rand DA, Young LS, editors. Lecture Notes in Mathematics. Berlin: Springer; 1981. pp. 366–381. [Google Scholar]
- 30.Fraser AM, Swinney HL. Independent coordinates for strange attractors from mutual information. Phys Rev A. 1986;33:1134–1140. doi: 10.1103/physreva.33.1134. [DOI] [PubMed] [Google Scholar]
- 31.Theiler J. Spurious dimension from correlation algorithms applied to limited time series data. Phys Rev A. 1986;34:2427–2432. doi: 10.1103/physreva.34.2427. [DOI] [PubMed] [Google Scholar]
- 32.Titze IR. Physiologic and acoustic differences between male and female voices. J Acoust Soc Am. 1989;85:1699–1707. doi: 10.1121/1.397959. [DOI] [PubMed] [Google Scholar]
- 33.Sapir S. The intrinsic pitch of vowels: theoretical, physiological, and clinical considerations. J Voice. 1989;3:44–51. [Google Scholar]
- 34.Titze IR. Workshop on acoustic voice analysis: summary statement. Denver: National Center for Voice and Speech; 1995. pp. 18–23. [Google Scholar]
- 35.Karnell MP, Chang A, Smith A, Hoffman H. Impact of signal type of validity of voice perturbation measures. NCVS Status Progr Rep. 1997;11:91–94. [Google Scholar]
- 36.Titze IR, Winholtz WS. Effect of microphone type and placement on voice perturbation measurements. J Speech Hear Res. 1993;36:1177–1190. doi: 10.1044/jshr.3606.1177. [DOI] [PubMed] [Google Scholar]
- 37.Karnell MP, Scherer RS, Fischer LB. Comparison of acoustic voice perturbation measures among three independent voice laboratories. J Speech Hear Res. 1991;34:781–790. doi: 10.1044/jshr.3404.781. [DOI] [PubMed] [Google Scholar]
- 38.Bielamowicz S, Kreiman J, Gerratt BR, Dauer MS, Berke GS. Comparison of voice analysis systems for perturbation measurement. J Speech Hear Res. 1996;39:126–134. doi: 10.1044/jshr.3901.126. [DOI] [PubMed] [Google Scholar]
- 39.Carson CP, Ingrisano DRS, Eggleston KD. The effect of noise on computer-aided measures of voice: a comparison of CSpeechSP and the Multi-Dimensional Voice Program software using the CSL 4300B Module and Multi-Speech for Windows. J Voice. 2003;17:12–20. doi: 10.1016/s0892-1997(03)00031-6. [DOI] [PubMed] [Google Scholar]
- 40.Deliyski DD, Shaw HS, Evans MK. Adverse effects of environmental noise on acoustic voice quality measurements. J Voice. 2005;19:15–28. doi: 10.1016/j.jvoice.2004.07.003. [DOI] [PubMed] [Google Scholar]
- 41.Horii Y. Jitter and shimmer differences among sustained vowel phonations. J Speech Hear Res. 1982;25:12–14. doi: 10.1044/jshr.2501.12. [DOI] [PubMed] [Google Scholar]


