

Abstract
The ferryl (Fe(IV)O) intermediate is important in many heme enzymes and thus the precise nature of the Fe(IV)-O bond is critical in understanding enzymatic mechanisms. The 1.40 Å crystal structure of cytochrome c peroxidase Compound I has been solved as a function of x-ray dose while monitoring the visible spectrum. The Fe-O bond increases linearly from 1.73 Å in the low x-ray dose structure to 1.90 Å in the high dose structure. The low dose structure correlates well with a Fe(IV)=O bond while we postulate that the high dose structure is the cryo-trapped Fe(III)-OH species previously thought to be Fe(IV)-OH.
The ferryl, Fe(IV)O, species is a critically important intermediate in a number of metalloproteins and especially heme enzymes. The high redox potential enables Fe(IV)O to serve as a potent oxidant utilized by several heme enzymes including cytochromes P450, nitric oxide synthase (NOS), cytochrome oxidase, and peroxidases. Since the ferryl intermediate is quite stable in peroxidases, most of what we know about Fe(IV)O in heme enzymes derives from studies with peroxidases.
In most heme peroxidases one H2O2 oxidizing equivalent is used to oxidize Fe(III) to Fe(IV)O and the second is used to oxidize an organic group to give Fe(IV)R.+ (1) and this activated intermediate is called Compound I. In most heme peroxidases such as horse radish peroxidase (HRP) R is the porphyrin (2) although in yeast cytochome c peroxidase (CCP) R is the active site Trp191 (3). A majority of studies find that the Fe(IV)-O bond is short, somewhat less than 1.7 Å, thus indicating a Fe(IV)=O bond as opposed to a Fe(IV)-OH bond (4). An empirical formula called Badger’s rule relates the calculated Fe-O bond with the calculated vibrational frequency (5) and the experimental frequencies and EXAFS bond distances fit very well to these plots (5) further supporting a Fe(IV)=O double bond. However, a majority of x-ray crystal structures are distinct outliers giving distances closer to 1.8-1.9 Å (4, 6) with one exception being the HRP Compound I structure (7). These differences are not trivial since the longer bond predicts that the ferryl species should be protonated to give Fe(IV)-OH, while the shorter bond gives Fe(IV)=O. The chemistry of each of these species is quite different (8) and knowing the correct structure is essential if we are to understand details of heme enzyme mechanisms.
A serious problem encountered at high intensity synchrotron x-ray sources is rapid reduction of metal centers, particularly high potential metal centers such as Fe(IV). As a result great care must be taken to minimize reduction and the redox state should be verified during data collection (for example with UV/VIS spectroscopy). We recently found that crystals of the CCP N184R mutant diffract unusually well (9) and thus might provide an opportunity to obtain a low x-ray dose Compound I structure but at sufficiently high resolution to resolve the discrepancies between crystal structures and solution studies. Here we present single crystal spectroscopy together with a composite data collection strategy that has allowed the Fe-O bond distance to be measured as a function of x-ray dose.
Fig. 1A shows the single crystal spectrum of CCP Compound I as a function of x-ray dose. Before data collection the spectrum in the 500-700 nm region is identical to the solution spectrum of Compound I. After extensive x-ray exposure (inset to Fig. 1A) the spectrum clearly is no longer that of Compound I nor is this similar to the Fe(III) high spin solution spectrum of CCP. The nature of this species will be discussed further on. Fig. 1B shows the estimated percentage of Compound I remaining in the crystal as a function of x-ray exposure as monitored by changes in the visible spectrum. Based on this plot ~90% of Compound I remains after receiving an estimated x-ray dose of 0.035 MGy (calculations were performed using RADDOSE (10)) or just ~0.1% of the theoretical radiation damage limit for protein crystals, ≈30 MGy (11). Therefore, a data collection strategy for obtaining predominantly Compound I was employed using multiple crystals, none of which received more than 0.035 MGy.
Figure 1.

Single crystal spectra of CCP Compound I as a function of x-ray dose. Prior to x-ray exposure the spectrum is identical to the solution spectrum of Compound I. The estimated percentage of Compound I remaining in the crystal as a function of x-ray dose in panel B was based on the decrease in the absorbance peak at 634 nm.
With this maximum dose, we estimate that the resulting “integrated” structure is comprised of ~90% Compound I. Crystallographic data collection was carried out at 65 K on SSRL BL9-2 (~4×10¹¹ photons/s at 13.0 KeV). Nearly 100 crystals were mounted and indexed in an automated fashion. Exposures used for indexing were attenuated by 99% and did not significantly contribute to reduction of Compound I. For each crystal, data collections were carried out in 15 separate runs. Run 1 consisted of 5° of data, representing the first 0.035 MGy of x-ray exposure. Then the same 5° of scanning angle were recollected 12 more times giving runs 2 through 13 with increased x-ray dose. In run 14 a full 120° of data were collected in order to fully reduce the crystal followed by run 15 which again repeated the same 5° representing the highest x-ray dose. The same 15-run data collection protocol was adopted for similarly sized crystals and the scanning angles were chosen to optimize the completeness of the data. Each composite data set was assembled by merging 5° of data with identical run numbers from 19 crystals. A total of 15 structures at 1.40 Å resolution were refined providing a picture of the structural changes associated with increasing x-ray dose (Table S1).
In Fig. 2A we compare the structures of the low dose (set 1) and the ferric resting state 1.06 Å structure of the N184R mutant (3E2O) (9). In the ferric resting state a water molecule is positioned ≈ 2.0 Å from the heme iron while in the low dose data set the Fe-O oxygen distance is 1.73 Å. In both structures a water molecule is within H-bonding distance of the Fe-linked oxygen. In the ferric state the heme iron is displaced from the porphyrin plane by 0.18 Å toward the proximal His ligand while in Compound I the iron is displaced by 0.07 Å in the opposite direction toward the distal pocket. Thus the net movement of the iron is ≈ 0.25 Å relative to the porphyrin plane owing to the oxidation of the iron from Fe(III) to Fe(IV). Note that the water molecules in the distal pocket, including the one closest to the iron, are located in nearly the same position relative to the heme while the His-Fe bond increases from 2.07 Å to 2.12 Å upon oxidation to Fe(IV). Thus, the short Fe-O bond in the Compound I structure is due in large part to motion of the iron. As in our previous work on peroxide treated CCP (12) Arg48 in the distal pocket forms a 2.78 Å H-bond with the iron linked O atom.
Figure 2.
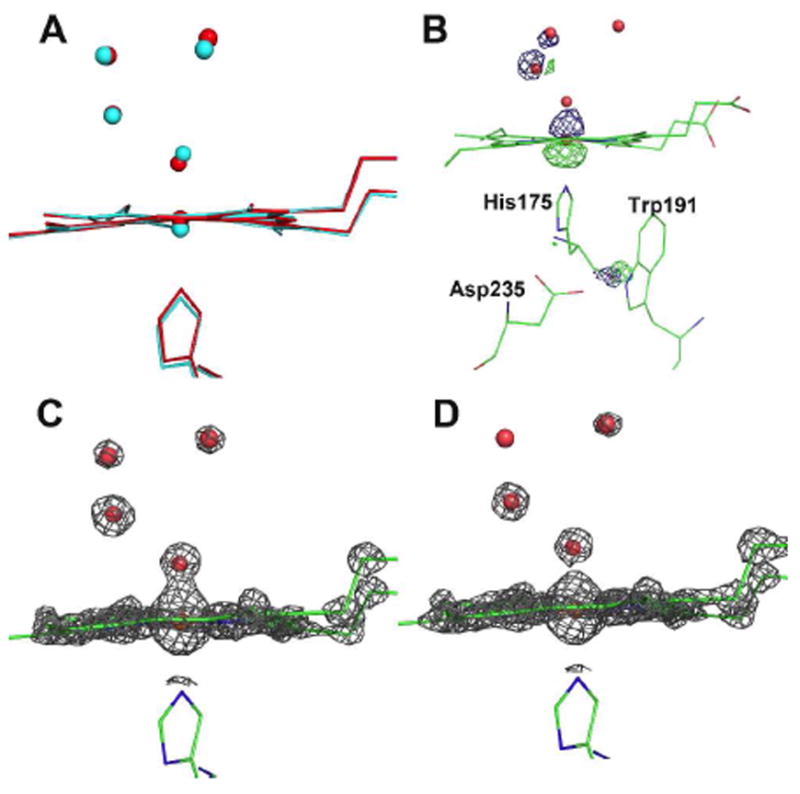
A) Superposition of the low dose structure (red) on the Fe(III) structure (cyan). Note that the iron is displaced below the plane of the heme in the Fe(III) structure and above the plane of the heme in the low dose structure; B) Fo(low dose)-Fo(high dose) electron density difference map using phases obtained from the low dose structure. The map is contoured at -5.0σ (green) and +5.0σ (blue); C and D) 2Fo-Fc electron density maps contoured at 4.0σ for the dose data set 1 (panel C) and high dose data set 15 (panel D). Oxygen and water molecules are represented by the small spheres.
We next compare the set 1 (low dose, Fig. 2C) and set 15 (high dose, Fig. 2D) structures. At the 4.0 σ contour level the electron density between the Fe and O atoms is not continuous in set 15 and the Fe-O bond length has increased from 1.73 Å to 1.90 Å. The local water structure remains largely unchanged. The changes owing to x-ray induced reduction are highlighted by examining a Fo(low dose)-Fo(high dose) electron density difference map contoured at ±5σ (Fig. 2B). This map clearly shows that the iron is positioned quite differently in each structure and is closer toward the distal pocket in the low dose structure. In addition the His-Fe bond decreases from 2.12 Å to 2.07 Å upon photo reduction again due to motion of the iron back into the porphyrin plane. The only other notable feature in the Fo(low dose)-Fo(high dose) difference map is around the carbonyl O atom of the heme ligand, His175. This group is slightly less than 0.1 Å closer to Trp191 in the low dose structure and may reflect a local tightening of the structure around the Trp191 cation radical that provides additional electrostatic stability. The various heme parameter distances are provided in Table S2.
The structures of set 1 through set 13 next were used to assess how the Fe-O bond changes as a function of x-ray dose and the results are shown in Fig. 3. The fit to a simple straight line equation is remarkably good and extrapolates to zero dose at a Fe-O bond distance of 1.72 Å. Raman data (13) coupled with Badger’s rule (4) gives a Fe-O bond of 1.68 Å. Therefore, the low dose Compound I crystal structure agrees within 0.04 Å with the Raman data and the ferryl center in CCP Compound I can best be described as Fe(IV)=O and not Fe(IV)-OH.
Figure 3.

Plot of the Fe-O distance as a function of x-ray dose. Each of the 13 structures was refined exactly the same way using the same starting structure and two different protocols. In the first the distances between the Fe and N atoms (4 pyrrole and 1 His closed circles) were restrained while in the second protocol no restraints were applied (open circles). At no time were restraints imposed on the Fe-O distance. The estimated error in the Fe-O bond distance is ≈0.017Å (see Supporting Information).
The nature of the ferryl center after extensive x-ray exposure is intriguing: the short Fe-O bond (1.90 Å) compared to the ≈ 2.0 - 2.3 Å observed in Fe(III) high spin peroxidase structures and the total lack of similarity between the high dose spectrum (Fig. 1) and the solution spectrum of Fe(III) CCP shows that the high dose structure is not that of Fe(III) high spin CCP. The spectrum is similar to that of HRP Fe(II) in both the crystal and solution except in HRP there is no ligand coordinated to the iron (7). Since we clearly see a ligand coordinated to the iron in the high dose structure we very likely have trapped either Fe(II)-OH or Fe(III)-OH. Unfortunately we cannot compare single crystal and solution spectra since formation of Fe(III)-OH, and presumably Fe(II)-OH, requires an increase in pH and CCP is not stable above pH 8.0.
Our first goal in this study was to further develop the necessary methods and protocols required to obtain x-ray structures of high potential intermediates in metalloproteins. This requires isomorphous crystals that diffract well in order to have sufficient resolution to obtain the level of accuracy required for estimating subtle bond parameter differences (7). Coupling data collection with on-line single crystal spectroscopy to monitor the redox state is also essential. Our second goal was to obtain a very low dose x-ray structure of CCP Compound I at high resolution in order to reconcile the long standing differences observed in the Fe(IV)-O bond distance between most available x-ray structures and other biophysical techniques. The low dose CCP Compound I structure agrees within 0.04 Å of previous experimental estimates indicating that the ferryl species in Compound I is Fe(IV)=O and not Fe(IV)-OH. It should be noted that from the perspective of the heme, CCP Compound I is equivalent to HRP Compound II since both contain Fe(IV) with no porphyrin radical. Thus it is likely that other crystal structures where the Fe(IV)-O bond in Compound II was estimated to be 1.8 Å (7, 14) or longer may also have a significant amount of a reduced iron species.
Supplementary Material
Acknowledgments
We thank Aina Cohen, John Kovarick and Michael Hollenbeck for their contribution to the design and implementation of the single-crystal microspectrophotometer. Portions of this research were carried out at the Stanford Synchrotron Radiation Lightsource, a national user facility operated by Stanford University on behalf of the U.S. Department of Energy, Office of Basic Energy Sciences. The SSRL Structural Molecular Biology Program is supported by the Department of Energy, Office of Biological and Environmental Research, and by the National Institutes of Health, National Center for Research Resources, Biomedical Technology Program, and the National Institute of General Medical Sciences. Work at UCI was supported by NIH grant GM42614 (TLP).
Footnotes
SUPPORTING INFORMATION AVAILABLE
Experimental details and Tables 1S and 2S . This material is available free of charge at http://pubs.acs.org.
References
- 1.Poulos TL, Kraut J. J Biol Chem. 1980;255:8199–8205. [PubMed] [Google Scholar]
- 2.Dolphin D, Forman A, Borg DC, Fajer J, Felton RH. Proc Natl Acad Sci USA. 1971;68:614–618. doi: 10.1073/pnas.68.3.614. [DOI] [PMC free article] [PubMed] [Google Scholar]
- 3.Sivaraja M, Goodin DB, Smith M, Hoffman BM. Science. 1989;245:738–740. doi: 10.1126/science.2549632. [DOI] [PubMed] [Google Scholar]
- 4.Behan RK, Green MT. J Inorg Biochem. 2006;100:448–459. doi: 10.1016/j.jinorgbio.2005.12.019. [DOI] [PubMed] [Google Scholar]
- 5.Green MT. J Am Chem Soc. 2006;128:1902–1906. doi: 10.1021/ja054074s. [DOI] [PubMed] [Google Scholar]
- 6.Hersleth HP, Hsiao YW, Ryde U, Gorbitz CH, Andersson KK. Chem Biodivers. 2008;5:2067–2089. doi: 10.1002/cbdv.200890189. [DOI] [PubMed] [Google Scholar]
- 7.Berglund GI, Carlsson GH, Smith AT, Szoke H, Henriksen A, Hajdu J. Nature. 2002;417:463–468. doi: 10.1038/417463a. [DOI] [PubMed] [Google Scholar]
- 8.Green MT, Dawson JH, Gray HB. Science. 2004;304:1653–1656. doi: 10.1126/science.1096897. [DOI] [PubMed] [Google Scholar]
- 9.Meharenna YT, Oertel P, Bhaskar B, Poulos TL. Biochemistry. 2008;47:10324–10332. doi: 10.1021/bi8007565. [DOI] [PMC free article] [PubMed] [Google Scholar]
- 10.Paithankar KS, Owen RL, Garman EF. J Synchr Radiat. 2009;16:152–162. doi: 10.1107/S0909049508040430. [DOI] [PubMed] [Google Scholar]
- 11.Owen RL, Rudino-Pinera E, Garman EF. Proc Natl Acad Sci U S A. 2006;103:4912–4917. doi: 10.1073/pnas.0600973103. [DOI] [PMC free article] [PubMed] [Google Scholar]
- 12.Bonagura CA, Bhaskar B, Shimizu H, Li H, Sundaramoorthy M, McRee D, Goodin DB, Poulos TL. Biochemistry. 2003;42:5600–5608. doi: 10.1021/bi034058c. [DOI] [PubMed] [Google Scholar]
- 13.Reczek CM, Sitter AJ, Terner J. J Molec Struc. 1989;214:27–41. [Google Scholar]
- 14.Hersleth HP, Dalhus B, H GC, A KK. J Biol Inorg Chem. 2002;7:299–304. doi: 10.1007/s007750100296. [DOI] [PubMed] [Google Scholar]
Associated Data
This section collects any data citations, data availability statements, or supplementary materials included in this article.