

Abstract
The electronic structure of the [Cu3S2]3+ core of [(LCu)3(S)2]3+ (L = N,N,N′,N′-tetramethyl-2R,3R-cyclohexanediamine) is investigated using a combination of Cu and S K-edge X-ray absorption spectroscopy and calculations at the density functional and multireference second-order perturbation levels of theory. The results show that the [Cu3S2]3+ core is best described as having all copper centers close to, but more oxidized than, Cu2+, while the charge on the S2 fragment is between that of a sulfide (S2−) and a subsulfide (S23−) species. The [Cu3S2]3+ core thus is different from a previously described, analogous [Cu3O2]3+ core, which has a localized [(Cu3+Cu2+Cu2+)(O2−)2]3+ electronic structure. The difference in electronic structure between the two analogues is attributed to increased covalent overlap between the Cu 3d and S 3p orbitals and the increased radial distribution function of the S 3p orbital (relative to O 2p). These features result in donation of electron density from the S-S σ* to the Cu and result in some bonding interaction between the two S atoms at ~ 2.69 Å in [Cu3S2]3+, stabilizing a delocalized S=1 ground state.
1 Introduction
Since the initial report of its synthesis and characterization in 2005,1 the electronic structure of complex 1 (Figure 1) has been extensively debated. This complex (as well as an analog supported by N,N,N′,N′-tetramethylethylenediamine) was prepared in the course of efforts to construct synthetic clusters2 with which to understand the properties of the novel tetracopper-sulfide active site (“CuZ”)3 in the environmentally important enzyme nitrous oxide reductase.4 In the initial report,1 the X-ray crystal structure of 1 was described, key characteristics being the presence of square planar copper ions arranged in a trigonal bipyramidal cluster geometry with approximately D3h local symmetry for the [Cu3S2]3+ core.5 This core geometry is distinct from that of the previously reported [Cu3O2]3+ congener (2),6 which has C2v local symmetry manifested by shorter metal-ligand bond distances for one copper ion than for the other two. On the basis of these structural data and spectroscopic/theoretical studies, a valence localized electronic structure (Cu3+(Cu2+)2) with an S = 1 ground state was assigned for 2.7 In contrast, a delocalized S = 1 ground state was postulated for 1 on the basis of its higher symmetry, Cu hyperfine splitting in its EPR spectrum, and DFT calculations (structure A, Figure 2).1 This electronic structure assignment was stated to arise from “more effective σ-type overlap between the S p orbitals” and a resulting inversion of the energy ordering of the frontier orbitals relative to the [Cu3O2]3+ complex.1
Figure 1.

Representation of the X-ray crystal structure of complex 1 (50% thermal ellipsoids)1 and drawings of complexes 2–5. Tp = tris(3,5-diisopropylpyrazolyl)hydroborate, L = N,N,N′,N′-tetramethyl-2R,3R-cyclohexanediamine, L′ = N,N,N′,N′-tetramethylethylenediamine.
Figure 2.

Proposed S-S bonding interactions and electronic structures for complex 1. Note that the charge on the three Cu centers is delocalized in all electronic structures of 1.
The σ-type overlap between the S p orbitals was emphasized further by Hoffmann and Mealli,8 who proposed a different electronic structure for 1. They argued that a better description is [(Cu1+Cu2+2)(μ-S22−)]3+ (C, Figure 2). Relative to A, in C the S2− ligands are oxidized by two electrons to yield a S22− ligand with an S-S bond, and the copper ions are reduced (formally, the Cu3+ ion in A is reduced to Cu1+). The questions of the proper oxidation state assignments to the Cu and S atoms in 1 and of the presence or absence of a S-S bond were further debated in a separate publication.9 While no firm resolution was provided, agreement was reached that the actual electronic structure might lie between these two extremes and that in both cases covalency in the Cu-S bonding contributes to valence delocalization. A third hypothesis was then put forth by Berry,10 who argued on the basis of broken symmetry DFT calculations that the best way to view 1 is as having three Cu2+ ions antiferromagnetically coupled to a S23− radical (B, Figure 2), where the 2.7 Å distance between the S atoms is consistent with a predicted S-S bond order of 0.5. This issue of extent of donation from the S to the metal center and the magnitude of the resultant S-S interaction has been a general issue in inorganic chemistry.11 In previous studies, there has been no direct method to evaluate the extent of S donation to the metal center and S-S bonding experimentally. However, in recent years, we have developed a S K-edge XAS methodology as a direct probe of the metal-ligand covalency allowing these issues to now be addressed experimentally.12
We sought to resolve the controversy surrounding the electronic structure of 1 through the use of Cu and S K-edge X-ray absorption spectroscopy (XAS) and a combination of DFT and CASPT2 calculations, the latter properly taking into account any multiconfigurational character of the complex that, if present, would pose challenges to application of standard Kohn-Sham DFT.13 Previous studies have illustrated the utility of Cu and S K-edge XAS for establishing the electronic structure of copper-sulfur complexes, including [Cu(MNT)2](Bu4N)n (3a, n = 1; 3b, n = 2),14 [(TpCu)2(μ–η2:η2-S2)] (4),15 and [(LCu)2(μ-1,2-S2)2](OTf)2 (5)16 (Figure 1).17 Our interpretation of the data for 1 was calibrated by these previous studies, which in combination with results from studies of its analog 2 having the [Cu3O2]3+ core,7 provide key benchmarks for experimentally determining the oxidation states of the Cu ions and S atoms and the extent of S-S bonding in 1.
2 Experimental Section
2.1 Sample Preparation
Complex 1 was synthesized by treatment of [(N,N,N′,N′-tetramethyl-2R,3R-cyclohexanediamine) Cu(CH3CN)]PF6 with S81 or Ph3SbS.18 Because 1 is extremely air sensitive, sample manipulation and loading into the XAS cells were performed in an inert atmosphere glove box. Samples were prepared for both solution (5 mM in CH2Cl2) and polycrystalline Cu K-edge XAS measurements. Lucite XAS cells (2 mm) were used with 37 μm Kapton windows for the solution samples. The solid samples were finely ground with BN into a homogeneous mixture and pressed into a 1 mm aluminum spacer between 37 μm Kapton windows. The samples were immediately frozen and stored under liquid N2. During data collection, the samples were maintained at a constant temperature of ~10 K using an Oxford Instruments CF 1208 liquid helium cryostat. For S K-edge XAS studies, polycrystalline samples were finely ground inside a glove box using an agate mortar and pestle and a thin layer was applied on S-free 37 μm Kapton tape placed on an aluminum frame. The samples were protected from exposure to air by a 4 μm polypropylene window placed over the front of the aluminum frame over the sample. Samples were transported using sealed jars to the beamline and exposure to air was minimized during sample holder transfer into a He purged data measurement chamber.
The purity of the samples prepared by the Ph3SbS method was determined by x-ray crystallography (identical interatomic distances and angles within experimental error compared to the original report, see cif file in Supporting Material)1 and UV-vis spectroscopy and single-crystal samples from the same batch were used for Cu- and S K-edge S K-edge XAS measurements. Comparison with the S K-edge data obtained from the S8 method indicated very similar spectra (a very small amount of contamination was consistently observed in repeat measurements on samples prepared by the S8 method). The data presented here are those obtained from the sample prepared using the Ph3SbS method.18
2.2 X-ray Absorption Spectroscopy
2.2.1 Cu K-edge
Cu K-edge XAS spectra for 1 were measured on the 16 pole, 2 T wiggler beamline 9-3 at the Stanford Synchrotron Radiation Lightsource (SSRL) under standard ring conditions of 3 GeV and ~200 mA ring current. A Si(220) double-crystal monochromator was used for energy selection. Other optical components used for the experiments were a Rh-coated harmonic rejection mirror and a cylindrical Rh-coated bent focusing mirror. Spectra were collected in the fully tuned configuration of the monochromator. Data on the solution samples were measured in fluorescence mode using a Canberra 100-element solid-state Ge monolith detector. For the polycrystalline samples, spectra were measured in transmission mode using an ionization chamber placed after the sample. Internal energy calibration was accomplished by simultaneous measurement of the absorption of a Cu foil placed between two ionization chambers situated after the sample. The first inflection point of the foil spectrum was fixed at 8980.3 eV. The solution samples were monitored for photoreduction throughout the course of data collection. To minimize the effect of beam damage and photoreduction, data were collected on an unexposed region of the sample cell after every scan (1 scan per spot) for the solution sample. Spectra presented are 5 scan averages. The solid samples were resistant to photoreduction and a 2-scan average spectrum was sufficient to obtain a good signal to noise ratio in the EXAFS region. Similar data reduction protocol was followed for both the solution and polycrystalline data sets. A second-order polynomial was fit to the pre-edge region and subtracted from the entire spectrum as background. A three-region spline of orders 2, 3, and 3 was used to model the smoothly decaying post-edge region. The data were normalized using the Pyspline19 program by subtracting a cubic spline and assigning the edge jump to 1.0 at 9000 eV.
Theoretical EXAFS signals, χ(k), were calculated using FEFF (Macintosh version 8.4)20 and the X-ray crystal structure of 1. The theoretical models were fit to the data using EXAFSPAK.21 The structural parameters varied during the fitting process were the bond distance (R) and the bond variance σ2, which is related to the Debye-Waller factor resulting from thermal motion, and static disorder of the absorbing and scattering atoms. The non-structural parameter E0 (the energy at which the photoelectron wave vector k is 0) was also allowed to vary but was restricted to a common value for every component in a given fit. Coordination numbers were systematically varied in the course of the fit but fixed within a given fit.
2.2.2 S K-edge
S K-edge XAS data were collected on the 20-pole 2T wiggler unfocussed beamline 4-3 under standard ring operating conditions of 3 GeV and ~200 mA ring current. A Si(111) double crystal monochromator was used for energy selection. Upstream optics include a Ni-coated vertically collimating and harmonic rejection mirror. Room temperature measurements were performed on the sample in fluorescence mode using a Lytle detector. The sample was monitored for potential effects of beam damage and photoreduction. A slow change of the spectral features over several scans was observed and only the first scan was used for data analysis. Energy calibration was achieved using Na2S2O3.5H2O as the calibrant, which was run at intervals between sample scans. The first peak of the Na2S2O3.5H2O spectrum was fixed at 2472.02 eV. A second-order polynomial was fit to the pre-edge region and subtracted from the entire spectrum as background. The data were normalized using the Pyspline19 program by subtracting a cubic spline and assigning the edge jump to 1.0 at 2490 eV. The areas under the pre-edge peaks were fit using the EDG_FIT subroutine in EXAFSPAK.21 The pre-edge and rising-edge features were modeled with pseudo-Voigt line-shapes with a fixed 1:1 Lorentzian/Gaussian ratio. The reported intensity and half-width values are based on averages over simultaneous fits that accurately modeled the data and their second derivative. Normalization procedures introduce 3% error in the value of the integrated area under the pre-edge peak.
2.3 Computational Details
2.3.1 Density Functional Theory
Spin unrestricted density functional theory (DFT) calculations were performed using ORCA 2.6.35 on a 16-cpu Linux cluster.22 The BP8623 local functional and the following basis sets were employed for the calculations: the core properties, triple-ζ basis set CP(PPP) with three polarization functions on Cu,24 the Ahlrich’s all electron TZVPP on S and O, and TZVP on all other atoms.25 The input structures for 1 and the [Cu3(μ-O)2]3+ core were based on the published crystal structures.1,6 Tight convergence criteria were imposed on all calculations. Calculations were performed in a dielectric continuum using the conductor like screening model (COSMO)26 with CH2Cl2 as the dielectric medium. Orbital contour plots were generated in Molden27 and Mulliken population and Mayer bond order analyses were performed in QMForge.19 Time-dependent DFT calculations were performed with the electronic structure program ORCA28–30 to calculate the energies and intensities of the S K- and Cu K-pre-edge transitions. The tight convergence criterion was imposed on all calculations. The calculated energies and intensities were Gaussian broadened with half-widths of 0.5 eV (S K-edge) and 1.5 eV (Cu K-edge) to account for core-hole lifetime and instrument resolution. The calculated pre-edge energy positions were down shifted by ~76 eV (S K-pre-edge) and ~230 eV (Cu K-pre-edge). This is generally the case with core level TD-DFT calculations since DFT does not describe core potentials accurately, resulting in the core levels being too high in energy relative to the valence levels.28
Spin unrestricted DFT calculations were also performed in Gaussian 0931 to assess additional functional choices. Starting from the coordinates obtained from the X-ray crystal structure of 1 with counterions discarded, the heavy atoms were held in place while the hydrogen atom positions were optimized at the M06-L32 level of density functional theory (DFT) employing the SDD33 pseudopotential and basis set for Cu and the 6-31G(d,p) basis set34 for all other atoms. The resulting geometry was used for single point DFT calculations with the following functionals: BP86, M06-L, B3LYP,23b,35 M06, and M06-2X.36
2.3.2 Complete Active Space and Multireference Calculations
Single point complete-active-space self-consistent-field (CASSCF) and multireference second-order perturbation theory calculations (CASPT2) were carried out with a 14-electron in 12-orbital active space on both the quintet and triplet states. This active space included a critical frontier region having 4 electrons and 4 orbitals (2 of a2 symmetry and 2 of e symmetry, see Section 3.4) as well as additional orbitals consistent with the framework orbital analysis of Carrasco et al.37 for M3S2 cores (these remaining orbitals are depicted in the supporting information). Canonical molecular orbitals and their energies were obtained from the CAS natural orbitals by diagonalization of the effective Fock operator. Pseudo-scalar relativistic effects were included through use of the Douglas-Kroll-Hess Hamiltonian38 and the following set of basis functions: relativistic all electron ANO-RCC of triple-zeta quality (ANO-RCC-VTZP) contracted as 5s3p2d1f for Cu and 4s3p1d for S, ANO-RCC-VDZP contracted as 3s2p1d on C and N, and ANO-RCC-MB contracted as 1s for H.39
Mulliken population analyses were performed using both the CAS and CASPT2 density matrices. Population analysis was also performed following the LoProp procedure.40 Localization of the CAS canonical molecular orbitals was accomplished41 in order to compute the effective bond order (EBO)42 of the S–S σ bond in [(LCu)3S2]3+ (computed as half the difference in occupation numbers for the localized S–S σ bonding and σ* antibonding orbitals). All calculations at the CASSCF and CASPT2 level employed the MOLCAS package of electronic structure programs.43 To facilitate the large active space calculations, the molecular geometry employed was that from the crystal structure of the TMEDA analog of 1, again with hydrogen atom positions optimized at the M06-L level. Calculations with smaller active spaces of (8,8) and (10,9) were performed for 1 itself with entirely similar results; a summary appears in the supporting information.
3 Results and Analysis
3.1 Cu K-edge
3.1.1 EXAFS
Cu K-edge EXAFS data and their corresponding non phase-shift corrected Fourier transforms for 1 in polycrystalline and solution phases are presented in Figure 3 (top). The EXAFS intensity is significantly lower in the solution phase and the beat pattern is dissimilar to that of the polycrystalline data. A dramatic decrease in the Fourier transform intensity is observed in the solution data, in addition to a shift to lower R′ (non-phase shift corrected R) values for both the first and the second shells. Fits to the EXAFS data for both the solution and polycrystalline phase were attempted with the theoretical phase and amplitude parameters generated by FEFF using the crystal structure of 1 as the input model. Fits to the solution data were unsuccessful using this model as the Cu-Cu and Cu-S theoretical paths could not be accommodated. Best fits to the solution data were obtained using 4 Cu-N contributions to the first shell and weak multiple scattering interactions to the second shell. FEFF fits to the polycrystalline data are presented in Figure 1 (bottom) and in Table 1. The first shells of the data were fit using 2 Cu-N contributions at 2.0 Å, 2 Cu-S contributions at 2.24 Å and 2 Cu-Cu contributions at 3.11 Å. These distances are in close agreement with those obtained from x-ray diffraction, which are 2.02 Å, 2.25 Å and 3.13 Å, respectively.
Figure 3.

Cu K-edge EXAFS data (inset) and their corresponding non phase-shift corrected Fourier transforms. (top) A comparison of the solution (
 ) and polycrystalline (—) data. (bottom) FEFF fits to the polycrystalline EXAFS data; data (—), fit (
 ).
).
Table 1.
EXAFS Least Squares Fitting Results for Crystalline 1.
| Coordination/Path | R(Å)a | σ2(Å2)b | E0 (eV) | Fc |
|---|---|---|---|---|
| 2 Cu-N | 2.00 | 248 | ||
| 2 Cu-S | 2.24 | 281 | ||
| 2 Cu-Cu | 3.11 | 829 | −3.38 | 0.18 |
| 2 Cu-C | 2.84 | 129 | ||
| 4 Cu-C-Ne | 3.02 | 129d | ||
| 8 Cu-C-Ne | 4.42 | 640 |
The estimated standard deviations for the distances are in the order of ± 0.02 Å.
The σ2 values are multiplied by 105.
Error is given by Σ[(χobsd − χcalcd)2 k6]/Σ[(χobsd)2k6].
The σ2 value for the the Cu-C (single scattering) and Cu-C-N (multiple scattering) paths were fixed to be the same value.
In summary, the Cu K-edge EXAFS analyses clearly indicate that 1 in the polycrystalline phase retains the geometric structure defined by X-ray crystallography, but transforms in solution to a different stucture(s) that gives rise to different averaged metrical parameters. Therefore, the Cu and S K-edge X-ray absorption spectroscopy experiments presented in the following sections were performed on polycrystalline samples of 1.
3.1.2 Cu K-pre-edge
The normalized Cu K-edge XAS spectrum for 1 is presented in Figure 4 and energies obtained from the spectral fit are presented in Table 2. Previously reported Cu K-edge XAS spectra for [CuII(MNT)2](NBu4)2 (3a) and [CuIII(MNT)2](NBu4) (3b) (MNT= maleonitriledithiolate) are also included in Figure 4 for comparison with that of 1.14 The inset shows the second derivative of the spectrum in the pre-edge region.44 The energy of the pre-edge feature, due to a Cu 1s→3d transition,45 has a dominant contribution from the ligand field strength at the Cu center46 and typically occurs at ~8979 eV44,47,48 for Cu(II) complexes. Note that an ~ 1 eV spread in the pre-edge energy position has been observed for Cu(II) (and Cu(III)) complexes with different ligation and ligand-field strengths (see Figure S1 and associated text in supporting information). The pre-edge shifts to higher energy for Cu centers in a strong ligand field environment (e.g., 3a, for which the pre-edge is at 8979.3 eV, Table 2). The pre-edge features of Cu(III) complexes occur 1.5 to 2 eV to higher energy than those for Cu(II) complexes (e.g., 3b, for which the pre-edge is at 8980.7 eV, Table 2). The pre-edge feature for 1 occurs at 8979.5 eV, slightly higher than 3a (a Cu(II) complex with a strong ligand field) but significantly lower than 3b, a typical Cu(III) complex.49 Importantly these data exclude the possibility that 1 is a localized mixed valent Cu(III)Cu(II)Cu(II) complex, since such a species would have two resolvable pre-edge features (see supporting information, Figure S2).
Figure 4.

The normalized Cu K-edge XAS spectra for 1 (
,
 ), [Cu(MNT)2](Bu4N) (3b) (—) and [Cu(MNT)2](Bu4N)2 (3a) (
 ,
,
 ). The inset shows the second derivative spectra over the pre-edge region.
Table 2.
Cu K-edge XAS Energy Positions (eV).
| Complex | Pre-edge Energy (eV)a | Rising-edge Energy (eV)a,b |
|---|---|---|
| 1 | 8979.5 | 8985.1 |
| 3a | 8979.3 | 8985.0 |
| 3b | 8980.7 | 8986.6 |
| (Cu3+Cu2+Cu2+)c | - | 8986.3 |
| (Cu1+Cu2+Cu2+)c,d | - | 8984.2 |
| (Cu1+Cu2+Cu2+)c,e | - | Not observed |
Core hole lifetime and instrument broadening ~2.5 eV (full width at half maxima).
1s→4p transition for Cu(I) complexes and 1s→4p+shakedown transition for Cu(II) and Cu(III) complexes.
Simulated spectra.
Three-coordinate Cu(I).
Four-coordinate Cu(I) do not have strong near-edge features.
3.1.3 Cu K-near-edge
The Cu K near-edge spectrum for 1 is reproduced from Figure 4 in Figure 5, along with simulated spectra (see below). Complex 1 has an intense rising-edge feature at 8985.1 eV (Table 2). Cu K-near edge XAS spectra of square planar Cu(II) and Cu(III) complexes have intense rising edge features attributed to formally forbidden Cu 1s→4p + ligand-to-metal charge transfer shakedown transitions.50 A database of Cu K-near-edge spectra is available which shows that the energy position of the edge transition typically occurs at ~ 8986 eV for Cu(III) complexes.14,51 Copper(II) complexes with tetragonal ligation tend to exhibit Cu 1s→4p + ligand-to-metal charge transfer shakedown transitions between 8985–8986 eV, while those with sulfur ligation tend to be at the lower end of this energy range (Figure S3 and Table S2).
Figure 5.

The normalized Cu K-edge XAS spectrum for 1 (
,
) and simulated spectra representing the (Cu3+Cu2+Cu2+) (—), (Cu1+Cu2+Cu2+, 3-coordinate Cu(I)) (
,
) and (Cu1+Cu2+Cu2+, 4-coordinate Cu(I)) (
 ,
,
 ) oxidation states. The simulated spectra have been generated using the normalized Cu K-edge XAS spectra for 3b, 4, [CuI(pze)](BF4) (pze = bis[2-(3,5-dimethyl-1-pyrazolyl)ethyl]ether)](three coordinate) and Cu(I)(2,5-dithiahexane)2(ClO4)(four coordinate).
Intense near-edge transitions are also observed in Cu(I) complexes but are due to low lying Cu 1s→4p transitions. The energy and intensity of these transitions are strongly affected by the coordinating ligands and the geometry of the site.48 Typically intense features are observed for two and three coordinate Cu(I) species for which the rising edge feature occurs at ~ 8984 eV. In four coordinate Cu(I) species, the edge features are to higher energy, but these are generally not intense.
A qualitative comparison of the rising edge energy position of 1 with simulated spectra representing the localized (Cu3+Cu2+Cu2+) and (Cu1+Cu2+Cu2+) cases (both three and four coordinate) is given in Figure 5 to further evaluate the oxidation state of the three Cu centers in 1. The Cu K-edge XAS spectra of [CuI(pze)](BF4) (pze = bis[2-(3,5-dimethyl-1-pyrazolyl)ethyl]ether),48 CuI(2,5-dithiahexane)2(ClO4), 3b,48 and 4 (Figure 1)17 were used for the simulations. Resulting edge-energy positions are reported in Table 2. The rising-edge energy positions of the simulated spectra are ~1 eV lower (for localized (Cu1+Cu2+Cu2+)) or 1 eV higher (for localized (Cu3+Cu2+Cu2+)) than that of 1. This shows that the rising edge of 1 is not consistent with either a localized (Cu3+Cu2+Cu2+) or a localized (Cu1+Cu2+Cu2+) electronic configuration.
Figure 4 and Table 2 do show that the rising edge energy position of 1 is within 0.1 eV of 3a, which is a Cu(II) complex with S4 ligation. This similarity indicates that the charge on the Cu centers in 1 is close to that of a Cu(II) ion with MNT ligation. However, since the rising edge feature at 8985.1 eV corresponds to a Cu 1s→4p + ligand-to-metal charge transfer shakedown transition, which is dependent on the nature of the ligand-metal bond and geometry as well as the charge on the Cu center (see Figure S3 and Table S2, which show the range of rising-edge energy positions for square-planar Cu complexes with different ligands), a delocalized structure with limited additional oxidation or reduction of the Cu centers is not excluded by these data.
3.2 S K-edge
The S K-edge XAS spectra of open-shell transition metal complexes with covalent metal-S bonds have a low-lying pre-edge transition arising from the S 1s→ψ* excitation (where, ψ* = sqrt(1-a2 − b2)|M3d> − a|S3p> − b|Lnp>)(a2 and b2 represent S3p and residual ligand character, respectively). Intense S K-near-edge features also occur due to transitions into low-lying valence molecular orbitals with significant S 3p character. As presented below, the energies and intensities of these transitions provide insight into the oxidation state of sulfur and copper in 1.
The normalized S K-edge XAS spectrum for 1 is shown in Figure 6 (red trace) and its spectral fit parameters are presented in Table 3. The spectrum is dominated by two low-energy features, which occur at 2469.5 and 2470.7 eV. The near-edge region (between 2474 and 2480 eV) contains several transitions, with two intense features at 2473.8 and 2475.3 eV. For comparison, the previously published S K-edge XAS spectra for 4 and 5 are also included in Figure 6.17 Complex 4 has been defined as a dicopper(II)-disulfido (S22−) complex, while 5 is a dicopper(II)-supersulfido (S2•−) complex in which the two S2 moieties are each one electron oxidized relative to 4, and have an additional bonding interaction between them.15− Both 4 and 5 also have two intense transitions in the low-energy region, which are separated from the near-edge and edge region of the spectra. In an earlier study,17 it was shown that the higher energy feature, at 2471.9 eV and 2473.0 eV in 4 and 5, respectively, is due to the low lying S 1s → S-S σ* transition. On going from 5 to 4, this peak shifts to lower energy by ~1.1 eV reflecting increased negative charge on S and decreased antibonding interaction between the two sulfur atoms. This is consistent with the electronic structure descriptions since on going from 5 to 4 the S2 moiety is reduced by one electron (S2•− to S22−) and the S-S bond distance becomes longer (1.95 to 2.07 Å). The normalized integrated intensity per S2 unit, which reflects the number of holes in the S-S σ* orbital, is comparable for 4 and 5 (~1 in Table 3, right column).
Figure 6.

The normalized S K-edge XAS spectra for 1 (
), 4 (—), and 5 (
,
 ).
).
Table 3.
S K-edge XAS Energy Positions (eV) and integrated intensities.
| Complex | Pre-edge Energy (eV)a | Pre-edge Intensityb | Peak 2 Energy (eV)a,c | Peak 2 Intensityb,d |
|---|---|---|---|---|
| 1 | 2469.5 | 2.13 | 2470.7 | 0.51 |
| 4 | 2470.9 | 1.87 | 2471.9 | 1.02 |
| 5 | 2471.1 | 3.04 | 2473.0 | 0.90 |
Core hole lifetime and instrument broadening ~1.5 eV (full width at half maxima).
The error in total intensity due to data processing and fitting is ±5%.
Peak 2 represents the S 1s → S-S σ* transition for 4 and 5.
The intensity per S2 unit.
In 1 the higher energy pre-edge feature is 1.2 eV lower in energy than the 1s → S-S σ* transition in 4 and has approximately half the intensity. If this were a 1s → S-S σ* transition, it would be consistent with an (S2)3− description as the relative intensity would reflect the electron occupation of the orbital and the lower energy would correspond to the increased negative charge on the S, thus raising the energy of the S 1s orbital, increasing the S-S σ* antibonding interaction, and lowering the energy of the S-S σ* orbital. However, a two peaked pre-edge spectrum similar to that of 1 is also obtained from TD-DFT calculations on a perturbed version of 1 with the S-S constrained at 3.2 Å, a distance at which there is no S-S bond and the molecule can be described as a sulfide species (see section 3.3.3). For this species, the two peaks in the pre-edge region together correspond to S 1s transitions to the unoccupied Cu d orbitals with significant sulfur character. Thus, the 2470.7 eV peak in 1 indicates that the S2 unit has been reduced at least to the (S2)3− level, but does not preclude further reduction.
We now focus on the lowest energy peak in 1 (Figure 6), which is at 2469.5 eV, 1.4 eV lower in energy than the lowest energy peak in 4 (2470.9 eV). As shown in Scheme 1, three factors affect the energy of this pre-edge feature: The ligand field (LF) (an increase in ligand field strength increases the S K-pre-edge energy position), the negative charge on the S (increase in negative charge raises the S 1s energy and therefore lowers the pre-edge energy) and the charge on the Cu center (increase in charge on Cu lowers the d-manifold energy and therefore the pre-edge energy position). As indicated in section 3.1.2, the Cu K-pre-edge energy position reflects the LF strength and as shown in Figure S4 this feature is 0.3 eV higher in 1 than in 4. The higher energy pre-edge feature in 1 is 1.2 eV to lower energy than the S-S σ* peak in 4. This energy shift should reflect an upper limit of the increase in energy of the 1s orbital (see Scheme 1) due to an increase in negative charge, as the σ* has either come down in energy (for S23−) or the S-S bond is broken (in the (S2−)2 limit). Thus, on going from 4 to 1, the LF should increase the energy of the 1s→3d pre-edge feature by 0.3 eV and the increase in negative charge on the S should decrease it by up to 1.2 eV (Scheme 2). These results mean that the S K-pre-edge energy position in 1 is at least 0.5 eV lower in energy than expected for a Cu(II) complex in a covalent S environment, reflecting an increase of the average charge on the three Cu centers in 1 relative to the two Cu ions in 4.
Scheme 1.
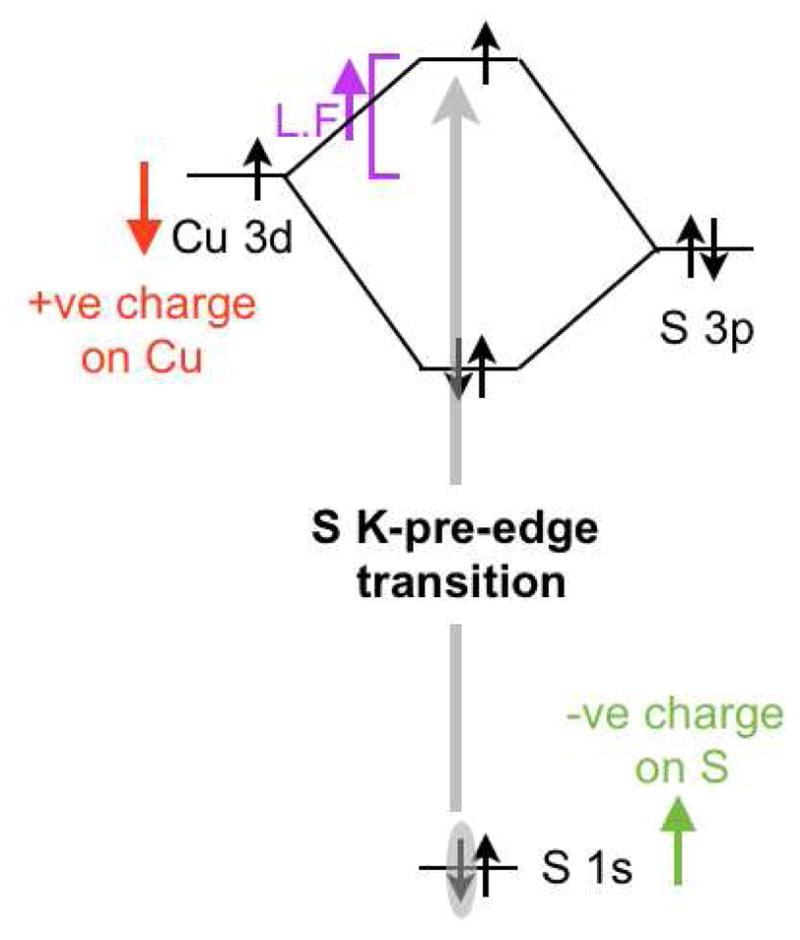
The factors that affect the energy of the S K-edge pre-edge transition in transition metal-S complexes. L.F =ligand field, −ve = negative, +ve = positive. The colored arrows indicate the direction of the energy shift.
Scheme 2.
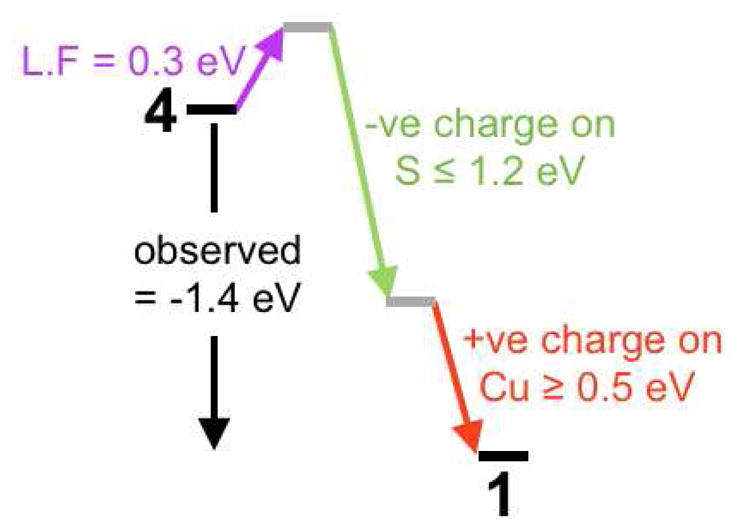
Scheme showing the factors that contribute to the difference in pre-edge energy position of 4 (left) and 1 (right). Color scheme has been matched to Scheme 1.
A summary of S K-edge XAS pre-edge energies and intensities of twelve representative Cu(II) containing complexes with different types of sulfur ligation is presented in Table S3. The data show that the total pre-edge intensity is higher in 1 relative to all listed complexes except for 5, which has been shown to have over ~75% S character in the ground state wavefunction due to the hole in the supersulfide ligand. The high total pre-edge intensity in 1 indicates strong Cu-S overlap. Typically the pre-edge energy position of copper complexes in the same oxidation state and in similar ligand environments increases with an increase in the Cu-S covalent overlap. However, for 1, while the pre-edge intensity is significantly higher than that of most other compounds, the pre-edge energy is lower than that of all species except plastocyanin, which has a weak equatorial ligand-field. Thus, the high pre-edge intensity combined with the low pre-edge energy for 1 also indicate an increase in charge on the metal center, relative to the covalent Cu(II) complexes in Table S3 and Figure S5.
A well studied system to benchmark ligand K-pre-edge energy shifts with metal-based oxidation is the Cl K-pre-edge shifts on going from [FeCl4]2− to [FeCl4]−.52 These systems have been extensively studied by x-ray spectroscopy and ligand-field effects are available from absorption data. In addition, the Cl K-edge energy is not complicated by other bonding interactions. From the published Cl and Fe K-edge XAS data for [FeCl4]2− and [FeCl4]−,53 the pre-edge shift to lower energy due to a one electron oxidation is ~3.8 eV. A full one-electron oxidation distributed over three metal centers would therefore shift the pre-edge by ~1.3 eV, indicating that the > 0.5 eV shift observed in going from 4 to 1 reflects partial oxidation of the Cu centers in 1 relative to the covalent Cu(II) centers in 4.
The pre-edge features observed in the S K-pre-edge region are transitions from S 1s to valence orbitals with significant S 3p character, and the intensity of the pre-edge region reflects the amount of S 3p character mixed into these valence orbitals. As presented below (section 3.3.2), 1 has four spin unrestricted unoccupied valence orbitals (1α and 3β) formed from combinations of the Cu 3dx2 -y2 and the S 3p orbitals. The two intense pre-edge features observed in 1 (Figure 6) reflect very strong mixing between these orbitals. The total integrated intensity under both peaks in 1 is higher than that in 4 (see Table 3), indicating an increase in S 3p character (per hole) in the valence orbitals and thus an increase in the donor interaction of the S with the Cu.
In summary, the S K-edge data presented above in combination with the Cu K-edge data presented in sections 3.1.1 and 3.1.2 show that: (a) 1 does not have a localized Cu1+ or Cu3+ center and is best described as a delocalized trimeric Cu species, (b) the S2 moiety is reduced relative to the (S22−) level, (c) the effective nuclear charge on each copper is greater than that of a covalent (Cu2+) complex and (d) that there is a strong donor bonding interaction from the S2 to the Cu centers.
3.3 Density Functional Theory
3.3.1 Choice of Functional
Density functional theory in its Kohn-Sham implementation employs a single determinant formalism for the construction of the non-interacting Kohn-Sham wave function. In the presence of significant non-dynamical correlation effects, Kohn-Sham and Hartree-Fock wave functions are well known to break spin symmetry in unrestricted SCF calculations, which may gain correlation energy at the expense of introducing spin-state contamination. Hybrid functionals containing partial exact Hartree-Fock exchange have a higher tendency to break spin symmetry due to favorable HF exchange energy associated with high-spin states. In 1, this would lead to an increase in the spin expectation value, <S2>, for the triplet state from the correct eigenvalue of 2.00 and would lead to the relative stabilization of the quintet state compared to the triplet state.
To explore the sensitivity of results to the choice of functional, single-point DFT calculations were performed in Gaussian 09 on the cationic [(LCu)3S2]3+ portion of the crystal structure of 1, using the BP86, M06-L, B3LYP, M06, and M06-2X density functionals, which contain 0%, 0%, 20%, 27%, and 54% HF exchange, respectively. Using the SDD pseudopotential basis set on copper and the MIDI! basis set on all other atoms, the computed values for <S2> at the BP86, M06-L, B3LYP, M06, and M06-2X levels are 2.02, 2.03, 2.20, 2.11, and 2.51, respectively. The corresponding triplet-quintet state energy splittings are −40.02, −38.6, −34.0, −35.7, and −27.0 kcal/mol, respectively. The relative energy values were compared to the more computationally accurate value of −42.3 kcal/mol obtained by CASPT2 calculations (see Section 3.4). It is clear that increased HF mixing lowers the triplet-quintet energy gap and allows for quintet spin contamination into the triplet state; the B3LYP result is rather poor, and the M06-2X prediction is unacceptable. However, both the <S2> value and the triplet-quintet energy gap for the local functionals BP86 and M06-L indicate little or no mixing of the triplet and quintet states and represent a true triplet ground state for 1. Therefore the DFT calculations presented in this study have been performed using the BP86 functional.
3.3.2 Geometric and Electronic Structure
Spin unrestricted broken-symmetry density functional calculations were performed on the [(LCu)3S2]3+ moiety derived from the crystal structure of 1 in ORCA 2.6.35 using the BP86 functional, CP(PPP) basis set on Cu, TZVPP on S, and TZVP on all other atoms. The molecule optimizes to a symmetric structure with equivalent Cu-Cu, Cu-S and Cu-N bond distances. The geometry optimized bond angles and distances are in reasonable agreement with the crystallographic parameters (Table 4). Geometry optimizations were attempted with starting geometries significantly distorted from a symmetric structure but all optimized to the symmetric structure. Complex 1 is an S = 1 species with two unpaired electrons in molecular orbitals arising from a combination of the Cu 3dx2 -y2 and S 3p orbitals. The resultant αLUMO and the three βLUMO, βLUMO+1, βLUMO+2 orbitals have dominant Cu and S character with the βLUMO and βLUMO+1 orbitals nearly degenerate (Figure 7) (note that the αLUMO and βLUMO+2 correspond to the a2″ and a2″ and the degenerate βLUMO and βLUMO+1 pair correspond to the e″ symmetry set in section 3.4). This description is consistent with previously published DFT results on 1.1,8 Note that the calculated S-S distance is 0.08 Å longer than the crystal structure (Table 4). Geometry optimization with the S-S fixed at the experimental distance results in a total energy increase of 3.16 kCal/mol (and an S-S bond order increase of 0.02 (vide infra)).
Table 4.
Crystallographic and DFT Structural Parameters for 1.
| Crystal Structurea,b | DFTa,b | Δa | |
|---|---|---|---|
| Cu-S | 2.25 | 2.28 | 0.03 |
| Cu-Cu | 3.13 | 3.13 | 0.00 |
| S-S | 2.69 | 2.77 | 0.08 |
| Cu-S-Cu | 88.2° | 87.7° | 0.05° |
| Cu-N | 2.03 | 2.07 | 0.04 |
Distances are in Å units.
Small deviations in the third decimal have been averaged and rounded to the nearest second decimal.
Figure 7.

DFT energy-level diagram for the Cu-Cu distance constrained symmetric calculation at the sulfide (A, Figure 2), disulfide (C, Figure 2), experimental and subsulfide (B, Figure 2) limits (see section 3.3.3). Results are from the calculations on the S=1 species and the four unoccupied levels with D3h symmetry labels (1 α and 3 β) are shown. In each case the energy level of the α orbital is represented by a lighter color. Mulliken populations for each orbital are shown; total Cu 3d (black) and total S 3p(red). The contour plots for the experimental limit are shown.
3.3.3 S—S Interaction
To evaluate the extent of the S···S interaction in 1, density functional theory calculations were performed on the [(LCu)3S2]3+ complex with the three Cu···Cu distances symmetrically fixed at intervals between 2.6 to 3.9 Å. All other structural parameters were allowed to optimize and a D3h symmetric structure was obtained in each case. Structural parameters for selected Cu···Cu distances and Mayer bond orders and Mulliken charges are included in Table 5. Figure 7 includes a comparison of the DFT calculated energy level diagrams, the Cu(3d) and S(3p) Mulliken populations, and contour plots of the four relevant unoccupied valence orbitals (1α and 3β).
Table 5.
Selected DFT Parameters at Variable Cu···Cu Distances.a
| Bond Distance (Å)b | Mayer Bond Order | Mulliken Chargec | |||||||
|---|---|---|---|---|---|---|---|---|---|
| Cu-Cub | Cu-S | S-S | Cu-N | Cu-S | S-S | Cu-N | Cu | S | N |
| 2.600 | 2.20 | 3.22 | 2.15 | 0.52 | 0.06 | 0.35 | 0.62 | −0.54 | −0.22 |
| 3.13d | 2.25d | 2.69d | 2.03d | 0.53 | 0.23 | 0.45 | 0.59 | −0.51 | −0.26 |
| 3.414 | 2.34 | 2.53 | 2.05 | 0.47 | 0.43 | 0.45 | 0.60 | −0.51 | −0.24 |
| 3.900 | 2.50 | 2.18 | 2.03 | 0.32 | 0.97 | 0.48 | 0.63 | −0.46 | −0.26 |
The calculations were performed on the cation of 1.
Average Cu-S and Cu-N distance are listed (variation ≤0.002 Å).
Average over all six N atoms.
experimental structure, calculation performed by optimizing the hydrogens.
The calculations show that as the Cu···Cu distance increases the S···S distance decreases from 3.22 to 2.18 Å. In the structure with an S···S distance of 2.18 Å, the S···S Mayer bond order is 0.97, indicating a strong S-S interaction. This strong S-S interaction destabilizes the αLUMO and the βLUMO+2, which have the dominant S-S σ* contribution (see Figure 7, far right), relative to the degenerate βLUMO and βLUMO+1 set. These two low-lying orbitals have equal contributions from all three Cu 3dx2 -y2 orbitals, with a significant contribution from S-S π* orbitals (⊥ to the S-S bond (z-axis)) due to covalent overlap. These calculations indicate that for an S-S = 2.18 Å, the ground state is symmetric, a strong disulfide bond is formed and the electronic structure is consistent with a delocalized [3Cu]5+/S22− description (disulfide limit; structure C in Figure 2).
In the constrained structure with an S···S distance of 3.22 Å, the S···S Mayer bond order is 0.06 (Table 5), indicating that there is essentially no bonding interaction between the two S atoms. The αLUMO and βLUMO+2 valence orbitals are close to the degenerate βLUMO and βLUMO+1 set and all four orbitals have very similar Cu 3dx2 -y2 character and almost equal overall contribution from all three Cu centers (Figure 7, far left). The four holes with dominant Cu character and the lack of any bonding interaction between the two sulfur atoms indicate that these are best described as sulfides and the electronic structure with S-S fixed at 3.22 Å is most consistent with a delocalized (3Cu)7+/2S2− bonding description (sulfide limit; structure A in Figure 2). An interesting parallel can be drawn between the DFT calculations and the histogram of experimental S-S bond distances in M2S2 and M3S2 complexes presented in reference 9, which shows that the overwhelming majority of complexes either fall in the disulfide or in the sulfide limit. Based on the histogram, the two distances chosen for the disulfide and sulfide limits fall in the appropriate range and represent the electronic structures described above.
Geometry optimization was also performed with a fixed Cu···Cu distance of 3.414 Å and the resulting S···S distance and Mayer bond order were 2.53 Å and 0.43, respectively (Table 5). As the S-S bond is elongated from 2.18 Å (disulfide limit in Figure 7, far right) to 2.53 Å, the nearly pure S-S σ* αLUMO and βLUMO+2 are stabilized and strongly mix with the Cu 3d x2 -y2 orbitals (Figure 7, middle right). The total Cu character in these two orbitals (38.5%) is halfway between the amount in the sulfide (66.6%) and disulfide limits (10.4%). The increased Cu character relative to the disulfide limit is coupled to a decrease in S character (133.6%), which is also halfway between the sulfide (73.7%) and disulfide limits (182.1%). The Mulliken valence population analysis together with the half integer bond order indicate that at an S-S distance of 2.53 Å, the electronic structure is consistent with a (3Cu)6+/S23− description (subsulfide species; structure B in Figure 2).
The DFT calculations on the crystal structure (hydrogens optimized, Figure 7, middle left) gave an S-S Mayer bond order of 0.23, indicating a decrease from the calculated value for the subsulfide, although it is higher than for the sulfide limit. Mulliken population analysis shows that the amount of Cu character in the αLUMO and βLUMO+2 orbitals is 53.5%, which lies between the sulfide limit (66.6%) and the subsulfide (35.5%) indicating that the three Cu centers are more oxidized in 1 relative to the subsulfide case. The S character in the αLUMO and βLUMO+2 orbitals (101.9%) is also approximately halfway between the sulfide (73.7%) and subsulfide (133.6%) limits, indicating that while there is some S-S bonding interaction present in 1, it is weaker than that in a subsulfide species. These DFT results are consistent with the Cu and S K-edge XAS data and analysis presented in section 3.2, which indicate that the Cu centers are more oxidized than in a covalent cupric complex, albeit not to the (Cu3)7+ level.
Figure 8 shows the S K-pre-edge calculated TD-DFT spectra for the four structures shown in Figure 7. All calculated spectra result from four dominant transitions (vertical lines in Figure 8). These are the S 1s transitions to the four valence orbitals shown in Figure 7. The calculated spectrum for the disulfide limit clearly has two separate peaks representing transitions to the e″ (both β) and a2″ (α and β) orbitals, respectively. As the S-S bond is elongated, the four levels come closer together in energy (Figure 7) and the calculated spectrum has one asymmetric peak for the subsulfide and experimental limit. For the sulfide limit, the four orbitals (Figure 7) separate due to differences in the N contribution to the e″ set, and a two peak spectrum is predicted. Although the calculated spectrum for 1 does not reproduce the experimental spectrum accurately, the calculations do show that as the S-S bond is elongated and the sulfur atoms are reduced, the higher energy pre-edge transition shifts closer to the lower energy transition as observed in going from 5 to 4 to 1. TD-DFT calculated spectra for structures of 1, 4 and 5 are included in the supporting information (Figure S7) and their energies and intensities (along with those of the Cu K-edge calculated spectra (Figure S6)) are summarized in Figure S4 and the associated text. Note that on going from the disulfide limit to the sulfide limit the lower energy pre-edge feature shifts to lower energy by ~1.3 eV, which is comparable to the experimental shift of 1.4 eV on going from 4 to 1. This is consistent with 1 having more Cu(III) character relative to 4.
Figure 8.

TD-DFT calculated spectra for the four limits presented in Figure 7: sulfide (
), experimental (
), subsulfide (—) and disulfide (
). Calculations performed in ORCA.
3.4 CAS and Multireference Description of 1
From the CASPT2 calculations, the electronic structure of 1 can be further evaluated on the basis of the 4-electrons-in-4-orbital subspace described in the DFT calculations in the previous section. A schematic of the critical (4,4) subspace is presented in Figure 9A, and the corresponding canonical orbitals from the CAS(14,12) calculation are presented in Figure 9B to illustrate their conformity to those derived from the DFT calculations. Calculations were performed for both the quintet and triplet states. The calculated wave function for the quintet state has 94.8% contribution from a single configuration state function (CSF) 5|1a2exey2a2〉 (see Figure 9). By contrast, the triplet wave function is highly multiconfigurational with significant contributions from five CSFs, namely, , and . The substantial non-dynamical correlation associated with the triplet state derives from the relatively narrow energy separation between the frontier e and 2a2 orbitals.
Figure 9.

(A) Schematic of the molecular orbital diagram for the interaction of a S–S 3pz out of phase combination with the π-like orbitals of a tricupracyclopropenium-like system. Irreducible representations are assigned for D3 symmetry. (B) Natural orbital CAS(14,12) subspace conforming to Figure 9A. Hydrogen atoms are omitted for clarity.
The triplet state is predicted to be more stable than the quintet state by −25.6 kcal/mol at the CAS(14,12) level. Accounting for dynamical electron correlation at the CASPT2 level, this state-energy splitting increases in magnitude to −42.3 kcal/mol, illustrating the degree to which the triplet state benefits from accounting for both non-dynamical and dynamical electron correlation effects.
The high-energy quintet is a Cu2+Cu2+Cu2+/S23− species, since for each of the hybrid orbitals in Figure 9A to be singly occupied, the initial orbitals (to the left and right of the schematic) also have to be singly occupied. Therefore in the quintet state, all three copper atoms and the S2 subunit carry one spin each, effectively defining the Cu2+Cu2+Cu2+/S23− electronic structure in [(LCu)3S2]3+. Using this as a reference, the electronic structure of the triplet species can be analyzed to evaluate the degree to which polarization in the triplet state, resulting from spin pairing in one of the hybrid orbitals, may affect its electronic structure description.
Mulliken population analyses of the triplet and quintet states from CASSCF and CASPT2 densities, or LoProp analysis of the CASSCF densities, show that the partial atomic charges of the Cu and S atoms are similar in the two states with only small differences (see Table 6). EBO analysis of the S–S bond in the quintet and triplet states (see Supporting Information for contour plots of the S–S σ and σ* orbitals, which are essentially localized) show that the occupation numbers of the σ and σ* orbitals are 1.97 and 0.93 in the triplet and 1.97 and 1.01 in the quintet states, leading to effective bond orders of 0.52 and 0.48, respectively, corresponding to a bond order close to a subsulfide species. Based on the similarities in partial atomic charges between the two states and the EBO analysis, 1 can be best described as a species with an S-S interaction close to a subsulfide species at the CASSCF level.
Table 6.
Mulliken and LoProp charges (a.u.) for triplet and quintet 1.
| Atoms | 2S+1 | Mulliken (CAS) | Mulliken (LoProp) | Mulliken (CASPT2) |
|---|---|---|---|---|
| Cu | 3 | 0.955 | 1.258 | 0.953 |
| 5 | 0.976 | 1.287 | 0.973 | |
| S | 3 | −0.367 | −0.926 | −0.370 |
| 5 | −0.392 | −0.960 | −0.394 |
However, we have noted above that dynamical electron correlation plays a significant role in stabilizing the triplet state. Within a configuration interaction formalism, a significant part of that stabilization is expected to derive from excitations out of occupied orbitals into the nominal LUMO, i.e., the 2a2 orbital. Thus, we would expect dynamical electron correlation effects not accounted for at the CASSCF level to somewhat weaken the S-S bonding relative to the CASSCF analysis.
4. Discussion
A combination of Cu and S K-edge XAS and calculations have been used to determine the electronic structure of the [Cu3S2]3+ core of 1. The Cu K-pre-edge and rising-edge XAS data clearly indicate that 1 is neither a localized Cu3+Cu2+Cu2+/2S2− nor a localized Cu1+Cu2+Cu2+/S22− system. Comparison of the energy and intensity of the higher energy S K-pre-edge feature in 1 relative to reference compounds (Figure 6) reveals that the pair of S atoms in 1 are reduced relative to a disulfide (S22−) description. The energy of the lowest energy pre-edge feature (Figure 6) indicates that 1 is, in fact, even more reduced than a subsulfide (S23−) species. These conclusions were reached through comparisons to data obtained and analyzed for a number of previously studied compounds.14,15,46,52,53
DFT and CASSCF calculations show that the Cu 3d and S 3p orbitals undergo strong covalent overlap, with significant S character mixed into the lowest lying unoccupied MO’s. This is consistent with the high intensity of the S K-pre-edge transition (Figure 6), which reflects the amount of S 3p mixed into the unoccupied Cu 3d orbitals. All the calculations indicate a strong interaction between the S and the Cu centers. The DFT calculations predict a S-S Mayer bond order of 0.26, while the CASSCF calculations predict a somewhat larger bond order of ~0.5. Both indicate a weak-bonding interaction between the two S atoms. Together with the XAS results, the calculations indicate that the [Cu3S2]3+ core is delocalized, with strong covalent overlap between the Cu and S atoms and a weak bonding interaction between the two S atoms.
A key question concerns the origin of the weak bonding interaction between the two S atoms in 1. To understand this, DFT calculations were performed on the D3h (imposed) symmetric oxygen analog 2 for comparison to 1. The calculated electronic structure of 2 closely resembles those obtained previously.1,7 Relevant DFT parameters are presented in the Supporting Information (Table S1). Complex 2 has no O-O interaction (Mayer bond order of 0.08) and the O atoms are clearly described as oxides. In 1 however, due to the lower electronegativity of S, the S 3pz orbitals are closer in energy to the Cu 3d manifold compared to the O 2pz orbitals. While the crystal structures of 1 and 2 show S-S and an O-O distances of 2.69 Å and 2.4 Å, respectively, the radial component of the O 2pz atomic wave function does not allow for significant orbital overlap between the O atoms. In contrast, the S 3pz orbitals have some overlap, which further destabilizes the S 3pz σ antibonding combination, allowing it to mix with the Cu 3d manifold, and shifting electron density into the Cu centers (Figure 10). This shift in electron density decreases the positive charge on the three Cu centers from formally (3Cu)7+ (as in 2) and partially oxidizes the two sulfur atoms relative to the sulfide limit. The high pre-edge intensity in 1 (see Figure 6) experimentally demonstrates this donation. However, the S K-pre-edge energy position shows that the average effective charge on the Cu centers in 1 is higher than that of a covalent Cu(II) complex, indicating that a full electron transfer to the Cu centers from the S2 moiety has not occurred.
Figure 10.
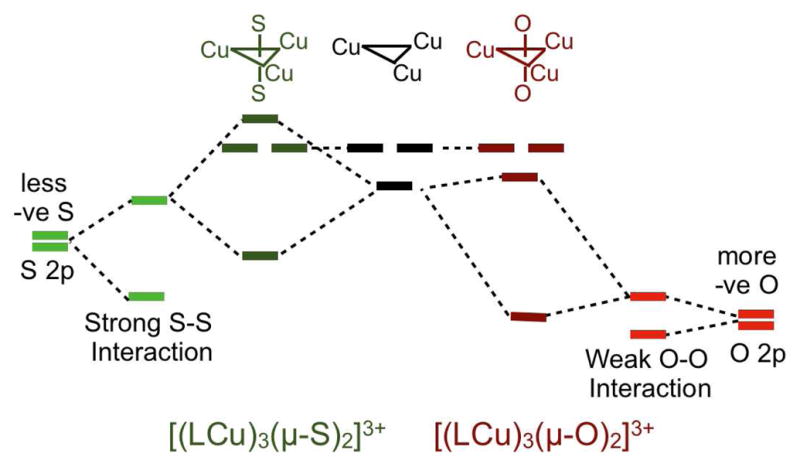
Schematic energy level diagram for the interaction of the three Cu centers with two S’s in 1 and two O’s in D3h [(LCu)3(μ-O)2]3+. −ve indicates negative value.
For further insight into the various electronic structures that have been proposed for 1 (Figure 2), constrained optimizations of 1 were used to explore the different electronic configurations (Figure 7, section 3.3.3). The results show that the S-S bonding description in 1 lies between the disulfide and sulfide limits. In the sulfide limit (A, Figure 2), four holes reside on the copper centers and the S atoms are fully reduced to sulfides, which nonetheless have covalent Cu-S interactions. As the two S atoms are brought closer, the interaction between the two S 3pz orbitals increases. This destabilizes the S-S σ* orbital, which mixes with the Cu 3d manifold and transfers electron density to the copper sites. In the case of a full one-electron transfer to the Cu centers, a subsulfide species would result (B, Figure 2). As the S-S becomes even shorter, the S-S σ antibonding orbital is further destabilized and would become the valence S-S 3pz σ* orbital of a disulfide complex. At this point (the disulfide limit; C, Figure 2), the four holes converge to a set of two S σ* (αβ pair) and two Cu 3dx2 -y2 (+ S 3pπ) orbitals. The combination of XAS, DFT and CASPT2 calculations we have performed show that at the observed S···S distance of 2.69 Å, there is a weak interaction between the two S atoms leading to donation of electron density into the unoccupied Cu 3d orbitals and forming a weak S···S bond, between structures A and B in Figure 2.
As a final note, it is important to be cautious in assigning formal oxidation states to the copper and sulfur centers in 1. As is becoming increasingly apparent in many molecular systems, strong covalency between first-row transition metals and main group elements can lead to a continuum of oxidation states as different supporting ligands result in varying degrees of polarization across highly covalent bonds.17,46,54 For quantifying the bonding description experimentally one must use well-defined reasonable reference systems, which are themselves not rigorously of integral charge. Moreover, computationally the charges are dependent on the population analysis utilized. It is with these caveats in mind that we describe the electronic structure of 1 as “between A and B”, not in a resonance sense, but in having a significant sulfide to Cu(III) charge transfer covalent contribution relative to A leading to some S-S interaction as well as a significant Cu(II) to subsulfide covalent back donation relative to B leading to the weak S-S interaction.
Supplementary Material
Acknowledgments
SSRL operations are funded by the Department of Energy, Office of Basic Energy Sciences. The SSRL Structural Molecular Biology program is supported by the National Institutes of Health, National Center for Research Resources, Biomedical Technology Program, and the Department of Energy, Office of Biological and Environmental Research. This publication was made possible by Award P41 RR001209 from the National Center for Research Resources (NCRR), a component of the National Institutes of Health (NIH). The research was supported by NIH grants DK-31450 (E.I.S.) and GM-47365 (W.B.T.), NSF grant CHE-0952054 (to C. J. C. and S. K.), and the Director, Office of Basic Energy Sciences, U.S. Department of Energy under Contract No. USDOE/DESC002183 (L. G.).
Footnotes
Supporting Information. The second derivative of the Cu K-edge XAS spectra for 1, [Cu(MNT)2](Bu4N) and [Cu(MNT)2](Bu4N)2, Comparison of select DFT parameters for 1 and 2. The DFT geometry optimized coordinates of 1, 2 (D3h constrained), 2 (fully optimized, C2v) in xyz format. Additional details of CASSCF and CASPT2 calculations. http://pubs.acs.org
References
- 1.Brown EC, York JT, Antholine WE, Ruiz E, Alvarez S, Tolman WB. J Am Chem Soc. 2005;127:13752–13753. doi: 10.1021/ja053971t. [DOI] [PubMed] [Google Scholar]
- 2.(a) York JT, Bar-Nahum I, Tolman WB. Inorg Chim Acta. 2008;361:885–893. doi: 10.1016/j.ica.2007.06.047. [DOI] [PMC free article] [PubMed] [Google Scholar]; (b) Bar-Nahum I, Gupta AK, Huber SM, Ertem MZ, Cramer CJ, Tolman WB. J Am Chem Soc. 2009;131:2812–2814. doi: 10.1021/ja808917k. [DOI] [PMC free article] [PubMed] [Google Scholar]
- 3.Solomon E, Sarangi R, Woertink J, Augustine A, Yoon J, Ghosh S. Acc Chem Res. 2007;40:581–591. doi: 10.1021/ar600060t. and references cited therein. [DOI] [PMC free article] [PubMed] [Google Scholar]
- 4.Zumft WG, Kroneck PMH. Adv Microb Phys. 2007;52:107–227. doi: 10.1016/S0065-2911(06)52003-X.and references cited therein. Pomowski A, Zumft WG, Kroneck PMH, Einsle O. Nature. 2011 doi: 10.1038/nature10332. advance online publication.
- 5.For 1, two of the Cu centers are unique and the third is generated by a 21 screw access, but all of the metal-ligand bond distances are closely similar. An analog of 1 supported by N,N,N′,N′-tetramethylethylenediamine lies on a crystallographic 3-fold axis.
- 6.Cole AP, Root DE, Mukherjee P, Solomon EI, Stack TDP. Science. 1996;273:1848–1850. doi: 10.1126/science.273.5283.1848. [DOI] [PubMed] [Google Scholar]
- 7.Root DE, Henson MJ, Machonkin T, Mukherjee P, Stack TDP, Solomon EI. J Am Chem Soc. 1998;120:4982–4990. [Google Scholar]
- 8.Mealli C, Ienco A, Poduska A, Hoffmann R. Angew Chem Int Ed. 2008;47:2864–2868. doi: 10.1002/anie.200705296. [DOI] [PubMed] [Google Scholar]
- 9.Alvarez S, Hoffmann R, Mealli C. Chem Eur J. 2009;15:8358–8373. doi: 10.1002/chem.200900239. [DOI] [PubMed] [Google Scholar]
- 10.Berry JF. Chem Eur J. 2010;16:2719–2724. doi: 10.1002/chem.200902324. [DOI] [PubMed] [Google Scholar]
- 11.(a) Stiefel EI, Miller KF, Bruce AE, Corbin JL, Berg JM, Hodgson KO. J Am Chem Soc. 1980;102:3624–3626. [Google Scholar]; (b) Laughlin LJ, Eagle AA, George GN, Tiekink ERT, Young CG. Inorg Chem. 2007;46:939–948. doi: 10.1021/ic061213d. [DOI] [PubMed] [Google Scholar]; (c) Beinert H. Eur J Biochem. 2000;267:5657–5664. doi: 10.1046/j.1432-1327.2000.01637.x. [DOI] [PubMed] [Google Scholar]
- 12.Solomon EI, Hedman B, Hodgson KO, Dey A, Szilagyi RK. Coord Chem Rev. 2005;249:97–129. [Google Scholar]
- 13.Cramer CJ, Truhlar DG. Phys Chem Chem Phys. 2009;11:10757–10816. doi: 10.1039/b907148b. [DOI] [PubMed] [Google Scholar]
- 14.Sarangi R, DeBeer George S, Rudd DJ, Szilagyi RK, Ribas X, Rovira C, Almeida M, Hodgson KO, Hedman B, Solomon EI. J Am Chem Soc. 2007;129:2316–2326. doi: 10.1021/ja0665949. [DOI] [PMC free article] [PubMed] [Google Scholar]
- 15.Fujisawa K, Morooka Y, Kitajima N. J Chem Soc, Chem Commun. 1994:623–624. [Google Scholar]
- 16.York JT, Brown EC, Tolman WB. Angew Chem Int Ed. 2005;44:7745–7748. doi: 10.1002/anie.200503134. [DOI] [PubMed] [Google Scholar]
- 17.Sarangi R, York JT, Helton ME, Fujisawa K, Karlin KD, Tolman WB, Hodgson KO, Hedman B, Solomon EI. J Am Chem Soc. 2008;130:676–686. doi: 10.1021/ja0762745. [DOI] [PMC free article] [PubMed] [Google Scholar]
- 18.Yang L, Tehranchi J, Tolman WB. Inorg Chem. 2011;50:2606–2612. doi: 10.1021/ic102449m. [DOI] [PMC free article] [PubMed] [Google Scholar]
- 19.Tenderholt A. Pyspline and QMForge. 2007 [Google Scholar]
- 20.(a) Zabinsky SI, Rehr JJ, Ankudinov A, Albers RC, Eller MJ. Phys Rev B. 1995;52:2995–3009. doi: 10.1103/physrevb.52.2995. [DOI] [PubMed] [Google Scholar]; (b) Mustre de Leon J, Rehr JJ, Zabinsky SI, Albers RC. Phys Rev B. 1991;44:4146–4156. doi: 10.1103/physrevb.44.4146. [DOI] [PubMed] [Google Scholar]; (c) Rehr JJ, Mustre de Leon J, Zabinsky SI, Albers RC. J Am Chem Soc. 1991;113:5135–5140. [Google Scholar]
- 21.George GN. Stanford Synchrotron Radiation Laboratory. Stanford Linear Accelerator Center, Stanford University; Stanford, CA 94309: 2000. [Google Scholar]
- 22.(a) Neese F, Olbrich G. Chem Phys Lett. 2002;362:170–178. [Google Scholar]; (b) Neese F. ORCA: An Ab initio, DFT and Semiempirical Electronic Structure Package, Version 2.6.35. 2008. [Google Scholar]
- 23.(a) Perdew JP. Phys Rev B. 1986;33:8822–8824. doi: 10.1103/physrevb.33.8822. [DOI] [PubMed] [Google Scholar]; (b) Becke AD. Phys Rev A. 1988;38:3098–3100. doi: 10.1103/physreva.38.3098. [DOI] [PubMed] [Google Scholar]
- 24.(a) Neese F. Inorg Chim Acta. 2002;337:181–192. [Google Scholar]; (b) Sinnecker S, Slep LD, Bill E, Neese F. Inorg Chem. 2005;44:2245–2254. doi: 10.1021/ic048609e. [DOI] [PubMed] [Google Scholar]
- 25.(a) Schaefer A, Horn H, Ahlrichs R. J Chem Phys. 1992;97:2571–2577. [Google Scholar]; (b) Schaefer A, Huber C, Ahlrichs R. J Chem Phys. 1994;100:5829–5835. [Google Scholar]
- 26.Sinnecker S, Rajendran A, Klamt A, Diedenhofen M, Neese F. J Phys Chem A. 2006;110:2235–45. doi: 10.1021/jp056016z. [DOI] [PubMed] [Google Scholar]
- 27.Schaftenaar G, Noordik JH. J Comput-Aided Mol Des. 2000;14:123–134. doi: 10.1023/a:1008193805436. [DOI] [PubMed] [Google Scholar]
- 28.DeBeer George S, Petrenko T, Neese F. J Phys Chem A. 2008;112:12936–12943. doi: 10.1021/jp803174m. [DOI] [PubMed] [Google Scholar]
- 29.DeBeer George S, Neese F. Inorg Chem. 2010;49:1849–1853. doi: 10.1021/ic902202s. [DOI] [PubMed] [Google Scholar]
- 30.DeBeer George S, Petrenko T, Neese F. Inorg Chim Acta. 2008;361:965–972. [Google Scholar]
- 31.Frisch MJ, et al. Gaussian 09, revision A.02. 2009. [Google Scholar]
- 32.Zhao Y, Truhlar DG. J Chem Phys. 2006;125:194101. doi: 10.1063/1.2370993. [DOI] [PubMed] [Google Scholar]
- 33.Stoll H, Metz B, Dolg M. J Comp Chem. 2002;23:767–778. doi: 10.1002/jcc.10037. [DOI] [PubMed] [Google Scholar]
- 34.Hehre WJ, Radom L, Schleyer PvR, Pople JA. Ab Initio Molecular Orbital Theory. Wiley; New York: 1986. [Google Scholar]
- 35.(a) Lee C, Yang W, Parr RG. Phys Rev B. 1988;37:785–789. doi: 10.1103/physrevb.37.785. [DOI] [PubMed] [Google Scholar]; (b) Becke AD. J Chem Phys. 1993;98:5648–5652. [Google Scholar]; (c) Stephens PJ, Devlin FJ, Chabalowski CF, Frisch MJ. J Phys Chem. 1994;98:11623–11627. [Google Scholar]
- 36.Zhao Y, Truhlar DG. Theor Chem Acc. 2008;120:215–241. [Google Scholar]
- 37.Carrasco R, Aullón G, Alvarez S. Chem Eur J. 2009;15:536–546. doi: 10.1002/chem.200800914. [DOI] [PubMed] [Google Scholar]
- 38.(a) Douglas M, Kroll NM. Ann Phys. 1974;82:89. [Google Scholar]; (b) Hess BA. Phys Rev A. 1986;33:3742–3748. doi: 10.1103/physreva.33.3742. [DOI] [PubMed] [Google Scholar]
- 39.(a) Roos BO, Lindh R, Malmqvist P-Å, Veryazov V, Widmark PO. J Phys Chem A. 2004;108:2851–2858. [Google Scholar]; (b) Roos BO, Lindh R, Malmqvist P-Å, Veryazov V, Widmark PO. J Phys Chem A. 2005;109:6575–6579. doi: 10.1021/jp0581126. [DOI] [PubMed] [Google Scholar]
- 40.Gagliardi L, Lindh R, Karlström G. J Chem Phys. 2004;121:4494–4500. doi: 10.1063/1.1778131. [DOI] [PubMed] [Google Scholar]
- 41.Macchia GL, Aquilante F, Veryazov V, Roos BO, Gagliardi L. Inorg Chem. 2008;47:11455–11457. doi: 10.1021/ic801537w. [DOI] [PubMed] [Google Scholar]
- 42.(a) Roos BO, Borin AC, Gagliardi L. Angew Chem Int Ed. 2007;46:1469–1472. doi: 10.1002/anie.200603600. [DOI] [PubMed] [Google Scholar]; (b) Brynda M, Gagliardi L, Roos BO. Chem Phys Lett. 2009;471:1–10. [Google Scholar]
- 43.(a) Karlström G, Lindh R, Malmqvist P-Å, Roos BO, Ryde U, Veryazov V, Widmark PO, Cossi M, Schimmelpfennig B, Neogrady P, Seijo L. Comput Matl Sci. 2003;28:222–239. [Google Scholar]; (b) Aquilante F, De Vico L, Ferre N, Ghigo G, Malmqvist PA, Neogrady P, Pedersen TB, Pitonak M, Reiher M, Roos BO, Serrano-Andres L, Urban M, Veryazov V, Lindh R. J Comp Chem. 2010;31:224–247. doi: 10.1002/jcc.21318. [DOI] [PubMed] [Google Scholar]
- 44.The second derivative was used to determine the pre-edge energy position.
- 45.(a) Shulman RG, Yafet Y, Eisenberger P, Blumberg WE. Proc Natl Acad Sci. 1976;73:1384–1388. doi: 10.1073/pnas.73.5.1384. [DOI] [PMC free article] [PubMed] [Google Scholar]; (b) Penner-Hahn JE, Scott RA, Hodgson KO, Doniach S, Desjardins SR, Solomon EI. Chem Phys Lett. 1982;88:595–598. [Google Scholar]
- 46.Sarangi R, Aboelella N, Fujisawa K, Tolman WB, Hedman B, Hodgson KO, Solomon EI. J Am Chem Soc. 2006;128:8286–8297. doi: 10.1021/ja0615223. [DOI] [PMC free article] [PubMed] [Google Scholar]
- 47.DuBois JL, Mukherjee P, Stack TDP, Hedman B, Solomon EI, Hodgson KO. J Am Chem Soc. 2000;122:5775–5787. [Google Scholar]
- 48.Kau LS, Spira-Solomon DJ, Penner-Hahn JE, Hodgson KO, Solomon EI. J Am Chem Soc. 1987;109:6433–6442. [Google Scholar]
- 49.The precision of a Cu K-edge XAS spectrum collected on SSRL bio-XAS beamlines 7-3 and 9-3 is greater than 0.05 eV.
- 50.(a) Kosugi N, Yokoyama T, Asakura K, Kuroda H. Chem Phys. 1984;91:249–256. [Google Scholar]; (b) Bair RA, Goddard WA., III Phys Rev B (Cond Matter) 1980;22:2767–2776. [Google Scholar]
- 51.(a) DuBois JL, Mukherjee P, Stack TDP, Hedman B, Solomon EI, Hodgson KO. J Am Chem Soc. 2000;122:5775–5787. [Google Scholar]; (b) Ray K, Debeer George S, Solomon EI, Wieghardt K, Neese F. Chem Eur J. 2007;13:2783–2797. doi: 10.1002/chem.200601425. [DOI] [PubMed] [Google Scholar]
- 52.Rose K, Shadle SE, Eidsness MK, Kurtz DM, Jr, Scott RA, Hedman B, Hodgson KO, Solomon EI. J Am Chem Soc. 1998;120:10743–10747. [Google Scholar]
- 53.Westre TE, Kennepohl P, DeWitt JG, Hedman B, Hodgson KO, Solomon EI. J Am Chem Soc. 1997;119:6297–6314. [Google Scholar]
- 54.Gherman BF, Cramer CJ. Inorg Chem. 2004;43:7281–7283. doi: 10.1021/ic049958b. [DOI] [PubMed] [Google Scholar]
Associated Data
This section collects any data citations, data availability statements, or supplementary materials included in this article.