Abstract
DNA structural deformations and dynamics are crucial to its interactions in the cell. Theoretical simulations are essential tools to explore the structure, dynamics, and thermodynamics of biomolecules in a systematic way. Molecular mechanics force fields for DNA have benefited from constant improvements during the last decades. Several studies have evaluated and compared available force fields when the solvent is modeled by explicit molecules. On the other hand, few systematic studies have assessed the quality of duplex DNA models when implicit solvation is employed. The interest of an implicit modeling of the solvent consists in the important gain in the simulation performance and conformational sampling speed. In this study, respective influences of the force field and the implicit solvation model choice on DNA simulation quality are evaluated. To this end, extensive implicit solvent duplex DNA simulations are performed, attempting to reach both conformational and sequence diversity convergence. Structural parameters are extracted from simulations and statistically compared to available experimental and explicit solvation simulation data. Our results quantitatively expose the respective strengths and weaknesses of the different DNA force fields and implicit solvation models studied. This work can lead to the suggestion of improvements to current DNA theoretical models.
Keywords: DNA, force fields, implicit solvation, molecular dynamics, Generalized Born
Introduction
Deoxyribonucleic acid (DNA) is the molecule carrying the genetic information, which is translated into proteins by living cells, using a code almost universally conserved among living systems. DNA is involved in many dynamic processes like gene expression and regulation, or genetic replication and recombination. DNA molecule structural plasticity is critical in many of these mechanisms, including protein or cofactor recognition, chromatin remodelling, and transcription. Understanding DNA structural deformations and dynamics is thus essential to study important components of living systems.
Experimental techniques like X-ray crystallography, NMR spectroscopy, or single molecule experiments greatly contribute to our increasing knowledge of the DNA molecule properties. Theoretical simulations are complementary techniques, useful to investigate structure, dynamics and thermodynamics of biomolecules in a systematic way, in particular when experimental data is not available or accessible. The first molecular dynamics simulations of DNA were performed in 19831,2 in vacuo, and two years later with explicit water molecules and counterions3. DNA molecular mechanics models have thus benefited from almost three decades of force field and algorithmic improvements4–12 and have been applied to a wide variety of questions13–21.
A number of systematic studies have attempted to evaluate DNA molecular mechanics models22–29. Only the most recent works are described here. In a collaborative work initiated by the “Ascona B-DNA Consortium”, the 136 unique tetranucleotide duplexes were studied by molecular dynamics. Simulations were performed during 15 ns, using the AMBER parm94 force field, with an explicit solvation model, on 39 oligomers of 15 bp length containing the tetranucleotides. Methodological questions are addressed in a first paper25, and sequence context effects on the DNA structure are discussed in a second paper26. The authors observed structural substates distinct from the B-form. These states are largely controlled by the backbone conformation, which in turn is strongly correlated to helicoidal parameters. The effect of flanking base pairs on a dinucleotide was found to be limited for YpR steps although they are more flexible, and more significant for RpR and RpY steps, which are more rigid. Another study by Fujii et al.27 concentrated on the sequence-dependence of DNA deformability. Molecular dynamics simulations of 10 ns length in aqueous environment were performed on 12 bp duplexes, comprising the 136 tetramers sandwiched between CGCG sequences. The AMBER parm99 force field was used. The authors showed that the deformability of dimeric steps is consistent with crystal structure data, and can be affected by flanking base pairs. Orozco and co-workers28 conducted a systematic study of B-DNA flexibility with CHARMM all27 and AMBER parmbsc0 force fields. They performed 100 ns molecular dynamics simulations in explicit solvent environment on four different 18 bp sequences, chosen to contain the 10 unique dinucleotide base pair steps. This study highlighted some differences between parmbsc0 and all27 force fields, yet the authors concluded that today DNA force fields have matured, leading to a consensus view of B-DNA flexibility. A continuation of the Ascona consortium effort was recently published29. This work investigated nearest-neighbor effects on B-DNA base pairs and base pair steps. A number of 39 oligomers containing all unique tetranucleotides, each of 18 base pair length, were subjected to 50 or 100 ns molecular dynamics simulations in explicit solvation, with the parmbsc0 force field. The authors concluded that simulations were converged in terms of most B-DNA conformational properties. Sequence effects were found to be small at the base or base pair level, more important at the tri- or tetranucleotide level, and could still be significant beyond the nearest-neighbor level.
Solvent modelling is critical in DNA simulations. With an improper solvation model, DNA strand separation can easily be observed. While explicit modeling of solvent molecules provide the most realistic results, the cost of such approaches is high as an important portion of computer time is spent in simulating bulk solvent molecule dynamics. Implicit solvation models attempt to represent solvent as a continuous medium and capture effects on the solute in an average way. The interest of implicit solvation models lies in reduced computational cost, reduced statistical error, faster conformational sampling, clearer physical insights, and the possibility of modelling big systems like chromatine or systems with large conformational changes. An important class of implicit solvation models are methods based on continuum electrostatics where the electrostatic component of the solvation free energy is obtained by solving the Poisson-Boltzmann equation (PB). The Generalized Born model30 (GB) is a computationally efficient approximation of PB, suitable for molecular dynamics simulations. Several GB variants have been implemented in molecular mechanics programs, mostly differing by the way effective Born radii are calculated. Some GB methods are based on the pairwise descreening formulation of Hawkins, Cramer, and Truhlar31–39, others approximate the solute volume by overlapping Gaussian functions40,41, while others calculate Born radii by analytical volume integration42–44. Performance comparisons of several GB implementations are available45–47.
GB implicit solvation models have been widely applied48–51 in particular to proteins, and to a lesser extent to nucleic acids36,52–56. Srinivasan et al.52 conducted PB and GB calculations on snapshots extracted from explicit solvent molecular dynamics simulations of DNA, phosphoramidate-modified DNA, and RNA decamers in A- or B-form. Free energy estimations confirmed that the B-form is preferred for DNA and the A-form for RNA and phosphoramidate-modified DNA, and that salt inclusion modestly favors A-form. In another work, Srinivasan et al.53 performed PB and GB calculations on multiple conformations of proteins, 10–12 bp DNA duplexes and a RNA hairpin. Good agreement is found between GB and PB solvation energies and salt contributions. Tsui and Case36,54 have simulated 10 bp DNA and RNA duplexes in A- and B-forms by molecular dynamics with GB implicit solvation and obtained good agreement with explicit solvent simulations both in terms of structures and energetics. The authors also showed that DNA in A-form converges to B-form about 20 times faster with GB than with explicit solvation. Chocholoušová and Feig55 have performed molecular dynamics simulations with GB implicit solvation on the DNA Drew-Dickerson dodecamer and a protein-DNA complex. The authors demonstrated that stable and realistic DNA simulations can be obtained, agreement being either closer to explicit solvation results or experimental data, depending on the atomic radii set chosen. Partial transitions to A-DNA could be observed when 1 M salt is added. Molecular dynamics simulations with GB implicit solvation have also been applied to bigger nucleic acid assemblies such as nucleosomal DNA56. To our knowledge, there is no systematic evaluation of DNA simulations in implicit solvation published to date.
In this work, we intend to evaluate DNA molecular mechanics models with Generalized Born implicit solvents against explicit solvation results and experimental data. Different force fields and implicit solvation methods are implemented and customarily used with different molecular mechanics programs, like CHARMM or AMBER. We need to be able to use any combination of force field and implicit solvation variant to investigate the respective influence of both on results. We concentrate on two recent and widely used DNA force fields (AMBER parmbsc0 and CHARMM all27) and five Generalized Born variants (GBhct, GBobc1, GBobc2, and GBn implemented in AMBER; and GBMV implemented in CHARMM). Molecular dynamics simulations are conducted on several DNA duplex sequences and care is taken that both simulation length and sequence diversity convergence are achieved. Several structural parameters are then measured and statistically compared to both explicit solvation results and experimental data.
Methods
Starting structures
DNA duplexes of 12 base pair length with different sequences corresponding to the 5′-CGCGWXYZCGCG-3′/5′-CGCGZ̄ȲX̄W̄CGCG-3′ pattern were studied, where WXYZ/Z̄ȲX̄W̄ are tetramer duplexes located at the center, and flanked by C-G base pairs. The overline symbol designates the complementary nucleotide. There are 256 combinations of nucleotide tetramers, but only 136 unique tetramer duplexes (for example AAAA/TTTT and TTTT/AAAA cannot be distinguished). Starting coordinates were built with the NAB program distributed with the AMBER suite57, using Arnott B-DNA fiber diffraction data58.
AMBER prmtop and inpcrd files were generated with the leap program, using the parmbsc0 force field12. CHARMM psf and crd files were generated with the CHARMM program59 using the all2711 force field. “CHAMBER” (CHARMM force field with the AMBER program) prmtop and inpcrd files were generated with the CHAMBER conversion program60 distributed with the AMBER suite, from CHARMM psf and crd files, and the all27 rtf and prm files. Differences between CHAMBER and CHARMM energies in vacuo with an infinite cutoff were less than 5 × 10⁻⁴ kcal.mol−1. “AMBARMM” (AMBER force field with the CHARMM program) psf and crd files were generated with the CHARMM program compiled with the AMBER keyword to be consistent with AMBER conversion factors and using the parmbsc0 force field converted to CHARMM format by Jeff Klauda (http://terpconnect.umd.edu/~jbklauda/research/download.html). Differences between AMBARMM and AMBER energies in vacuo with an infinite cutoff were less than 3 × 10⁻³ kcal.mol−1.
Molecular dynamics
Molecular dynamics simulations with AMBER and CHARMM programs were done with a Generalized Born implicit solvation model, using an infinite cutoff for non-bonded interactions, dielectric constants of 78.5 for the solvent and 1 for DNA interior, and an inverse Debye-Hückel length of 0.1 Å−1 to account for 0.1 M salt concentration. Minimization was first performed during 200 steps with 5 kcal.mol−1.Å−2 harmonic restraints on non-hydrogen atoms. Langevin dynamics was then carried out using a heat bath at 300 K, a collision frequency of 5 ps−1, a 1 fs timestep, and the SHAKE algorithm to restrain the elongation of bonds involving hydrogen atoms. Three equilibration phases of 50 ps were performed with decreasing harmonic restraints on non-hydrogen atoms of 5, 1, and 0.1 kcal.mol−1.Å−2, respectively. The production phase of 5 ns was then run without restraints. Simulations with the AMBER program employed GBhct31,32 GBobc137,38 GBobc238, or GBn39 Generalized Born model variants. Simulations with the CHARMM program employed the GBMV implicit solvation model42,43, with the 1/r7 Coulomb field correction and parameters C0 = −0.1, C1 = 0.9, β = −12, and S0 = 0.65, as in Chocholoušová and Feig55,61. Recommended atomic radii set for each GB model variant were used (mbondi36 for GBhct, mbondi238 for GBobc1 and GBobc2, bondi62 for GBn, and van der Waals radii for GBMV).
Analysis
Structural data were collected from the 5 ns molecular dynamics trajectories of the 136 CGCGWXYZCGCG duplex sequences, each trajectory containing 5.000 frames. Combinations of two force fields (AMBER parmbsc0 and CHARMM all27) and five GB implicit solvation models (AMBER GBhct, GBobc1, GBobc2, GBn, and CHARMM GBMV) led to a total simulation time of 6.8 µs, and a number of 6.8 ×10⁶ frames.
Trajectories were analyzed with the ptraj program of the AMBER suite57 for root-mean-square deviations (RMSD) calculations, and structural parameters63 were evaluated with the 3DNA program64,65. Parameter measurements were done on the central XY/ȲX̄ dimer and included base pair step parameters (Shift, Slide, Rise, Tilt, Roll, Twist), groove widths (minor and major), sugar conformational parameters (amplitude and phase angle of ring pseudorotation), backbone and glycosidic torsion angles (α, β, γ, δ, ε, ζ, χ). Only structures with correct Watson-Crick pairing at the central dimer, as defined by 3DNA, were considered.
The dataset was then symmetrized by duplicating each entry with parameter values that would have been measured if the other strand was chosen as “leading strand”. This is necessary because some structural parameters (Shift and Tilt) have their sign dependent on the choice of the duplex leading strand, which is arbitrary. Structural parameter global averages, standard deviations, and probability density functions were then calculated over the whole dataset, using a weighting to correct for sequence composition bias and ensure equal representation to each of the ten unique dimer steps (AA/TT, AT/AT, AG/CT, AC/GT, TA/TA, TG/CA, TC/GA, GG/CC, GC/GC, CG/CG). Dimer level averages, standard deviations, and probability density functions were also calculated over subsets corresponding to each of the ten unique dimer steps. The probability density function was approximated by a kernel density estimation, using a Gaussian function as the kernel. Periodicity was taken into account when calculating statistics of angular parameters.
Experimental data
Experimental structural data were extracted from the Protein Data Bank66 and Nucleic Acid Database67. The 3DNA Landscapes platform68 (http://3dnascapes.rutgers.edu) was employed to obtain PDB/NDB codes of DNA containing structures. A list of X-ray structures with a resolution better than 2 Å was retrieved, as well as a separate list of NMR structures. Structures were then downloaded and analyzed with the 3DNA program. Unwanted structures were discarded according to following criteria: dimer steps retained in the dataset were those containing only A, T, G, or C nucleotides; with correct Watson-Crick pairing; flanked by A, T, G, or C nucleotides; and belonging to a right-handed duplex structure. Further filtering excluded A-DNA (zP > 1.5 Å) and TA-DNA (zP(h) > 4.0 Å) structures, as in Lu and Olson64. The number of dimer steps available in the experimental dataset is given in Table 1. Statistical analysis of experimental data was conducted as for implicit solvation MD data.
Table 1.
Amount of dimer steps available in experimental data. NMR and X-ray (resolution better than 2 Å) structures are extracted from the Protein Data Bank. Dimer steps retained in the dataset were those containing only A, T, G, or C nucleotides, with correct Watson-Crick pairing, flanked by A, T, G, or C nucleotides, and corresponding to a right-handed B-DNA duplex structure.
| Exp. | NMR | X-ray |
|---|---|---|
| all | 2788 | 3018 |
| AA | 388 | 476 |
| AT | 200 | 273 |
| AG | 338 | 270 |
| AC | 343 | 303 |
| TA | 172 | 187 |
| TG | 351 | 341 |
| TC | 353 | 420 |
| GG | 249 | 266 |
| GC | 206 | 238 |
| CG | 188 | 244 |
Explicit solvation simulation data
Structural data were also obtained from molecular dynamics simulations in explicit solvation performed by Orozco and co-workers28. The 100 ns trajectories of four different sequences simulated with both CHARMM all27 and AMBER parmbsc0 force fields were downloaded (http://mmb.pcb.ub.es/~raist/CONSENSUS/) and uncompressed as explained in the article. Each of the eight trajectories contained about 105 frames, of which one every ten frames was extracted and analyzed with the 3DNA program. Every dimer steps with correct Watson-Crick pairing and not at the extremities of the duplex to avoid end effects were kept in the dataset. Statistical analysis of the dataset was then performed as for implicit solvation MD data.
Results
DNA structural parameters statistics, obtained from molecular dynamics simulations with different force fields and Generalized Born implicit solvation methods are presented and compared to experimental X-ray and NMR data, as well as to published explicit solvation simulation data. Validity of simulations and methodological robustness are first discussed. Detailed examination of selected structural parameter statistics is then provided.
Validity of simulations
Watson-Crick pairing
Watson-Crick pairing percentage was calculated for each simulation as a measure of DNA duplex structure conservation (Table 2). This was obtained as the ratio of frames for which a correct pairing of the central dimer was detected by the 3DNA program, to the total number of frames simulated. Percentages are then averaged over the 136 sequences simulated with each force field and GB method combination. Percentages calculated over subsets corresponding to the ten different central dimer types are also provided. Examination of trajectories shows that strands get irreversibly separated after about 500 ps of simulation when the GBn method is employed, thus explaining the low percentages (around 10%) found with GBn. This method is indeed not recommended for nucleic acid simulations by its authors39 and will not be considered in analyses. In all other simulations, Watson-Crick pairing percentages were always higher than 98.5% in average. The AMBER parmbsc0 force field gave slightly higher percentages than CHARMM all27 in general. GBMV gave the best overall pairing conservation among GB methods, while GBobc1 had the lowest percentages. Limited variations were observed between different types of central dimer.
Table 2.
Watson-Crick pairing percentages of the central dimer in MD simulations. Percentages are obtained as the ratio of frames with correct Watson-Crick pairing at the central dimer, as measured by the 3DNA program, to the total number of trajectory frames. They are calculated for all frames as well as over subsets corresponding to each of the 10 unique dimer steps.
| FF Solv. |
parmbsc0 |
all27 |
||||||||
|---|---|---|---|---|---|---|---|---|---|---|
| GBhct | GBobc1 | GBobc2 | GBn | GBMV | GBhct | GBobc1 | GBobc2 | GBn | GBMV | |
| all | 99.73 | 99.72 | 99.89 | 14.99 | 99.99 | 99.42 | 98.66 | 99.34 | 7.95 | 99.70 |
| AA | 99.38 | 99.76 | 99.95 | 4.58 | 100.00 | 99.92 | 99.27 | 99.71 | 4.60 | 99.99 |
| AT | 99.95 | 99.76 | 99.96 | 4.15 | 100.00 | 99.91 | 98.78 | 99.57 | 4.40 | 99.92 |
| AG | 99.83 | 99.79 | 99.87 | 12.21 | 99.99 | 99.56 | 99.03 | 99.49 | 8.56 | 99.61 |
| AC | 99.79 | 99.60 | 99.89 | 12.75 | 100.00 | 99.22 | 98.13 | 98.99 | 6.89 | 99.11 |
| TA | 99.63 | 99.70 | 99.99 | 3.29 | 100.00 | 99.57 | 99.29 | 99.54 | 4.92 | 99.73 |
| TG | 99.69 | 99.67 | 99.77 | 11.70 | 99.99 | 99.50 | 98.70 | 99.47 | 8.19 | 99.68 |
| TC | 99.90 | 99.78 | 99.85 | 11.69 | 99.99 | 99.61 | 99.14 | 99.67 | 7.18 | 99.98 |
| GG | 99.74 | 99.73 | 99.86 | 33.50 | 99.95 | 98.52 | 97.40 | 98.61 | 10.21 | 99.39 |
| GC | 99.88 | 99.86 | 99.97 | 27.41 | 99.99 | 99.33 | 98.86 | 99.40 | 14.32 | 99.89 |
| CG | 99.50 | 99.58 | 99.83 | 30.76 | 99.99 | 99.18 | 98.21 | 99.01 | 11.42 | 99.96 |
Root mean square deviations
Root mean square deviations of heavy atoms with respect to the initial conformation were calculated for the different simulations, taking into account either the whole duplex or only the central dimer step (Table 3). RMSD values given are obtained by conformational averaging over the course of simulations and sequential averaging over the 136 sequences simulated with each force field and GB variant. Except GBn for which strand separation occurs, RMSD calculated on the whole 12 bp duplex ranged from 2.7 to 4.3 Å in average, and from 0.8 to 1.2 Å when only the central dimer is considered. Slightly higher values are in general obtained with the parmbsc0 force field. The GB method choice influences RMSD in a consistent way between both force fields, namely GBobc1>GBobc2>GBhct≈GBMV. The highest RMSD being obtained with GBobc1 then GBobc2, and the lowest values with the GBMV method with both force fields, or with the all27+GBhct combination. It should be noted that structural measurements in analysis are done exclusively on the central dimer, results will thus not be directly affected by deformations at the extremities of the duplex. Another remark is that initial structures are not necessarily considered as a reference in this work, where we assess the validity of GB simulations with respect to explicit solvation simulation and experimental data. Initial structures are indeed ideal B-DNA structures based on fiber diffraction data, which are not taking into account sequence effects on backbone conformation.
Table 3.
Heavy-atom root mean squared deviation (Å) averages with respect to initial conformation. RMSD are calculated on the whole 12 bp duplex as well as on the central dimer only, and averaged over trajectories of the 136 sequences simulated.
| FF | GB | duplex | central dimer |
|---|---|---|---|
| parmbsc0 | GBhct | 3.45 | 1.13 |
| parmbsc0 | GBobc1 | 4.26 | 1.21 |
| parmbsc0 | GBobc2 | 4.08 | 1.17 |
| parmbsc0 | GBn | 15.89 | 9.41 |
| parmbsc0 | GBMV | 2.85 | 0.92 |
| all27 | GBhct | 2.68 | 0.86 |
| all27 | GBobc1 | 3.82 | 0.96 |
| all27 | GBobc2 | 3.58 | 0.91 |
| all27 | GBn | 17.77 | 11.43 |
| all27 | GBMV | 2.98 | 0.77 |
Convergence and robustness
Convergence and robustness of results were assessed by several preliminary tests, employing energy minimizations or molecular dynamics. It was found that DNA structural parameters were mostly converged with respect to simulation time (5 ns), sequence diversity (136 unique duplex tetramers), and duplex length (12 bp). Results were in general not significantly sensible to the choice of the starting conformation, salt concentration in the reasonable range, or GB radii set.
Structural parameters
Structural parameter averages are given in Table 4. Base pair step, groove width, backbone and glycosidic torsions, and sugar puckering parameters are discussed in detail, based on comparison of averages and whole probability distributions. Most of the time, distributions are close to Gaussian shape and averages are a good approximation of the maximum of probability. As a general pattern, we first compare NMR to X-ray data, then force fields to experimental data, and at last GB implicit solvation methods to explicit solvation.
Table 4.
Structural parameter averages. Structural parameters are measured with the 3DNA program on the central dimer and averaged over trajectories of the 136 sequences simulated. Global averages are obtained by applying a weighting to ensure equal composition of the ten unique dimer steps. Angular parameters periodicity is taken into account. Parameter averages from experimental data and explicit solvation simulations of Orozco and co-workers28 are calculated following the same protocol. Averages are given in Å for translational step parameters and groove widths, and in degrees for angular parameters.
| FF Solv. |
NMR | X-ray | parmbsc0 |
all27 |
||||||||
|---|---|---|---|---|---|---|---|---|---|---|---|---|
| expl. | GBhct | GBobc1 | GBobc2 | GBMV | expl. | GBhct | GBobc1 | GBobc2 | GBMV | |||
| Shift | 0.00 | 0.00 | 0.00 | 0.00 | 0.00 | 0.00 | 0.00 | 0.00 | 0.00 | 0.00 | 0.00 | 0.00 |
| Slide | −0.38 | −0.02 | −0.40 | −0.95 | −1.12 | −1.04 | −0.52 | −0.02 | −0.28 | −0.38 | −0.40 | −0.08 |
| Rise | 3.33 | 3.34 | 3.34 | 3.48 | 3.51 | 3.42 | 3.35 | 3.36 | 3.50 | 3.61 | 3.53 | 3.39 |
| Tilt | 0.00 | 0.00 | 0.00 | 0.00 | 0.00 | 0.00 | 0.00 | 0.00 | 0.00 | 0.00 | 0.00 | 0.00 |
| Roll | 2.33 | 2.45 | 3.59 | 3.75 | 5.53 | 6.28 | 4.67 | 5.60 | 4.60 | 6.50 | 6.97 | 7.69 |
| Twist | 33.87 | 34.10 | 32.44 | 30.96 | 29.65 | 30.25 | 32.70 | 34.15 | 33.50 | 32.09 | 32.44 | 34.40 |
| Minor | 13.2 | 12.7 | 13.0 | 13.2 | 14.1 | 14.0 | 12.7 | 13.8 | 13.3 | 14.4 | 14.4 | 14.4 |
| Major | 18.1 | 18.3 | 19.3 | 21.8 | 22.7 | 21.9 | 19.1 | 17.1 | 18.8 | 19.7 | 19.2 | 15.7 |
| α | −64.7 | −55.6 | −73.6 | −69.5 | −69.9 | −69.8 | −68.5 | −59.9 | −60.1 | −61.4 | −61.7 | −60.6 |
| β | 179.4 | 172.0 | 169.7 | 173.0 | 172.7 | 172.2 | 170.4 | 168.0 | 171.7 | 172.5 | 173.1 | 172.1 |
| γ | 53.5 | 46.2 | 55.6 | 57.4 | 57.5 | 57.4 | 58.3 | 51.7 | 52.3 | 52.0 | 51.8 | 50.2 |
| ε | −177.6 | −166.2 | −162.1 | −171.5 | −172.1 | −172.5 | −170.5 | −166.6 | −169.7 | −168.9 | −169.8 | −169.6 |
| ζ | −99.5 | −109.0 | −102.3 | −94.4 | −90.8 | −90.6 | −93.1 | −108.0 | −106.8 | −105.0 | −103.4 | −100.9 |
| χ | −114.4 | −110.9 | −117.2 | −123.6 | −125.7 | −124.7 | −122.4 | −112.3 | −111.8 | −111.4 | −111.8 | −113.9 |
| P | 145.0 | 145.0 | 133.2 | 125.1 | 120.4 | 122.0 | 126.4 | 143.9 | 146.1 | 145.2 | 146.7 | 146.5 |
| τm | 33.7 | 36.0 | 33.9 | 37.7 | 37.6 | 37.3 | 35.3 | 35.1 | 39.4 | 39.5 | 38.8 | 37.6 |
Base pair step parameters
Base pair step parameters describe the geometry of one base pair with respect to the next one. There are three translational base pair step parameters (Shift, Slide, Rise), and three rotational parameters (Tilt, Roll, Twist). Shift and Tilt parameters, presenting a sign inversion depending on the choice of the leading strand of the duplex, have an average value of zero by construction and will not be discussed in detail here.
Slide
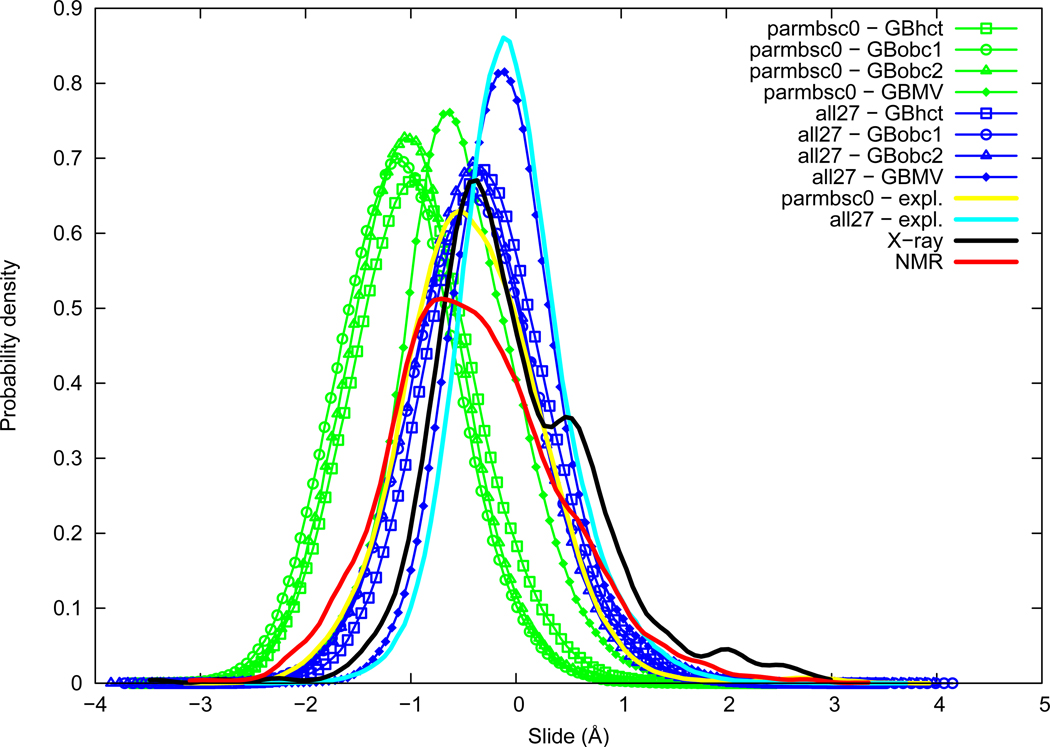
Slide distributions are given in Figure 1. The slide average appears noticeably lower in NMR data (−0.38 Å) compared to X-ray data (−0.02 Å). The difference in average value between NMR and X-ray is partly explained by a secondary peak around 0.5 Å in the X-ray distribution, which otherwise has a maximum of probability around −0.40 Å, thus close to NMR average value. Sequence variability is important in experimental Slide distributions and the X-ray peak at 0.5 Å is mostly contributed by CG and GC steps. Slide average obtained with the AMBER parmbsc0 force field in explicit solvation (−0.40 Å) is close to NMR in average, whereas the CHARMM all27 force field (−0.02 Å) is closer to X-ray. However when considering the maximum of probability, Slide is lightly overestimated with the all27 force field. We have thus NMR≈parmbsc0<X-ray<all27. The GB method influence is consistent between the two force fields, with a general underestimation of the Slide parameter, compared to explicit solvation. GBobc1 and GBobc2 are the most affected, then GBhct, and GBMV is the closest to explicit solvation; namely GBobc1≈GBobc2<GBhct<GBMV<explicit. Distributions obtained from simulations are close to Gaussian shape. We see here that structural deformations resulting from the GB method choice can be of comparable magnitude as force field differences. Another point is that the GB method effect is here relatively independent of the force field.
Figure 1.
Slide probability distribution. Structural parameters are measured with the 3DNA program on the central dimer over trajectories of the 136 sequences simulated. Distributions are obtained from series with a kernel density estimation, using Gaussian functions as kernel. A weighting is applied to ensure equal composition of the ten unique dimer steps. Angular parameters periodicity is taken into account. Parameter distributions from experimental data and explicit solvation simulations of Orozco and co-workers28 are calculated following the same protocol.
Rise
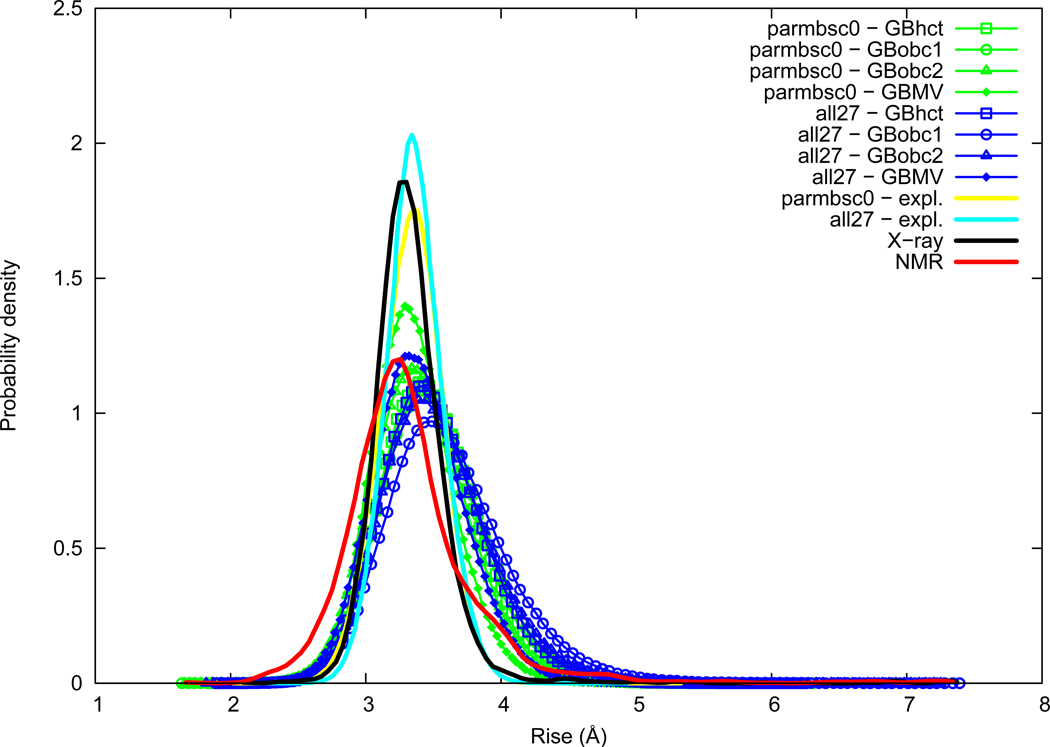
Rise distributions are given in Figure 2. Rise average is very close between NMR (3.33 Å) and X-ray (3.34 Å). The maximum of probability is however slightly smaller in NMR (around 3.23 Å) compared to X-ray (around 3.27 Å). Both force fields in explicit solvation are very close in average to experimental data (3.34 Å for parmbsc0 and 3.36 Å for all27), but slightly higher in terms of maximum of probability, namely NMR<X-ray<parmbsc0≈all27. The AMBER GB methods (GBhct, GBobc1, and GBobc2) slightly overestimate Rise, in particular GBobc1, whereas CHARMM GBMV method is close to explicit solvation; namely explicit≈GBMV<GBhct≈GBobc2<GBobc1. Compared to Slide, both GB method and force field effects are of lower relative importance for Rise.
Figure 2.
Rise probability distribution. See Figure 1 legend.
Roll
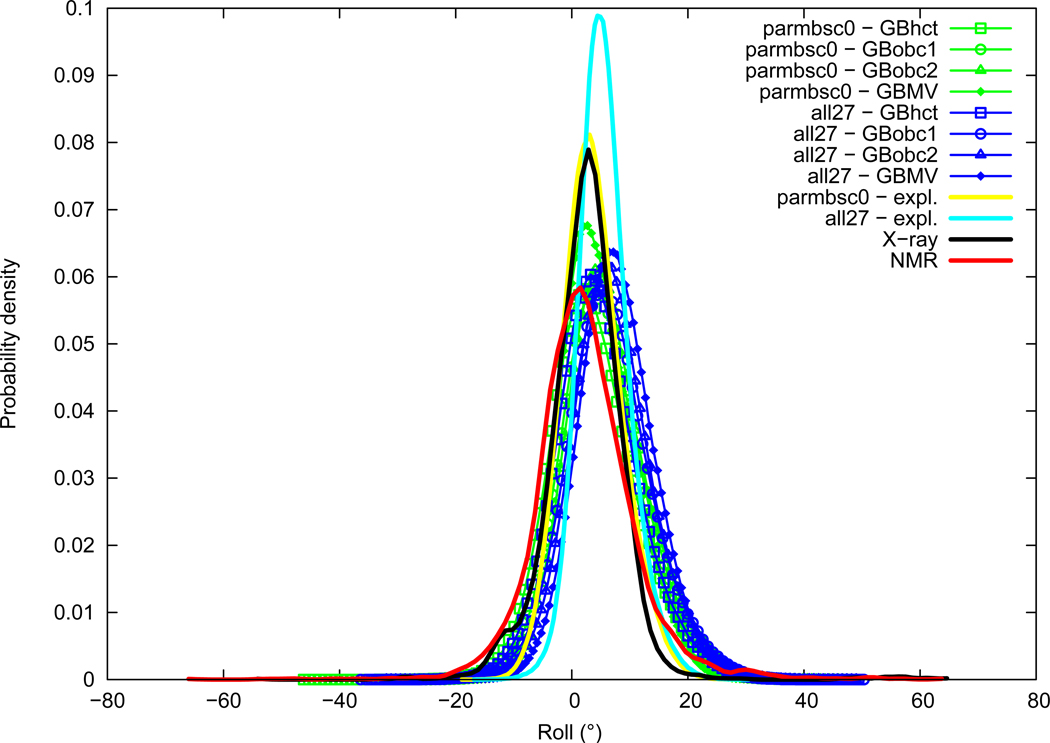
Roll distributions are given in Figure 3. The roll average is slightly lower for NMR (2.33°) compared to X-ray (2.45°). Both force fields appear over-rolled, in particular the all27 force field (5.60°) while the parmbsc0 force field (3.59°) is closer to experimental values. Looking at the distributions indicate that parmbsc0 is in very good agreement with X-ray, with a maximum of probability around 2.8°, we have then NMR<X-ray≈parmbsc0<all27. The influence of the GB method choice on Roll is limited and GB results stay within the range of force field or experimental data differences. We note however that among the three AMBER implementations, GBobc1 and GBobc2 give slightly higher Roll than GBhct. The effect of GBMV is not clear as it increases Roll with all27 but stays in good agreement with explicit solvation when used with parmbsc0.
Figure 3.
Roll probability distribution. See Figure 1 legend.
Twist
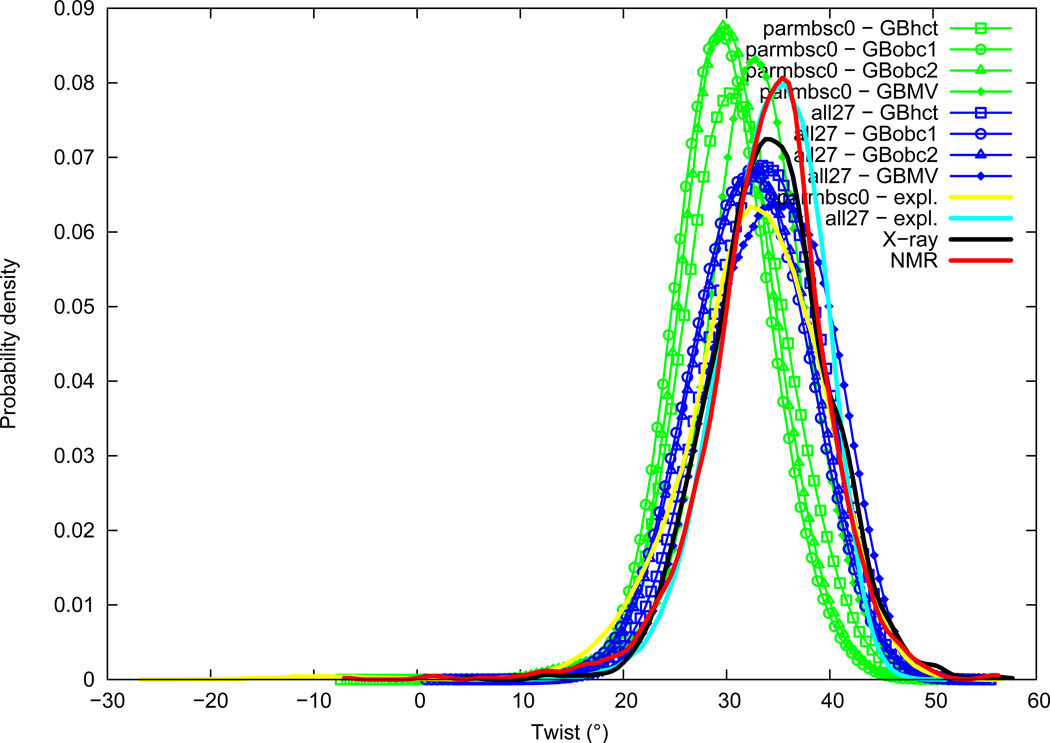
Twist distributions are given in Figure 4. Twist average is close between NMR (33.87°) and X-ray (34.10°). The parmbsc0 force field is markedly under-twisted (32.44°), whereas the all27 force field is closer to experimental values (34.15°). Maximum of probability confirms this trend with about 35.4° for NMR, 34.1° for X-ray, 32.5° for parmbsc0, and 35.4° for all27; we have thus parmbsc0<X-ray≈NMR≈all27. The GB method influence on Twist is consistent between the two force fields. AMBER GB methods lead to a significant Twist lowering, until modal values around 29.4° for parmbsc0+GBobc1, whereas GBMV is close to explicit solvation values; namely we find GBobc1<GBobc2<GBhct<explicit≈GBMV. Both force field and GB method effects are thus important for Twist.
Figure 4.
Twist probability distribution. See Figure 1 legend.
Groove widths
Groove widths at the central dimer step are calculated as the average of interstrand distances P7-p4 and P8-p5 for the minor groove, and as the P4-p8 distance for the major groove, where Pi is the ith phosphate atom of strand I counting from the 5′ extremity, and pj is the jth phosphate of strand II counting from the 3′ extremity, as in El Hassan and Calladine69.
Minor groove
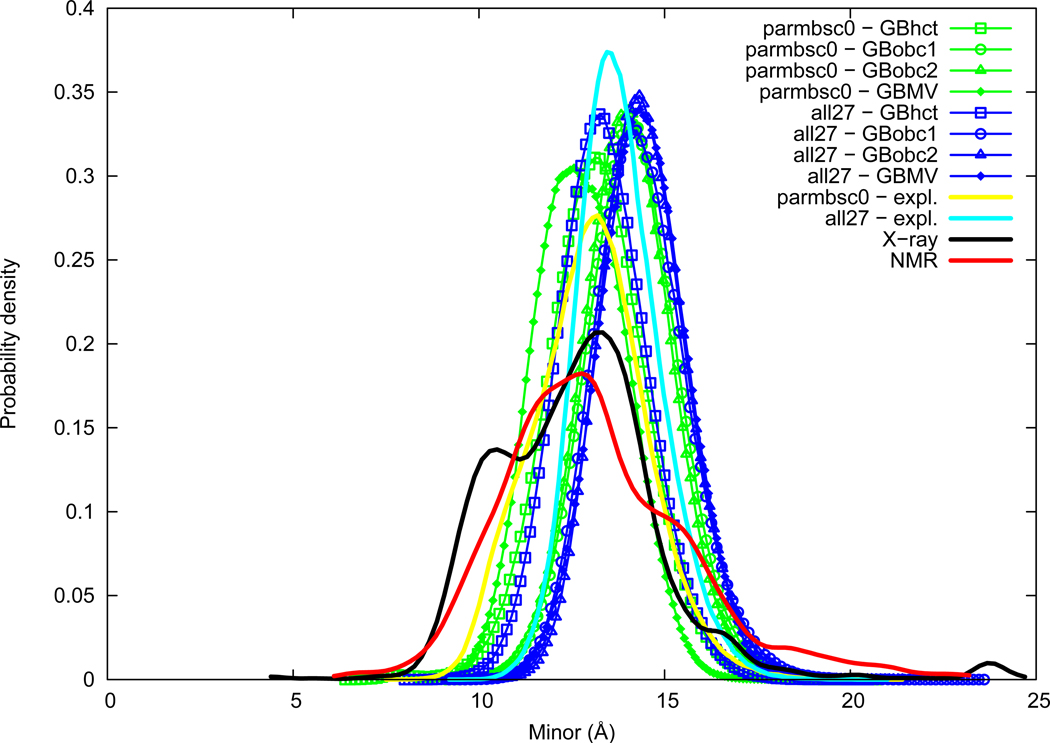
Minor groove width distributions are given in Figure 5. Experimental distributions have a broad shape and present some differences, but averages are of the same order (13.2 Å for NMR, 12.7 Å for X-ray), as well as maxima of probability (12.8 Å for NMR, 13.2 Å for X-ray). A secondary peak is present in X-ray data at about 10.4 Å, mostly contributed by TG, AT, and AG dimer steps. A shoulder is observed in NMR data around 15 Å, partly contributed by the GC step. These differences in experimental distributions are probably reflective of lack of data at the underlying dimer level, however convergence seems quite reasonable at the global level, as indicated by the proximity of NMR and X-ray averages and maxima of probability. The parmbsc0 force field with explicit solvation lies in the experimental range (13.0 Å), whereas the all27 force field gives a lightly wider minor groove (13.8 Å), we have thus X-ray≈parmbsc0≈NMR<all27. GBobc1 and GBobc2 methods tend to increase minor groove width with both force fields. GBhct is the closest to explicit solvation with the two force fields, in good agreement with parmbsc0 and slightly lower with all27. GBMV influence is not consistent between both force fields, leading to slightly lower values than explicit solvation with parmbsc0, and overestimated values with all27.
Figure 5.
Minor groove width probability distribution. See Figure 1 legend.
Major groove
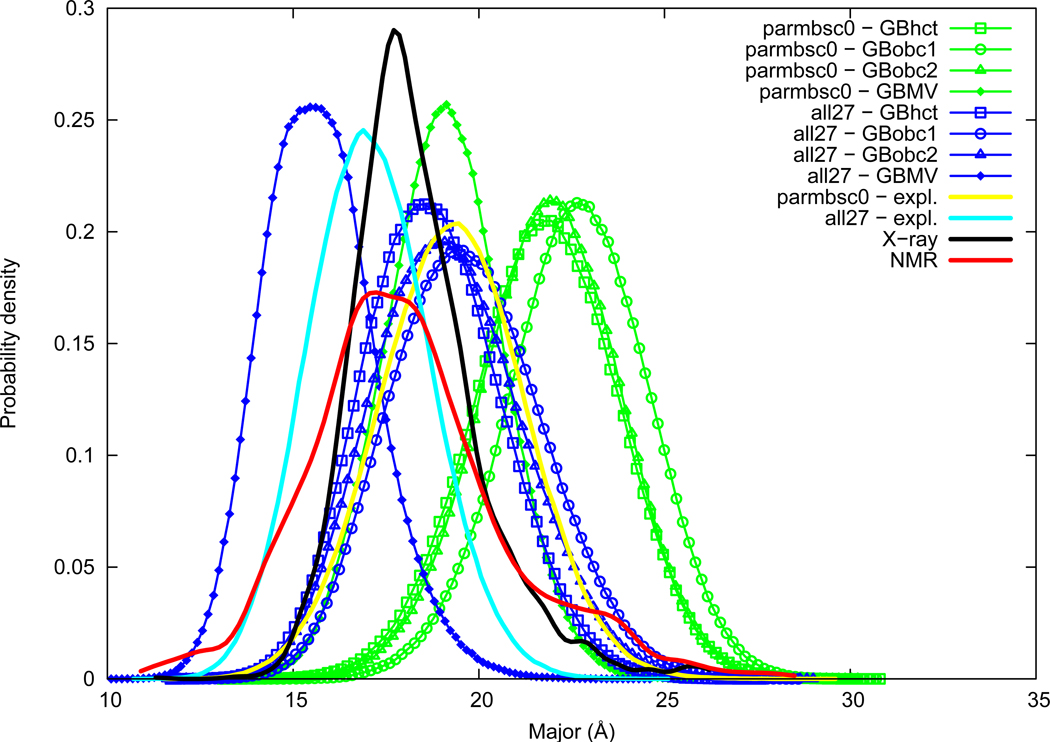
Major groove width distributions are given in Figure 6. Major groove width averages are of the same order between NMR (18.1 Å) and X-ray (18.3 Å). Maximum of probability are of 17.2 Å and 17.7 Å for NMR and X-ray, respectively. The parmbsc0 force field in explicit solvation has a noticeably overestimated major groove width (19.3 Å), on the contrary the all27 force field underestimates major groove width (17.1 Å); we have thus all27<NMR<X-ray<parmbsc0. The GBMV method lowers major groove width, in particular with the all27 force field (average value as low as 15.7 Å). AMBER GB methods on the other hand, tend to importantly increase major groove width in a consistent order (average value as high as 22.7 Å with parmbsc0+GBobc1); we have thus GBMV<explicit<GBhct<GBobc2<GBobc1. We observe here that the major groove width is very sensible to the GB method choice, and also but to a lesser extent to the force field choice.
Figure 6.
Major groove width probability distribution. See Figure 1 legend.
Backbone and glycosidic torsion parameters
Backbone and glycosidic torsional parameters α, β, γ, ε, ζ, and χ, as canonically defined, will be discussed here. The δ torsion angle is already indirectly taken into account in sugar ring parameters. Conformational substates gauche−, gauche+, and trans, are defined following a classical threefold staggered pattern as −60 ± 60°, 60 ± 60°, and 180 ± 60°, respectively.
Alpha
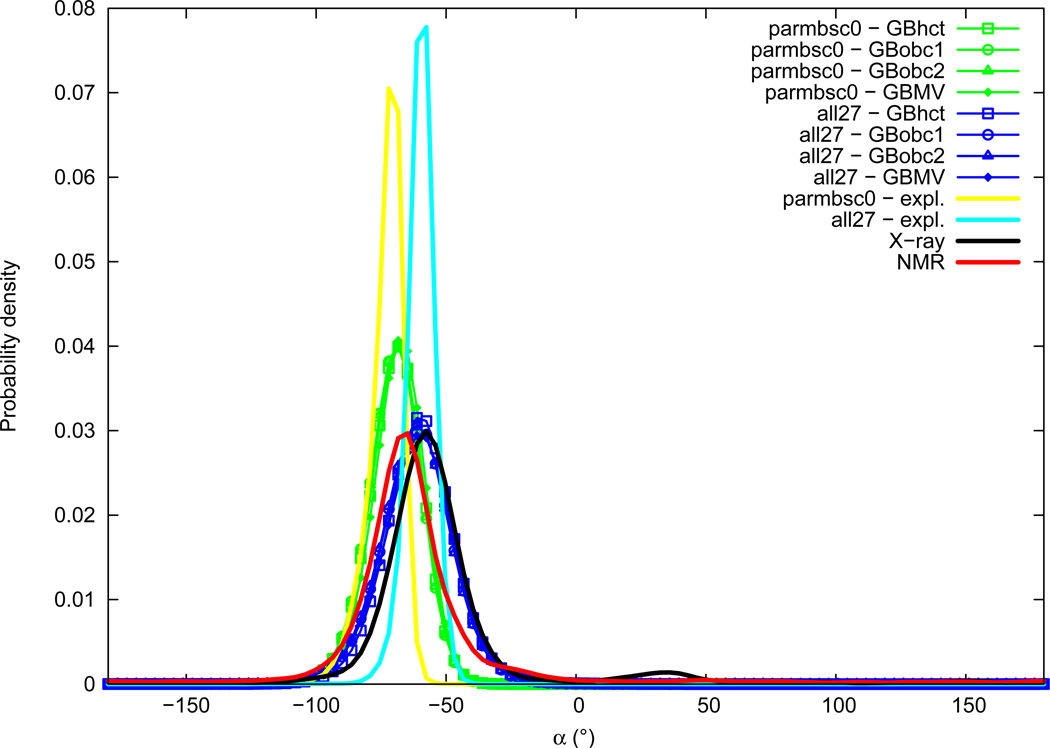
Distributions of the α backbone torsion angle are given in Figure 7. Experimental distributions of α are mostly Gaussian and slightly smaller in NMR data (average of −64.7°, maximum of probability around −66°) compared to X-ray (average of −55.6°, maximum of probability around −58°), both corresponding to a gauche− conformation. A small secondary peak around 35° is present in the X-ray distribution corresponding to a gauche+ conformation. α angle distributions from simulations are all Gaussian shaped with no significant secondary peaks. The parmbsc0 force field in explicit solvation gives significantly lower α angles (average of −73.6°, maximum of probability around −70°), whereas the all27 force field lies in the experimental range (average of −59.9°, maximum of probability around −60°); we have thus parmbsc0<NMR<all27<X-ray. The use of GB implicit solvation methods leads to a slight increase of the average α torsion angle compared to explicit solvation when used with the parmbsc0 force field, and is in good agreement or leads to a slight decrease with all27. A widening of distributions is observed for both force fields when GB methods are used. We note that the GB method choice has almost no influence here, the four GB methods distributions being almost superimposable.
Figure 7.
α torsion angle probability distribution. See Figure 1 legend.
Beta
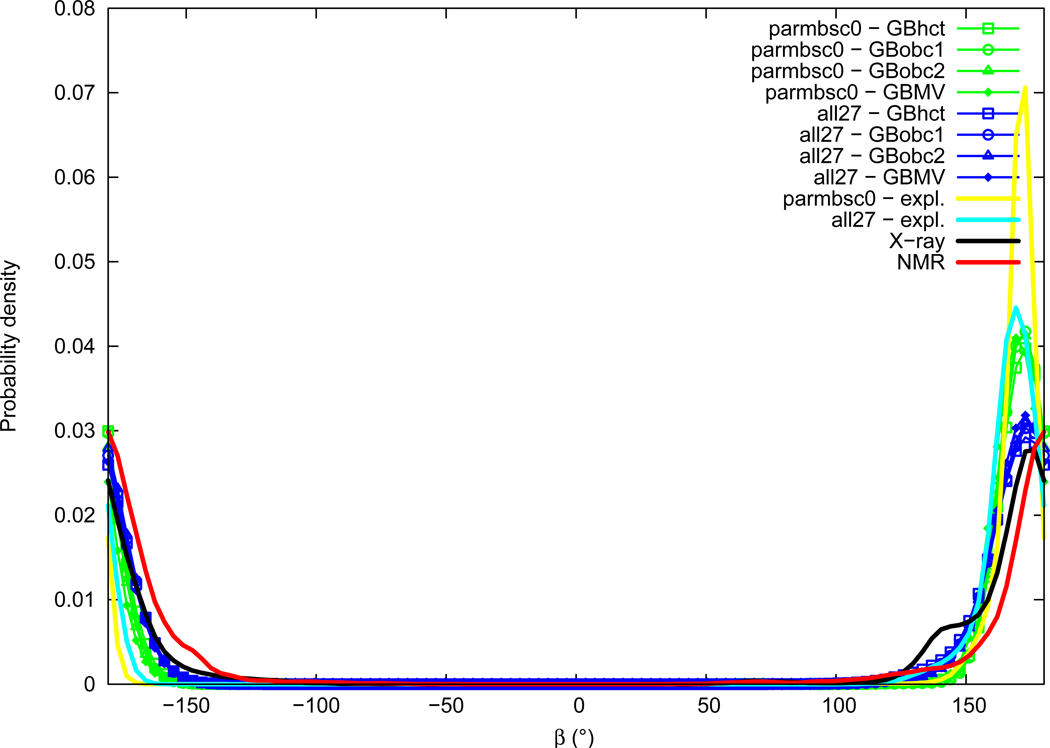
Distributions of the β torsion angle are given in Figure 8. The β angle experimental distributions are mostly Gaussian centered around the trans conformation, with slightly lower values in X-ray data (average of 172.0°, maximum of probability around 174°) compared to NMR (average of 179.4°, maximum of probability around ±180°). A small shoulder peak can be noted in the X-ray distribution around 140°. Distributions of β obtained from simulations in explicit solvation are similar to experimental ones but sharper and with slightly lower values for both all27 (average of 168.0°, maximum of probability around 169°) and parmbsc0 (average of 169.7°, maximum of probability around 171°) force fields. We have thus all27<parmbsc0<X-ray<NMR. The use of GB implicit solvation methods tends to increase the width of distributions compared to explicit solvation, as well as to slightly shift the main peak towards higher values, in particular with the all27 force field. As for the α angle, differences between all GB methods are limited.
Figure 8.
β torsion angle probability distribution. See Figure 1 legend.
Gamma
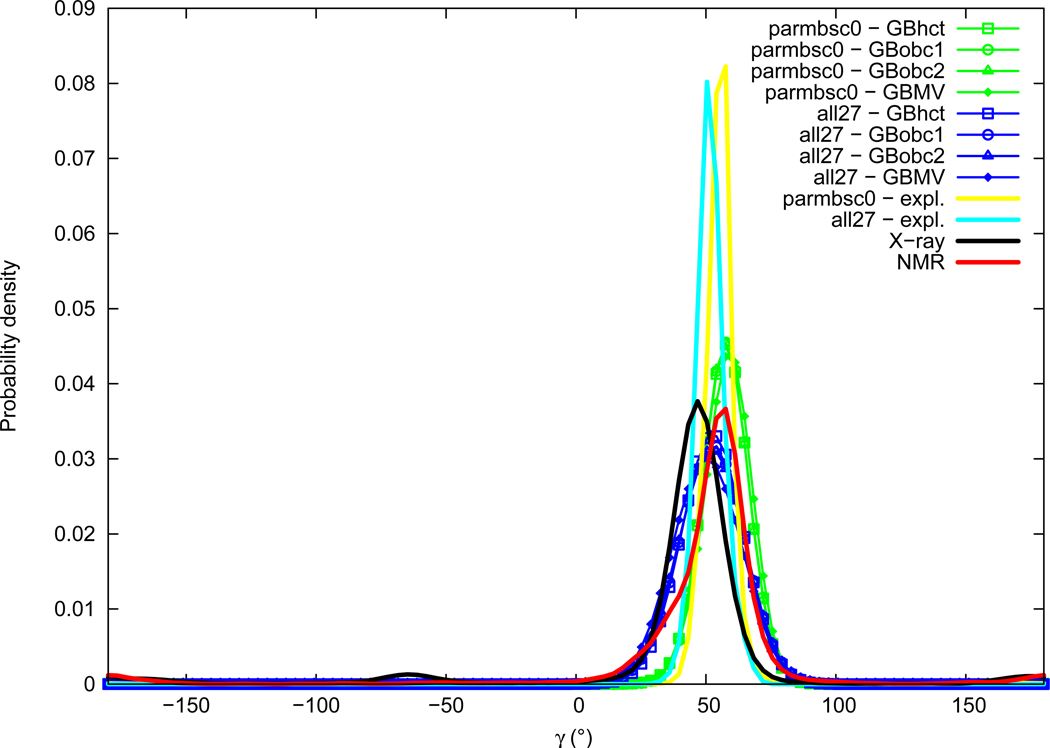
Distributions of the γ torsion angle are given in Figure 9. Experimental distributions of γ comprise a major Gaussian peak in the gauche+ region, slightly lower in X-ray data (average of 46.2°, maximum of probability around 47°) compared to NMR (average of 53.5°, maximum of probability around 56°). Small secondary peaks can be observed for both distributions in the trans conformation region, and in the gauche− region only in the X-ray distribution (around −65°). γ angle distributions from simulations are approximately Gaussians centered in the gauche+ region, with no significant other peaks. Explicit solvation γ angle values are in the correct experimental range, but slightly lower with the all27 force field (average of 51.7°, maximum of probability around 52°) than with parmbsc0 (average of 55.6°, maximum of probability around 56°). We have then X-ray<all27<NMR<parmbsc0. GB implicit solvation methods tend to widen distributions compared to explicit solvation, as well as to slightly increase the maximum of probability peak value. Differences between GB methods are also limited here.
Figure 9.
γ torsion angle probability distribution. See Figure 1 legend.
Epsilon
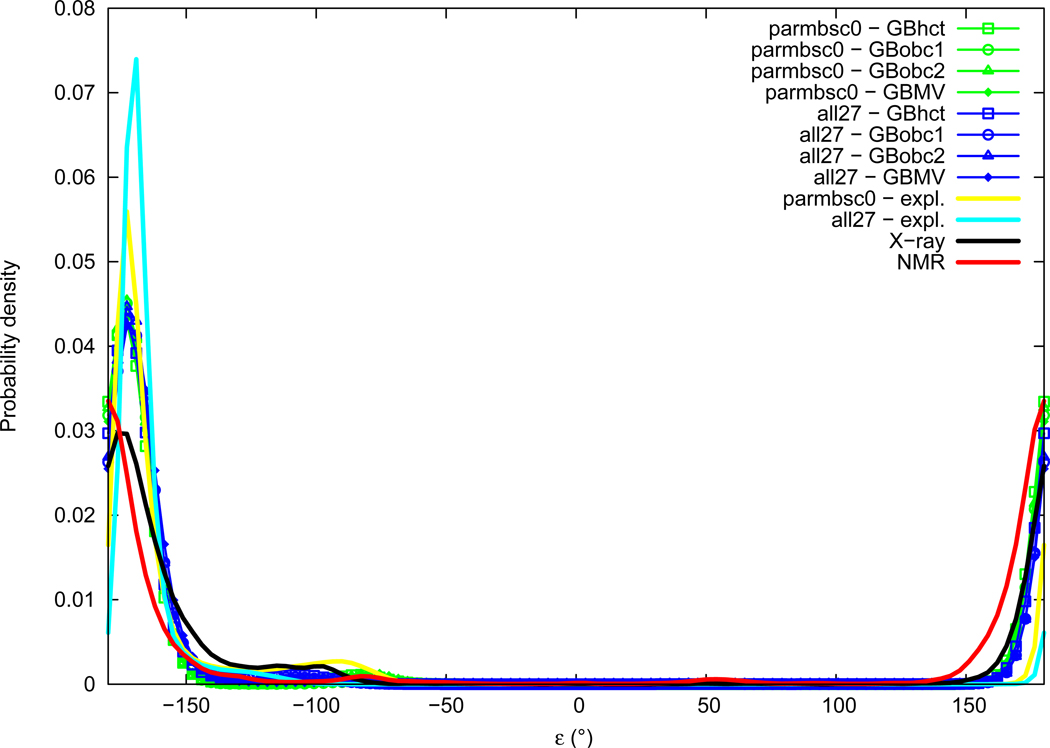
Distributions of the ε torsion angle are given in Figure 10. Experimental distributions of ε are Gaussians centered in the trans conformational region, with slightly higher values in X-ray data (average of −166.2°, maximum of probability around −174°) than in NMR (average of −177.6°, maximum of probability around ±180°). A small and broad secondary peak is visible in the X-ray distribution around −105°. Explicit solvation simulations also give ε angle distributions with a major peak in the trans region, close but slightly above X-ray with both all27 (average of −166.6°, maximum of probability about −170°) and parmbsc0 (average of −162.1°, maximum of probability about −172°). A significant secondary peak can be observed in the parmbsc0 distribution around −92°. Distributions obtained with GB implicit solvation methods are almost superimposable in the trans region with a maximum of probability around −172°, small secondary peaks can be observed around −110° with all27 and around −80° with parmbsc0, with intensities depending on the GB method.
Figure 10.
ε torsion angle probability distribution. See Figure 1 legend.
Zeta
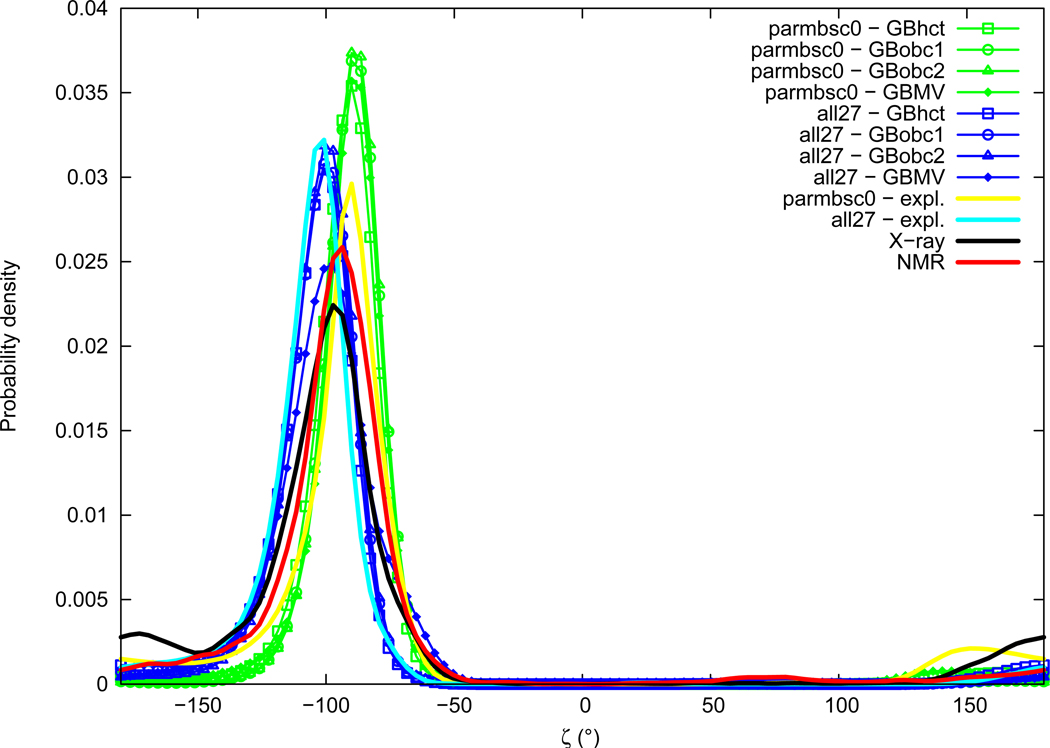
Distributions of the ζ torsion angle are given in Figure 11. Experimental distributions of ζ comprise a major peak located in the gauche− region, with values slightly lower in X-ray data (average of −109.0°, maximum of probability around −98°) compared to NMR (average of −99.5°, maximum of probability around −94°). Notable secondary peaks are present in the trans region for both X-ray (significant peak around −174°) and NMR (small shoulder around −170°). Distributions of ζ obtained from explicit solvation simulations also contain a major peak in the gauche− region, centered at values comparable to the experimental range, but slightly lower with the all27 force field (average of −108.0°, maximum of probability around −103°), and slightly superior with parmbsc0 (average of −102.3°, maximum of probability around −91°). Secondary peaks in the trans conformational region can be observed with force fields in explicit solvation, in particular with parmbsc0 (significant peak at about 152°), and also with all27 (small shoulder around ±180°). Implicit solvation ζ angle distributions are in good agreement with explicit solvation results in the gauche− region. Small differences between GB methods are observed concerning the precise location and intensity of the secondary peak in the trans region.
Figure 11.
ζ torsion angle probability distribution. See Figure 1 legend.
Chi
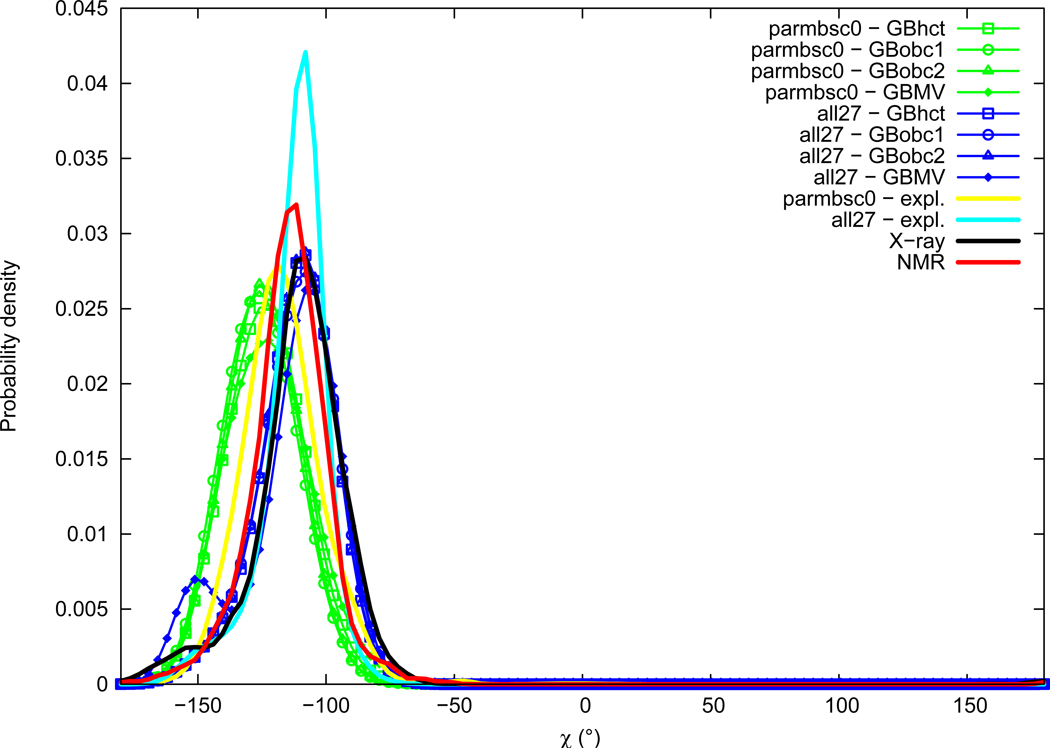
Distributions of the χ torsion angle are given in Figure 12. Experimental distributions of χ are mostly Gaussians centered in the gauche− region, with slightly lower values in NMR data (average of − 114.4°, maximum of probability around −114°) compared to X-ray (average of −110.9°, maximum of probability around −109°). A shoulder is visible in the X-ray distribution around −153°. Explicit solvation simulations give a χ angle in the experimental range for the all27 force field (average of − 112.3°, maximum of probability around −109°), and significantly underestimated with parmbsc0 (average of −117.2°, maximum of probability around −119°). The use of GB implicit solvation methods with the parmbsc0 force field further accentuates the shifting of the χ angle towards lower values by about 5° (reaching values around −125°). When GB methods are employed with the all27 force field, the χ angle main peak stays close to explicit solvation results, however with the GBMV method an important secondary peak appears around −151°.
Figure 12.
χ torsion angle probability distribution See Figure 1 legend.
Sugar puckering parameters
Sugar ring conformation is commonly described in terms of puckering or pseudorotation phase angle (P) and amplitude (τm) parameters, calculated from the ring five dihedral angles70. The endo/exo notation is sometimes used to describe particular conformations where an atom is out of the plane formed by the others, these conformations correspond to odd multiples of 18° of the P angle. The DNA in B-form is known to favor a C2′-endo (P = 162°) deoxyribose conformation, whereas in A- form the C3′-endo (P = 18°) conformation is preferred. Another way of referring to conformations of the sugar ring is the North (P = 300−60°), East (P = 60–120°), and South (P = 120–220°) notation71.
Puckering phase
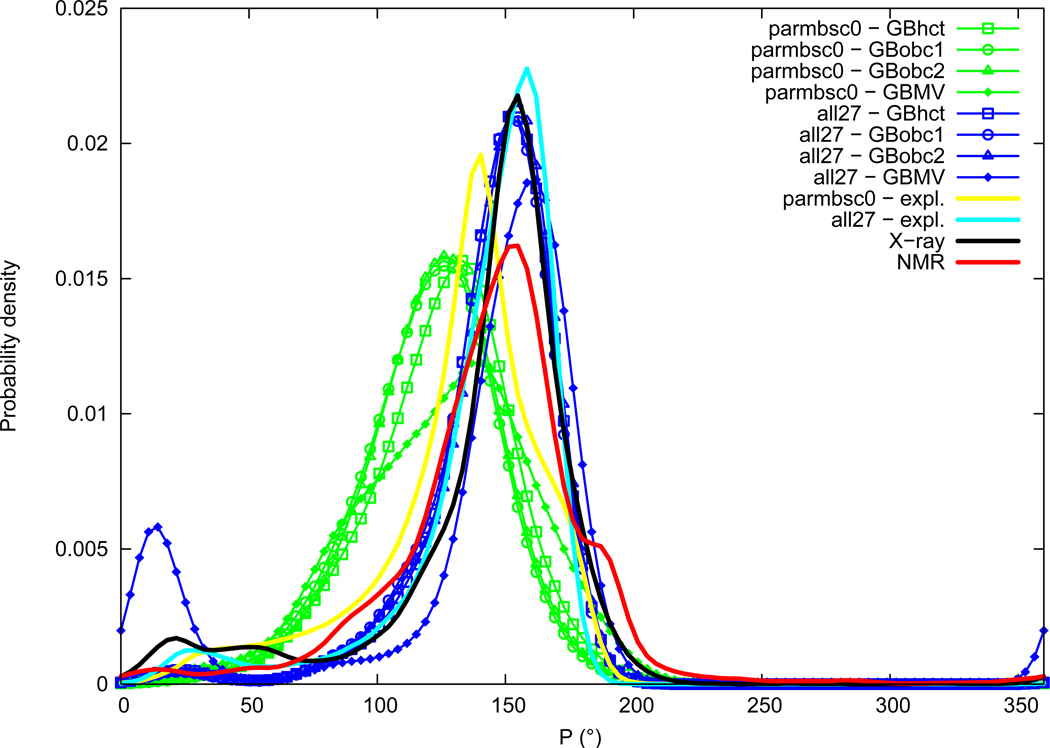
Sugar puckering phase distributions are given in Figure 13. Sugar puckering phase is the same in average in NMR and X-ray data (145.0°). Both experimental distributions present a main peak centered around 154°, corresponding to a C2′-endo conformation slightly deviated towards C1′-exo. Shoulders are visible around 85° (O4′-endo) and 185° (C2′-endo/C3′-exo) in NMR data, and small secondary peaks can be seen in the X-ray distribution around 20° (C3′-endo) and 50° (C4′-exo). The parmbsc0 force field in explicit solvation has an average puckering phase markedly underestimated (133.2°), whereas the all27 force field is closer to experimental data (143.9°). Distributions indicate that the main peak is indeed shifted on the left with parmbsc0 towards about 140°, indicating that the most populated conformation is closer to C1′-exo than to C2′-endo. GB implicit solvation effect on sugar puckering phase compared to explicit solvation is not straightforward. AMBER GB methods tend to lower the position of the main peak, in particular with the parmbsc0 force field where the maximum of probability, already underestimated by parmbsc0 in itself, is further shifted by about 10° towards lower values (reaching about 125°), corresponding to a C1′-exo conformation. When using AMBER GB methods with the all27 force field, the major peak is also shifted towards lower values but only by about 5° (at about 151°). CHARMM GBMV method effect is quite different between the two force fields. The main peak position is retained around 140° when using GBMV with parmbsc0, but widened by an important shoulder appearing on the left in the C1′-exo region (around 115°). GBMV employed with the all27 force field slightly shifts the main peak position towards higher values (around 160°), in addition a secondary peak around 13° becomes importantly populated. This indicates that transitions from the C2′-endo to the C3′-endo conformation (South to North) have occurred.
Figure 13.
Sugar puckering phase (P) probability distribution. See Figure 1 legend.
Puckering amplitude
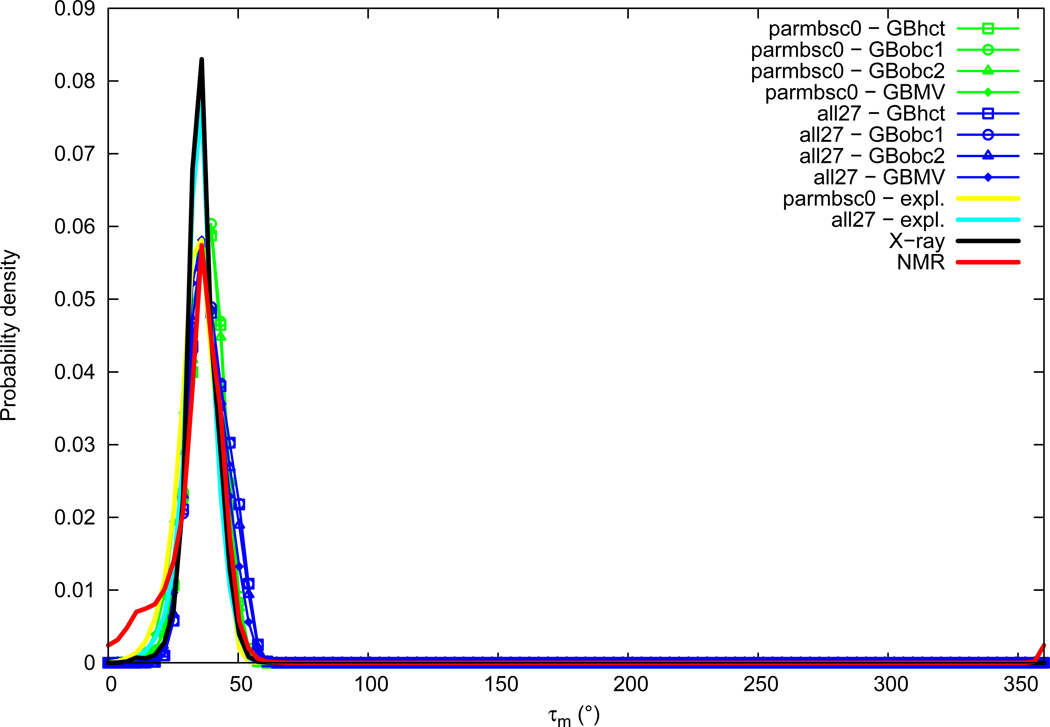
Sugar puckering amplitude distributions are given in Figure 14. Sugar puckering amplitude average values are of the same order between NMR (33.7°) and X-ray (36.0°). Both experimental distributions contain a major peak around 35°. The NMR distribution presents a shoulder on the left of the main peak, with a small peak around 12°. Both force fields in explicit solvation have puckering amplitudes in the experimental range (average values of 33.9° for parmbsc0 and 35.1° for all27). GB methods lead to a systematic but limited increase of the puckering amplitude average value, in a consistent order, namely explicit<GBMV<GBobc2<GBobc1≈GBhct. When looking at the distributions, it appears that when GB methods are used with the parmbsc0 force field, the main peak around 35° becomes uniformly shifted until about 40°, whereas GB methods with the all27 force field retain the main peak at 35° and populate other values around 50°.
Figure 14.
Sugar puckering amplitude (τm) probability distribution. See Figure 1 legend.
Discussion
Most of published work on DNA force-field evaluation was done with explicit solvation. In this work, we attempted to evaluate DNA molecular mechanics models when employed with GB implicit solvation, using explicit solvation results and experimental data as reference. Four GB models implemented in the AMBER suite (GBhct, GBobc1, GBobc2, and GBn), and one implemented in the CHARMM program (GBMV), were tested with two different force fields, AMBER parmbsc0 and CHARMM all27. We performed 5 ns molecular dynamics simulations of 12 bp length duplexes containing the 136 different tetranucleotides, with the ten combinations of force fields and GB methods. The possibility of employing the AMBER parmbsc0 or the CHARMM all27 force fields with GB implicit solvation methods implemented either in AMBER or CHARMM programs was a technical requirement in this work, allowing us to examine the respective influence of force field and GB method choice on DNA simulations. Structural parameters were extracted from simulations and statistically compared to reference data. To prevent sequence composition bias between the different dataset, a weighting was applied to ensure equal contribution of the ten different dimer steps. Considerations on the data used as reference, experimental and explicit solvation, are first presented. The respective validity and defects of force fields and GB models are then discussed.
Experimental data
DNA experimental structural data are mostly known from NMR spectroscopy and X-ray crystallography. It is not obvious to decide which technique is the most reliable experimental reference for the evaluation of our simulations, as they are very different approaches. In NMR experiments, the DNA sample is in solution, as in simulations, whereas in X-ray, the sample is in the solid state, which can lead to structural deformations compared to the aqueous phase. On the other hand, NMR data refinement importantly relies on molecular dynamics, which could bring defects from simulation models and lead to circular validation. We therefore decided to present both NMR and X-ray data. Some differences can be observed in structural parameter statistics obtained from X-ray or NMR data, concerning the precise location of the maximum of probability peak, or the detailed shape of the distribution. These differences could be the consequence of insufficient data in particular at the dimer step level, but remain limited at the global level. Most of the time, conclusions are qualitatively similar when taking NMR or X-ray as reference for the evaluation of simulation results. In addition, differences between X-ray and NMR data provide an estimation of the uncertainty expected for structural parameters.
Explicit solvation simulation data
Being able to compare implicit solvation results to explicit solvation data obtained with the same force field is essential in this work, in order to assess the quality of GB models. It was necessary to find DNA explicit solvation simulation data available for the two force fields studied (parmbsc0 and all27) and obtained in the same conditions. The work of Orozco and co-workers28 met these requirements and was therefore chosen as the explicit solvation reference in our study. Although the recent work of the ABC consortium29 would have provided a more extensive dataset, it is only available for the parmbsc0 force field. Comparison of structural parameter averages obtained with parmbsc0 in these two systematic studies shows a close agreement for most parameters. Variations in averages calculated from the same raw data between our study and those published by Orozco and co-workers are small and arise from different technical choices. It was indeed necessary to follow the same protocol and use the same program in the analysis of structural parameters between our implicit solvation results and data chosen as reference to ensure a fair comparison.
Force fields evaluation
We recall here the main force field strengths and defects identified by comparing explicit solvation simulation results of Orozco and co-workers to experimental data. Many of these conclusions have indeed already been reached in recent systematic evaluation studies of DNA simulations in explicit solvation27–29. However we believe that a summary based on our own comparison to up-to-date experimental data will prove useful here and clarify our subsequent evaluation of GB models.
The main force field defects concerning base pair step parameters are under-Slide, light over-Rise, light over-Roll, and under-Twist for parmbsc0; over-Slide, light over-Rise, over-Roll, and light over-Twist for all27. Force field respective weaknesses are thus opposite for Slide and Twist, and consistent for Rise and Roll. Mechanical couplings are known to exist between some dimer step parameters72–74. For example Slide and Twist are usually positively correlated, which can explain why an under- (parmbsc0) or over- (all27) estimation of one of these parameters is reflected in the other. Slide and Twist are also known to be negatively correlated with Roll, which is in agreement with the behaviour observed with parmbsc0 but not with all27, where Roll is overestimated while Slide and Twist are also lightly overestimated.
Opposite force field effects are found for groove widths: parmbsc0 overestimates the major groove width, whereas all27 underestimates major groove width and overestimates minor groove width. Thus, parmbsc0 increases the differences between groove widths, while all27 decreases it. Groove widths are measured over several dinucleotides, therefore a simple and direct coupling with local dimer step parameters is not expected. However it has been shown that increased Roll values correlate with wider minor grooves and narrower major grooves.75 The groove width deformations observed with the all27 force field could thus be linked to its main defect in terms of step parameters, that is Roll overestimation. The opposite groove width deformations observed with the parmbsc0 force field are not explained by this coupling. More complex linear relationships between Slide, Roll, and Twist on one hand, minor and major groove widths on the other hand, have been proposed by El Hassan and Calladine.69 Applying such relations indeed leads to a small overestimation of the major groove width with parmbsc0 contributed by its under-Twist defect, and an underestimation with all27 contributed by its over-Roll defect.
Backbone α/β/γ torsion parameters mostly stay in the g−/t/g+ conformation with both parmbsc0 and all27 force fields in explicit solvation. This conformation is canonically observed in free B-DNA71,76–78, while non-canonical α/γ conformers are more abundant in protein/DNA complexes71,78. Over-representation of unusual g+/t conformations of α/γ angles was reported with AMBER parm94 and parm99 force fields25,26,79, prompting the parmbsc0 modification. Here we find no significant g+/t conformers with all27 and less than 1% with parmbsc0. The ε and ζ torsion angles are known to adopt two main conformations, t/g− (ε − ζ ≈ −90°) and g−/t (ε − ζ ≈ +90°), respectively designated BI and BII80–82. It has been shown that the BI/BII proportion is dependent on sequence and has an important influence on helical parameters83,84. The sequence averaged experimental ratio of BI/BII sub-states was reported to be around 80/20 for free B-DNA, from an analysis of crystal structures available in 200278,83, as well as from NMR measurements84. The BI/BII ratio is more in favor of BI for protein bound DNA (around 90/10).78 The BI/BII ratio estimated from our own analysis of experimental data is 86/14 for X-ray and 94/6 for NMR. It has to be noted that our experimental datasets contain both pure and protein bound DNA, this can be at the origin of differences in BI/BII proportions. The BI/BII ratio calculated by us from Orozco and co-workers explicit solvation simulation data is 86/14 for parmbsc0, and 94/6 for all27. BII is thus probably under-represented with all27 and closer to the experimental proportion with parmbsc0. In a study on the Jun-Fos oligomer85, Hartmann and co-workers concluded that the BII state is under-represented with both parmbsc0 and all27 force fields.
The glycosidic torsion angle χ is known from earlier crystal structures surveys to adopt average values of −157° for A-DNA and −108° for B-DNA86, with a difference between B-DNA purines (χ ≈ − 102°) and pyrimidines (χ ≈ −119°)76, in conformity with our own analysis of B-DNA experimental data. The χ angle modal peak is found in the correct experimental range with the all27 force field, and underestimated with parmbsc0. Deficiencies in the description of the glycosidic angle was observed by Banáš et al.87 in simulations of RNA tetraloops with various force fields (AMBER ff94, ff99, ff99bsc0, and CHARMM all27) in explicit solvation. Reparametrization of the χ torsion of AMBER force fields was necessary to reproduce signature interactions in the tetraloops. However it was noted that fine-tuning of the χ angle for DNA and RNA at the same time might not be possible.
In terms of sugar puckering phase, the major conformation observed in experimental B-DNA is close to South C2′-endo. The all27 force field provides a modal conformation in the correct range whereas the parmbsc0 force field has an incorrect East leaning behavior leading to a different major substate still South but closer to East C1′-exo. Hartmann and co-workers85 indeed observed that sugars attached to pyrimidines oscillate between South and East with the parmbsc0 potential, whereas sugars attached to purines with parmbsc0, as well as all types of sugars with parm98 or all27 present the correct South conformation. Sugar puckering amplitude is found in the correct experimental range for both force fields. There are known correlations between sugar puckering phase and other parameters, such as a positive coupling with Twist74,88,89 and with the χ torsion in the anti range90,91. The under-twisting and χ underestimation by parmbsc0 could thus be linked to its puckering East leaning behaviour, and correcting one defect could cure the others.
Generalized Born models evaluation
We now compare our implicit solvation results to explicit solvation simulation data and present the most important defects of GB methods. We find that although the Generalized Born model is a much simpler treatment of solvation than explicit molecules, deviations observed from explicit solvation results are often of the same order as force field differences or experimental uncertainties. Some of the conclusions presented here for GBMV may have already been qualitatively obtained by Chocholoušová and Feig55, however their study focused on the Drew-Dickerson dodecamer and was not attempting to obtain converged results in terms of DNA sequence diversity.
Concerning step parameters, GB implicit solvation method defects are significant under-Slide and under-Twist with AMBER pairwise GB implementations, observed with both force fields but more pronounced with parmbsc0. Light over-Rise and over-Roll are also observed. Among pairwise GB methods, the GBhct method performs better than GBobc1 and GBobc2. It has to be noted that pairwise GB methods implemented in AMBER cause structural deformations in the same direction as the parmbsc0 force field, thereby further accentuating its own defects. GBMV, on the contrary, is close to explicit solvation values, except for Roll where light over-estimation occurs.
The minor groove width is consistently widened with GBobc1 and GBobc2, and correctly modelled or slightly underestimated with GBhct. GBMV has opposite effects for the two force fields, increasing the minor groove width with all27 and decreasing it with parmbsc0. In all cases, minor groove width deformations remain close to the range of force field and experimental uncertainties. On the other hand, the influence of GB methods on the major groove width is quite spectacular in terms of deformation amplitude. The major groove width is consistently and significantly overestimated with pairwise GB methods, in particular with the parmbsc0 force field which already inherently widens it, leading to major groove widths as high as about 22 Å with the parmbsc0+pairwise GB combinations. GBMV has an opposite narrowing effect on the major groove width, particularly pronounced with the all27 force field which already underestimates it in itself, reaching a major groove width as low as about 15 Å with the all27+GBMV combination. The best current protocols leading groove widths in the correct explicit solvation range thus appear to be parmbsc0+GBMV or all27+pairwise GB.
Backbone α, β, γ, ε, and ζ torsion angles are overall well modelled with GB solvation methods. Distributions are almost superimposable between the different GB implementations and maxima of probability stay close to the explicit solvation value. There is no clear performance distinction between GBMV and pairwise GB methods as it is the case with step parameters and groove widths. One can however notice a general tendency of GB methods to slightly increase α, β, γ, and ζ angle average values, and decrease ε. A widening of distributions can also be observed compared to explicit solvation, standard deviations becoming more comparable to experimental data, possibly reflecting improved conformational sampling of torsional angles around their canonical values with GB. The proportion of non-canonical α/γ conformers is not increased by GB methods, staying under 0.5% in all cases. BI/BII ratio obtained with GB solvation are more in favor of BI compared to explicit solvation (around 95/5). This could be caused by insufficient sampling of the minor ε/ζ conformer due to limited simulation length.
GB methods present more serious defects in terms of sugar puckering angle and glycosidic torsion χ. AMBER pairwise GB methods indeed tend to decrease the puckering and χ angles main peak position when used with the parmbsc0 force field, which already underestimates the χ torsion and has an intrinsic East leaning puckering defect. Modal angle values as low as 125° for puckering and −126° for χ are reached with the parmbsc0+GBobc combinations. When AMBER GB methods are used with the all27 force field, the puckering angle underestimation is less pronounced and the χ angle is conform to explicit solvation. The CHARMM GBMV method effect is quite different between the two force fields. The major peak position of puckering and χ angles is slightly overestimated with the all27 force field, and underestimated with parmbsc0 with an important shoulder appearing in the East region of the puckering angle. In addition, an important secondary peak is observed with all27 in the puckering angle North region and around −151° for the χ angle. Thus the all27+GBMV combination appears to abnormally favor the puckering C3′-endo North conformation and a substate of χ angle values which are characteristic of the A-DNA form. Sugar puckering amplitude with GB methods is close to the correct range.
An important and perhaps unexpected result of this work is that GB method and force field choice influences on DNA simulation quality can be of the same magnitude. As a consequence, when FF and GB defects are opposite they can fortuitously compensate, sometimes leading to even better agreement with experiment than explicit solvation. For example, there is defect compensation for Slide, Twist, and major groove width when the all27 force field is used with pairwise GB methods. Another finding is that GB influence on DNA structure is in many cases relatively independent of the force field, that is we could observe consistent effects of GB methods on DNA structural parameters when using different force fields. For example, pairwise GB methods consistently decrease Slide and Twist parameters and increase major groove width with both force fields. This facilitates the analysis, as GB and FF effects can to a certain extent be considered additive. An interest of this study is to provide a quantitative estimation of structural deformations expected when simulating DNA with GB solvation methods. Overall, we can conclude that realistic DNA modeling can be obtained with GB implicit solvation methods. In particular, the GBMV method implemented in CHARMM gives the best results, comparable to explicit solvation in most cases. Defects found in AMBER pairwise GB methods are generally less pronounced or not present with the GBMV method. It has however to be noted that the GBMV method is significantly more time consuming than pairwise GB implementations, by a factor of about 7, although this includes inherent speed differences between AMBER and CHARMM. Among AMBER GB variants, GBhct leads to better DNA modeling than GBobc1, GBobc2, or GBn. In light of our results, the best combinations of force field and GB variants that we can recommend for DNA simulations are parmbsc0+GBMV and all27+GBhct, in the latter case compensation of defects contributes to the success of the model. Ironically, this corresponds to the GB implementation of one program with the force field generally used with the other program, that is the “AMBARMM” and “CHAMBER” approaches. Although all27+GBMV would come next, it features worrying underestimation of the major groove, overestimation of North puckering, and glycosidic angle values characteristics of the A-DNA form. The parmbsc0+pairwise GB protocol is not recommended for DNA simulations, as in this situation force field and GB method defects add up for Slide, Twist, major groove width, puckering phase, and glycosidic torsion parameters, leading to important structural deformations.
Conclusion
Implicit treatments of solvation like the Generalized Born approach are not expected to be as detailed and realistic as the explicit simulation of solvent molecules, but present many advantages like improved computational efficiency, enhanced conformational sampling, and the possibility of modeling large systems and conformational changes. Implicit solvation modeling of DNA is believed to be more challenging than proteins because of the more complicated electrostatics environment. In this study, we performed a systematic evaluation of two DNA force fields with five different GB solvation models. We have shown that last decade developments have brought GB models in reasonable general agreement with explicit solvation and experimental data in terms of DNA structure and dynamics, and we identified particular defects of force fields and GB methods still present. This work provides guidance for the choice of force field and GB variant combinations in DNA simulations. The protocol developed here can be reused to evaluate force field or GB model modifications that could be suggested to improve DNA theoretical models.
Acknowledgements
The authors wish to thank Wilma K. Olson and Guohui Zheng for valuable discussions and help in using the 3DNA program and the 3DNA Landscapes platform. This work was supported by NIH grant GM57513.
References
- 1.Levitt M. Computer Simulation of DNA Double-helix Dynamics. Cold Spring Harb. Symp. Quant. Biol. 1983;47:251–262. doi: 10.1101/sqb.1983.047.01.030. [DOI] [PubMed] [Google Scholar]
- 2.Tidor B, Irikura KK, Brooks BR, Karplus M. Dynamics of DNA oligomers. J. Biomol. Struct. Dyn. 1983;1:231–252. doi: 10.1080/07391102.1983.10507437. [DOI] [PubMed] [Google Scholar]
- 3.Seibel GL, Singh UC, Kollman PA. A molecular dynamics simulation of double-helical B-DNA including counterions and water. Proc. Natl. Acad. Sci. U.S.A. 1985;82:6537–6540. doi: 10.1073/pnas.82.19.6537. [DOI] [PMC free article] [PubMed] [Google Scholar]
- 4.Darden T, York D, Pedersen L. Particle mesh Ewald: An N-log(N) method for Ewald sums in large systems. J. Chem. Phys. 1993;98:10089–10092. [Google Scholar]
- 5.Cheatham TE, 3rd, Miller JL, Fox T, Darden TA, Kollman PA. Molecular Dynamics Simulations on Solvated Biomolecular Systems: The Particle Mesh Ewald Method Leads to Stable Trajectories of DNA, RNA, and Proteins. J. Am. Chem. Soc. 1995;117:4193–4194. [Google Scholar]
- 6.York DM, Yang W, Lee H, Darden T, Pedersen LG. Toward the Accurate Modeling of DNA: The Importance of Long-Range Electrostatics. J. Am. Chem. Soc. 1995;117:5001–5002. [Google Scholar]
- 7.Cornell WD, Cieplak P, Bayly CI, Gould IR, Merz KM, Ferguson DM, Spellmeyer DC, Fox T, Caldwell JW, Kollman PA. A Second Generation Force Field for the Simulation of Proteins, Nucleic Acids, and Organic Molecules. J. Am. Chem. Soc. 1995;117:5179–5197. [Google Scholar]
- 8.MacKerell AD, Jr, Wiórkiewicz-Kuczera J, Karplus M. An All-Atom Empirical Energy Function for the Simulation of Nucleic Acids. J. Am. Chem. Soc. 1995;117:11946–11975. [Google Scholar]
- 9.Langley DR. Molecular dynamic simulations of environment and sequence dependent DNA conformations: the development of the BMS nucleic acid force field and comparison with experimental results. J. Biomol. Struct. Dyn. 1998;16:487–509. doi: 10.1080/07391102.1998.10508265. [DOI] [PubMed] [Google Scholar]
- 10.Cheatham TE, 3rd, Cieplak P, Kollman PA, et al. A modified version of the Cornell force field with improved sugar pucker phases and helical repeat. J. Biomol. Struct. Dyn. 1999;16:845–862. doi: 10.1080/07391102.1999.10508297. [DOI] [PubMed] [Google Scholar]
- 11.Foloppe N, MacKerell AD., Jr All-Atom Empirical Force Field for Nucleic Acids: I. Parameter Optimization Based on Small Molecule and Condensed Phase Macromolecular Target Data. J. Comput. Chem. 2000;21:86–104. [Google Scholar]
- 12.Perez A, Marchan I, Svozil D, Sponer J, Cheatham TE, 3rd, Laughton CA, Orozco M. Refinement of the AMBER force field for nucleic acids: improving the description of alpha/gamma conformers. Biophys. J. 2007;92:3817–3829. doi: 10.1529/biophysj.106.097782. [DOI] [PMC free article] [PubMed] [Google Scholar]
- 13.Auffinger P, Westhoff E. Simulations of the molecular dynamics of nucleic acids. Curr. Opin. Struct. Biol. 1998;8:227–236. doi: 10.1016/s0959-440x(98)80044-4. [DOI] [PubMed] [Google Scholar]
- 14.Beveridge DL, McConnell KJ. Nucleic acids: theory and computer simulation, Y2K. Curr. Opin. Struct. Biol. 2000;10:182–196. doi: 10.1016/s0959-440x(00)00076-2. [DOI] [PubMed] [Google Scholar]
- 15.Cheatham TE, 3rd, Kollman PA. Molecular Dynamics Simulation of Nucleic Acids. Annu. Rev. Phys. Chem. 2000;51:435–471. doi: 10.1146/annurev.physchem.51.1.435. [DOI] [PubMed] [Google Scholar]
- 16.Cheatham TE, 3rd, Young MA. Molecular Dynamics Simulation of Nucleic Acids: Successes, Limitations, and Promise. Biopolymers. 2001;56:232–256. doi: 10.1002/1097-0282(2000)56:4<232::AID-BIP10037>3.0.CO;2-H. [DOI] [PubMed] [Google Scholar]
- 17.Giudice E, Lavery R. Simulations of Nucleic Acids and Their Complexes. Acc. Chem. Res. 2002;35:350–357. doi: 10.1021/ar010023y. [DOI] [PubMed] [Google Scholar]
- 18.Norberg J, Nilsson L. Molecular Dynamics Applied to Nucleic Acids. Acc. Chem. Res. 2002;35:465–472. doi: 10.1021/ar010026a. [DOI] [PubMed] [Google Scholar]
- 19.Orozco M, Pérez A, Noya A, Javier Luque F. Theoretical methods for the simulation of nucleic acids. Chem. Soc. Rev. 2003;32:350–364. doi: 10.1039/b207226m. [DOI] [PubMed] [Google Scholar]
- 20.Cheatham TE., 3rd Simulation and modeling of nucleic acid structure, dynamics and interactions. Curr. Opin. Struct. Biol. 2004;14:360–367. doi: 10.1016/j.sbi.2004.05.001. [DOI] [PubMed] [Google Scholar]
- 21.Orozco M, Noy A, Pérez A. Recent advances in the study of nucleic acid flexibility by molecular dynamics. Curr. Opin. Struct. Biol. 2008;18:185–193. doi: 10.1016/j.sbi.2008.01.005. [DOI] [PubMed] [Google Scholar]
- 22.Feig M, Pettitt BM. Structural Equilibrium of DNA Represented with Different Force Fields. Biophys. J. 1998;75:134–149. doi: 10.1016/S0006-3495(98)77501-0. [DOI] [PMC free article] [PubMed] [Google Scholar]
- 23.MacKerell AD, Jr, Banavali NK. All-Atom Empirical Force Field for Nucleic Acids: II. Application to Molecular Dynamics Simulations of DNA and RNA in Solution. J. Comput. Chem. 2000;21:105–120. [Google Scholar]
- 24.Reddy SY, Leclerc F, Karplus M. DNA Polymorphism: A Comparison of Force Fields for Nucleic Acids. Biophys. J. 2003;84:1421–1449. doi: 10.1016/S0006-3495(03)74957-1. [DOI] [PMC free article] [PubMed] [Google Scholar]
- 25.Beveridge DL, Barreiro G, Byun KS, Case DA, Cheatham TE, 3rd, Dixit SB, Giudice E, Lankas F, Lavery R, Maddocks JH, Osman R, Seibert E, Sklenar H, Stoll G, Thayer KM, et al. Molecular dynamics simulations of the 136 unique tetranucleotide sequences of DNA oligonucleotides. I. Research design and results on d(CpG) steps. Biophys. J. 2004;87:3799–3813. doi: 10.1529/biophysj.104.045252. [DOI] [PMC free article] [PubMed] [Google Scholar]
- 26.Dixit SB, Beveridge DL, Case DA, Cheatham TE, 3rd, Giudice E, Lankas F, Lavery R, Maddocks JH, Osman R, Sklenar H, Thayer KM, Varnai P. Molecular dynamics simulations of the 136 unique tetranucleotide sequences of DNA oligonucleotides. II: sequence context effects on the dynamical structures of the 10 unique dinucleotide steps. Biophys. J. 2005;89:3721–3740. doi: 10.1529/biophysj.105.067397. [DOI] [PMC free article] [PubMed] [Google Scholar]
- 27.Fujii S, Kono H, Takenaka S, Go N, Sarai A. Sequence-dependent DNA deformability studied using molecular dynamics simulations. Nucleic Acids Res. 2007;35:6063–6074. doi: 10.1093/nar/gkm627. [DOI] [PMC free article] [PubMed] [Google Scholar]
- 28.Perez A, Lankas F, Luque FJ, Orozco M. Towards a molecular dynamics consensus view of B-DNA flexibility. Nucleic Acids Res. 2008;36:2379–2394. doi: 10.1093/nar/gkn082. [DOI] [PMC free article] [PubMed] [Google Scholar]
- 29.Lavery R, Zakrzewska K, Beveridge D, Bishop TC, Case DA, Cheatham T, 3rd, Dixit S, Jayaram B, Lankas F, Laughton C, Maddocks JH, Michon A, Osman R, Orozco M, Perez A, et al. A systematic molecular dynamics study of nearest-neighbor effects on base pair and base pair step conformations and fluctuations in B-DNA. Nucleic Acids Res. 2010;38:299–313. doi: 10.1093/nar/gkp834. [DOI] [PMC free article] [PubMed] [Google Scholar]
- 30.Still WC, Tempczyk A, Hawley RC, Hendrickson T. Semianalytical treatment of solvation for molecular mechanics and dynamics. J. Am. Chem. Soc. 1990;112:6127–6129. [Google Scholar]
- 31.Hawkins GD, Cramer CJ, Truhlar DG. Pairwise solute descreening of solute charges from a dielectric medium. Chem. Phys. Lett. 1995;246:122–129. [Google Scholar]
- 32.Hawkins GD, Cramer CJ, Truhlar DG. Parametrized Models of Aqueous Free Energies of Solvation Based on Pairwise Descreening of Solute Atomic Charges from a Dielectric Medium. J. Phys. Chem. 1996;100:19824–19839. [Google Scholar]
- 33.Qiu D, Shenkin PS, Hollinger FP, Still WC. The GB/SA Continuum Model for Solvation. A Fast Analytical Method for the Calculation of Approximate Born Radii. J. Phys. Chem. A. 1997;101:3005–3014. [Google Scholar]
- 34.Jayaram B, Liu Y, Beveridge DL. A modification of the generalized Born theory for improved estimates of solvation energies and pK shifts. J. Chem. Phys. 1998;109:1465–1471. [Google Scholar]
- 35.Dominy BN, Brooks CL., 3rd Development of a Generalized Born Model Parametrization for Proteins and Nucleic Acids. J. Phys. Chem. B. 1999;103:3765–3773. [Google Scholar]
- 36.Tsui V, Case DA. Theory and applications of the generalized Born solvation model in macromolecular simulations. Biopolymers. 2001;56:275–291. doi: 10.1002/1097-0282(2000)56:4<275::AID-BIP10024>3.0.CO;2-E. [DOI] [PubMed] [Google Scholar]
- 37.Onufriev A, Bashford D, Case DA. Modification of the Generalized Born Model Suitable for Macromolecules. J. Phys. Chem. B. 2000;104:3712–3720. [Google Scholar]
- 38.Onufriev A, Bashford D, Case DA. Exploring protein native states and large-scale conformational changes with a modified generalized born model. Proteins. 2004;55:383–394. doi: 10.1002/prot.20033. [DOI] [PubMed] [Google Scholar]
- 39.Mongan J, Simmerling C, McCammon JA, Case DA, Onufriev A. Generalized Born Model with a Simple, Robust Molecular Volume Correction. J. Chem. Theory Comput. 2007;3:156–169. doi: 10.1021/ct600085e. [DOI] [PMC free article] [PubMed] [Google Scholar]
- 40.Schaefer M, Karplus M. A Comprehensive Analytical Treatment of Continuum Electrostatics. J. Phys. Chem. 1996;100:1578–1599. [Google Scholar]
- 41.Schaefer M, Bartels C, Leclerc F, Karplus M. Effective Atom Volumes for Implicit Solvent Models: Comparison between Voronoi Volumes and Minimum Fluctuation Volumes. J. Comput. Chem. 2001;22:1857–1879. doi: 10.1002/jcc.1137. [DOI] [PubMed] [Google Scholar]
- 42.Lee MS, Salsbury FR, Jr, Brooks CL., Jr Novel generalized Born methods. J. Chem. Phys. 2002;116:10606–10614. [Google Scholar]
- 43.Lee MS, Feig M, Salsbury FR, Jr, Brooks CL., 3rd New analytic approximation to the standard molecular volume definition and its application to generalized Born calculations. J. Comput. Chem. 2003;24:1348–1356. doi: 10.1002/jcc.10272. [DOI] [PubMed] [Google Scholar]
- 44.Im W, Lee MS, Brooks CI., 3rd Generalized Born Model with a Simple Smoothing Function. J. Comput. Chem. 2003;24:1691–1702. doi: 10.1002/jcc.10321. [DOI] [PubMed] [Google Scholar]
- 45.Onufriev A, Case DA, Bashford D. Effective Born radii in the generalized Born approximation: the importance of being perfect. J. Comput. Chem. 2002;23:1297–1304. doi: 10.1002/jcc.10126. [DOI] [PubMed] [Google Scholar]
- 46.Feig M, Onufriev A, Lee MS, Im W, Case DA, Brooks CL., 3rd Performance comparison of generalized born and Poisson methods in the calculation of electrostatic solvation energies for protein structures. J. Comput. Chem. 2004;25:265–284. doi: 10.1002/jcc.10378. [DOI] [PubMed] [Google Scholar]
- 47.Fan H, Mark AE, Zhu J, Honig B. Comparative study of generalized Born models: Protein dynamics. Proc. Natl. Acad. Sci. U.S.A. 2005;102:6760–6764. doi: 10.1073/pnas.0408857102. [DOI] [PMC free article] [PubMed] [Google Scholar]
- 48.Bashford D, Case DA. Generalized born models of macromolecular solvation effects. Annu. Rev. Phys. Chem. 2000;51:129–152. doi: 10.1146/annurev.physchem.51.1.129. [DOI] [PubMed] [Google Scholar]
- 49.Simonson T. Macromolecular electrostatics: continuum models and their growing pains. Curr. Opin. Struct. Biol. 2001;11:243–252. doi: 10.1016/s0959-440x(00)00197-4. [DOI] [PubMed] [Google Scholar]
- 50.Feig M, Brooks CL., 3rd Recent advances in the development and application of implicit solvent models in biomolecule simulations. Curr. Opin. Struct. Biol. 2004;14:217–224. doi: 10.1016/j.sbi.2004.03.009. [DOI] [PubMed] [Google Scholar]
- 51.Chen J, Brooks CL, 3rd, Khandogin J. Recent advances in implicit solvent-based methods for biomolecular simulations. Curr. Opin. Struct. Biol. 2008;18:140–148. doi: 10.1016/j.sbi.2008.01.003. [DOI] [PMC free article] [PubMed] [Google Scholar]
- 52.Srinivasan J, Cheatham TE, 3rd, Cieplak P, Kollman PA, Case DA. Continuum Solvent Studies of the Stability of DNA, RNA, and Phosphoramidate-DNA Helices. J. Am. Chem. Soc. 1998;120:9401–9409. [Google Scholar]
- 53.Srinivasan J, Trevathan MW, Beroza P, Case DA. Application of a pairwise generalized Born model to proteins and nucleic acids: inclusion of salt effects. Theor. Chem. Acc. 1999;101:426–434. [Google Scholar]
- 54.Tsui V, Case DA. Molecular Dynamics Simulations of Nucleic Acids with a Generalized Born Solvation Model. J. Am. Chem. Soc. 2000;122:2489–2498. [Google Scholar]
- 55.Chocholoušová J, Feig M. Implicit Solvent Simulations of DNA and DNA-Protein Complexes: Agreement with Explicit Solvent vs Experiment. J. Phys. Chem. B. 2006;110:17240–17251. doi: 10.1021/jp0627675. [DOI] [PubMed] [Google Scholar]
- 56.Ruscio JZ, Onufriev A. A Computational Study of Nucleosomal DNA Flexibility. Biophys. J. 2006;91:4121–4132. doi: 10.1529/biophysj.106.082099. [DOI] [PMC free article] [PubMed] [Google Scholar]
- 57.Case DA, Cheatham TE, 3rd, Darden T, Gohlke H, Luo R, Merz KM, Jr, Onufriev A, Simmerling C, Wang B, Woods RJ. The Amber biomolecular simulation programs. J. Comput. Chem. 2005;26:1668–1688. doi: 10.1002/jcc.20290. [DOI] [PMC free article] [PubMed] [Google Scholar]
- 58.Arnott S, Smith PJC, Chandrasekaran R. In: Handbook of Biochemistry and Molecular Biology, third ed., Nucleic Acids, Volume II. Fasman GD, editor. Cleveland: CRC Press; 1976. pp. 411–422. [Google Scholar]
- 59.Brooks BR, Bruccoleri RE, Olafson BD, States DJ, Swaminathan S, Karplus M. CHARMM : A program for macromolecular energy, minimization, and dynamics calculations. J. Comput. Chem. 1983;4:187–217. [Google Scholar]
- 60.Crowley MF, Williamson MJ, Walker RC. CHAMBER: Comprehensive Support for CHARMM Force Fields Within the AMBER Software. Int. J. Quantum Chem. 2009;109:3767–3772. [Google Scholar]
- 61.Chocholoušová J, Feig M. Balancing an Accurate Representation of the Molecular Surface in Generalized Born Formalisms with Integrator Stability in Molecular Dynamics Simulations. J. Comput. Chem. 2006;27:719–729. doi: 10.1002/jcc.20387. [DOI] [PubMed] [Google Scholar]
- 62.Bondi A. van der Waals Volumes and Radii. J. Phys. Chem. 1964;68:441–451. [Google Scholar]
- 63.Dickerson RE. Definitions and nomenclature of nucleic acid structure components. Nucleic Acids Res. 1989;17:1797–1803. doi: 10.1093/nar/17.5.1797. [DOI] [PMC free article] [PubMed] [Google Scholar]
- 64.Lu XJ, Olson WK. 3DNA: a software package for the analysis, rebuilding and visualization of three-dimensional nucleic acid structures. Nucleic Acids Res. 2003;31:5108–5121. doi: 10.1093/nar/gkg680. [DOI] [PMC free article] [PubMed] [Google Scholar]
- 65.Lu XJ, Olson WK. 3DNA: a versatile, integrated software system for the analysis, rebuilding and visualization of three-dimensional nucleic-acid structures. Nat. Protoc. 2008;3:1213–1227. doi: 10.1038/nprot.2008.104. [DOI] [PMC free article] [PubMed] [Google Scholar]
- 66.Berman HM, Westbrook J, Feng Z, Gilliland G, Bhat TN, Weissig H, Shindyalov IN, Bourne PE. The Protein Data Bank. Nucleic Acids Res. 2000;28:235–242. doi: 10.1093/nar/28.1.235. [DOI] [PMC free article] [PubMed] [Google Scholar]
- 67.Berman HM, Olson WK, Beveridge DL, Westbrook J, Gelbin A, Demeny T, Hsieh SH, Srinivasan AR, Schneider B. The Nucleic Acid Database. A comprehensive relational database of three-dimensional structures of nucleic acids. Biophys. J. 1992;63:751–759. doi: 10.1016/S0006-3495(92)81649-1. [DOI] [PMC free article] [PubMed] [Google Scholar]
- 68.Zheng G, Colasanti AV, Lu XJ, Olson WK. 3DNALandscapes: a database for exploring the conformational features of DNA. Nucleic Acids Res. 2010;38:D267–D274. doi: 10.1093/nar/gkp959. [DOI] [PMC free article] [PubMed] [Google Scholar]
- 69.El Hassan MA, Calladine CR. Two Distinct Modes of Protein-induced Bending in DNA. J. Phys. Chem. B. 1998;282:331–343. doi: 10.1006/jmbi.1998.1994. [DOI] [PubMed] [Google Scholar]
- 70.Altona C, Sundaralingam M. Conformational Analysis of the Sugar Ring in Nucleosides and Nucleotides. A New Description Using the Concept of Pseudorotation. J. Am. Chem. Soc. 1972;94:8205–8212. doi: 10.1021/ja00778a043. [DOI] [PubMed] [Google Scholar]
- 71.Várnai P, Djuranovic D, Lavery R, Hartmann B. Alpha/gamma Transitions in the B-DNA backbone. Nucleic Acids Res. 2002;30:5398–5406. doi: 10.1093/nar/gkf680. [DOI] [PMC free article] [PubMed] [Google Scholar]
- 72.Gorin AA, Zhurkin VB, Olson WK. B-DNA Twisting Correlates with Base-pair Morphology. J. Mol. Biol. 1995;247:34–48. doi: 10.1006/jmbi.1994.0120. [DOI] [PubMed] [Google Scholar]
- 73.Olson WK, Gorin AA, Lu XJ, Hock LM, Zhurkin VB. DNA sequence-dependent deformability deduced from protein-DNA crystal complexes. Proc. Natl. Acad. Sci. U.S.A. 1998;95:11163–11168. doi: 10.1073/pnas.95.19.11163. [DOI] [PMC free article] [PubMed] [Google Scholar]
- 74.Olson WK, Zhurkin VB. Modeling DNA deformations. Curr. Opin. Struct. Biol. 2000;10:286–297. doi: 10.1016/s0959-440x(00)00086-5. [DOI] [PubMed] [Google Scholar]
- 75.Suzuki M, Yagi N. An In-the-Groove View of DNA Structures in Complexes with Proteins. J. Mol. Biol. 1996;255:677–687. doi: 10.1006/jmbi.1996.0055. [DOI] [PubMed] [Google Scholar]
- 76.Schneider B, Neidle S, Berman HM. Conformations of the Sugar-Phosphate Backbone in Helical DNA Crystal Structures. Biopolymers. 1997;42:113–124. doi: 10.1002/(sici)1097-0282(199707)42:1<113::aid-bip10>3.0.co;2-o. [DOI] [PubMed] [Google Scholar]
- 77.Beckers MLM, Buydens LMC. Multivariate Analysis of a Data Matrix Containing A-DNA and B-DNA Dinucleoside Monophosphate Steps: Multidimensional Ramachandran Plots for Nucleic Acids. J. Comput. Chem. 1998;19:695–715. [Google Scholar]
- 78.Djuranovic D, Hartmann B. Conformational characteristics and correlations in crystal structures of nucleic acid oligonucleotides: evidence for sub-states. J. Biomol. Struct. Dyn. 2003;20:771–788. doi: 10.1080/07391102.2003.10506894. [DOI] [PubMed] [Google Scholar]
- 79.Várnai P, Zakrzewska K. DNA and its counterions: a molecular dynamics study. Nucleic Acids Res. 2004;32:4269–4280. doi: 10.1093/nar/gkh765. [DOI] [PMC free article] [PubMed] [Google Scholar]
- 80.Gupta G, Bansal M, Sasisekharan V. Reversible Bending and Helix Geometry in a B-DNA Dodecamer: CGCGAATTBrCGCG*. J. Biol. Chem. 1982;257:14686–14707. [PubMed] [Google Scholar]
- 81.Privé GG, Heinemann U, Chandrasegaran S, Kan L-S, Kopka M, Dickerson RE. Helix Geometry, Hydration, and G·A Mismatch in a B-DNA Decamer. Science. 1987;238:498–504. doi: 10.1126/science.3310237. [DOI] [PubMed] [Google Scholar]
- 82.Hartmann B, Piazzola D, Lavery R. BI-BII transitions in B-DNA. Nucleic Acids Res. 1993;21:561–568. doi: 10.1093/nar/21.3.561. [DOI] [PMC free article] [PubMed] [Google Scholar]
- 83.Djuranovic D, Hartmann B. DNA fine structure and dynamics in crystals and in solution: the impact of BI/BII backbone conformations. Biopolymers. 2004;73:356–368. doi: 10.1002/bip.10528. [DOI] [PubMed] [Google Scholar]
- 84.Heddi B, Foloppe N, Bouchemal N, Hantz E, Hartmann B. Quantification of DNA BI/BII backbone states in solution. Implications for DNA overall structure and recognition. J. Am. Chem. Soc. 2006;128:9170–9177. doi: 10.1021/ja061686j. [DOI] [PubMed] [Google Scholar]
- 85.Heddi B, Foloppe N, Oguey C, Hartmann B. Importance of Accurate DNA Structures in Solution: The Jun-Fos Model. J. Mol. Biol. 2008;382:956–970. doi: 10.1016/j.jmb.2008.07.047. [DOI] [PubMed] [Google Scholar]
- 86.Lu XJ, Shakked Z, Olson WK. A-form Conformational Motifs in Ligand-bound DNA Structures. J. Mol. Biol. 2000;300:819–840. doi: 10.1006/jmbi.2000.3690. [DOI] [PubMed] [Google Scholar]
- 87.Banáš P, Hollas D, Zgarbová M, Jurečka P, Orozco M, Cheatham TE, 3rd, Šponer J, Otyepka M. Performance of Molecular Mechanics Force Fields for RNA Simulations: Stability of UUCG and GNRA Hairpins. J. Chem. Theory Comput. 2010;6:3836–3849. doi: 10.1021/ct100481h. [DOI] [PMC free article] [PubMed] [Google Scholar]
- 88.Zhurkin VB, Lysov YP, Florentiev VL, Ivanov VI. Torsional flexibility of B-DNA as revealed by conformational analysis. Nucleic Acids Res. 1982;10:1811–1830. doi: 10.1093/nar/10.5.1811. [DOI] [PMC free article] [PubMed] [Google Scholar]
- 89.Kollman P, Keepers JW, Weiner P. Molecular-mechanics studies on d(CGCGAATTCGCG)2 and dA12·dT12: An illustration of the coupling between sugar repuckering and DNA twisting. Biopolymers. 1982;21:2345–2376. [Google Scholar]
- 90.Dickerson RE, Drew HR, Conner BN, Wing RM, Fratini AV, Kopka ML. The Anatomy of A-, B-, and Z-DNA. Science. 1982;216:475–485. doi: 10.1126/science.7071593. [DOI] [PubMed] [Google Scholar]
- 91.Gelbin A, Schneider B, Clowney L, Hsieh SH, Olson WK, Berman HM. Geometric Parameters in Nucleic Acids: Sugar and Phosphate Constituents. J. Am. Chem. Soc. 1996;118:519–529. [Google Scholar]


