

Abstract
Background
The most common functional single nucleotide polymorphism of the human OPRM1 gene, A118G, has been shown to be associated with inter-individual differences in opioid analgesic requirements, particularly with morphine, in patients with acute postoperative pain. The purpose of the present study was to examine whether this polymorphism would modulate the morphine and fentanyl pharmacological profile of sensory neurons isolated from a humanized mouse model homozygous for either the 118A or 118G allele.
Methods
The coupling of wild-type and mutant mu opioid receptors to voltage-gated Ca2+ channels after exposure to either ligand was examined by employing the whole-cell variant of the patch-clamp technique in acutely dissociated trigeminal ganglion neurons. Morphine-mediated antinociception was measured in mice carrying either the 118AA or 118GG allele.
Results
The biophysical parameters (cell size, current density, and peak current amplitude potential) measured from both groups of sensory neurons were not significantly different. In 118GG neurons, morphine was approximately 5-fold less potent and 26% less efficacious than that observed in 118AA neurons. On the other hand, the potency and efficacy of fentanyl were similar for both groups of neurons. Morphine-mediated analgesia in 118GG mice was significantly reduced compared to the 118AA mice.
Conclusions
This study provides evidence to suggest that the diminished clinical effect observed with morphine in 118G carriers results from an alteration of the receptor’s pharmacology in sensory neurons. Additionally, the impaired analgesic response with morphine may explain why carriers of this receptor variant have an increased susceptibility to become addicted to opioids.
Introduction
Mu opioid receptors (MOR) are common targets of opiate analgesics. Potentially functional genetic variation is present within the human MOR gene (OPRM1). For instance, several single-nucleotide polymorphisms are present within both coding and noncoding regions1-3. The most common functional polymorphism occurs at position 118 in exon 12-3. The mutation results in an exchange from asparagine (N) to aspartate (D) at position 40 (N40D) on the extracellular N-terminal domain. The asparagine residue is one of five putative glycosylation sites on the MOR. Several clinical studies have reported that the A118G polymorphism may play a role in opiate effectiveness in the treatment of acute and chronic pain4-13, susceptibility to drug addiction14-18, stress19, and suicide20. Findings from in vitro studies have suggested that this polymorphism affects receptor binding characteristics21, messenger RNA expression levels22, and ion channel activation1. However, under some experimental conditions this polymorphism showed no effect on function23 or expression levels24.
Recently we reported the generation of genetically modified, ‘humanized’ mouse lines that are homozygous either for the wild-type (118AA) or variant (118GG) human OPRM1 allele and express the respective MOR25. It is known that mesolimbic dopamine neurons are under tonic gamma aminobutyric acid-ergic inhibition that can be lifted through activation of MOR on gamma aminobutyric acid -ergic terminals in the ventral tegmental area. It is further known that alcohol administration results in release of endogenous opioids in the ventral tegmental area, and through the cascade outlined ultimately in striatal dopamine release. Using this as a functional readout, and employing brain microdialysis, we found that 118GG mice exhibited a fourfold greater peak dopamine response following an alcohol challenge, demonstrating that A118G variation is functional in this animal model25. This study, however, left unresolved the molecular mechanism mediating the functional role of the A118G polymorphism, since binding of classical mu-agonists (β-endorphin, DAMGO) as well as signaling induced by these were unaffected by genotype.
The purpose of the present study was to extend this investigation in order to determine the pharmacological profile of two clinically relevant MOR ligands not examined in the original study, morphine and fentanyl, on the MOR-stimulated coupling to voltage-gated Ca2+ channels in sensory neurons. These ion channels play a crucial role in nociceptive signaling26. Of particular relevance, studies of spontaneous nociception indicate the minor 118G allele to be a gain-of-function variant27. However, studies of morphine analgesia suggest functional consequences of the mutation to be just the opposite, with requirement of higher post-operative morphine doses2.
Materials and Methods
Humanized Mouse Lines
Both humanized mouse lines were obtained as previously described25. Briefly, the line homozygous for the 118A allele (h/mOPRM-118AA, wild-type) was generated by replacing exon 1 of the mouse MOR gene with the corresponding human sequence. The line homozygous for the human 118G allele (h/mOPRM-118GG, mutant) was generated by employing site-directed 118A→G mutagenesis on the same construct, followed by replacement of exon 1. Except for the A-G exchange, therefore, both lines are genetically identical. The humanized mouse lines were generated on C57/BL6 background and the colony is maintained by h/m OPRM1-118AG breeding in order to generate littermates of all three genotypes: h/m-OPRM1-118AA, h/m-OPRM1-118AG, and h/m-OPRM1-118GG. The allele-frequencies in the offspring followed Mendelian distribution (24.1% h/m-OPRM1-118AA, 25.3% h/m-OPRM1-118GG, and 50.6% h/m-OPRM1-118AG) and were equally distributed with regards to sex of offspring (52.2% female, 47.8% male). Currently, the line is in the 7th generation of breeding and no adverse phenotype has arisen during this time. Heterozygous mice were not studied so that both extremes could be compared and allow us to maintain a focused interpretation of the data.
Trigeminal Ganglion (TG) Neuron Isolation
The experiments designed to isolate single trigeminal ganglion (TG) neurons from humanized wild-type (118AA) and mutant (118GG) mice were approved by the Penn State College of Medicine Institutional Animal Care and Use Committee (Hershey, PA). The mice were first anesthetized with carbon dioxide and then decapitated with a laboratory guillotine. The TG were quickly removed and cleared of connective tissue in ice-cold Hank’s balanced salt solution (Sigma Aldrich, St. Louis, MO). Enzymatic dissociation of the ganglia was performed in modified Earle’s balanced salt solution containing 0.6 mg/ml collagenase (Roche Applied Science, Indianapolis, IN), 0.4 mg/ml trypsin (Worthington Biochemical, Lakewood, NJ) and 0.1 mg/ml DNase (Sigma Aldrich) for 40 min at 35°C in a shaking water bath. Afterwards, the neurons were dispersed by vigorous shaking and centrifuged twice at 130 X g for 6 min. The isolated TG neurons were re-suspended in minimal essential medium, supplemented with 10% fetal calf serum, 1% penicillin-streptomycin and 1% glutamine (all from Invitrogen Corp., Carlsbad CA) and plated onto 35 mm poly-L-lysine coated dishes. The dispersed neurons were then stored in a humidified atmosphere containing 5% CO2/95% air at 37°C.
Electrophysiology and Data Acquisition
Whole-cell Ca2+ channel currents were recorded employing the variant of the patch-clamp technique. The recording pipettes, fabricated from borosilicate glass (Garner Glass Co., Claremont, CA), were pulled on a P-97 micropipette puller (Sutter Instrument Co., Novato, CA). The Ca2+ currents were acquired with an Axopatch 200B amplifier (Molecular Devices, Sunnyvale, CA), equipped with an 18-bit analog-to-digital converter board (HEKA Instruments, Bellmore, NY). The currents were analog filtered at a frequency of 2 kHz (−3dB, 4-pole low-pass Bessel filter), and digitized with custom-designed S5 software developed by Stephen R. Ikeda, M.D., Ph.D. (Chief, Laboratory of Molecular Physiology, National Institute on Alcohol Abuse and Alcoholism, Bethesda, MD).
The concentration-response relationships were determined by the sequential application of the MOR agonists at different concentrations in ascending order, and full recovery of the Ca2+ current amplitude was required before exposure to another concentration. Furthermore, to minimize desensitization, no more than three concentrations of agonists were applied to each neuron. Percent Ca2+ current inhibition was determined as [1-(peak current in the presence of drug/peak current before drug)] * 100%. The concentration-response curves were generated by pooling the results for each concentration and fitting the points to the Hill equation: I = IMAX/{1 + (IC50/[ligand])nH}, where I is the percentage inhibition, IMAX is the maximum inhibition of the Ca2+ current, IC50 is the half-inhibition concentration, [ligand] is the agonist concentration and nH is the Hill coefficient. It should be noted that not all TG neurons tested exhibited Ca2+ current inhibition in the presence of agonists. Overall, approximately 50-60% of neurons tested in both groups exhibited coupling between MOR and Ca2+ channels.
Solutions and Drugs
The external recording solution consisted of (in mM): tetraethylammonium hydroxide 145, methanesulphonic acid 140, HEPES 10, glucose 15, CaCl2 2.5, tetraethylammonium chloride 15 and TTX 0.0003. The pH was adjusted to 7.40 with tetraethylammonium hydroxide. The pipette solution contained (in mM): N-methyl-D-glucamine 110, tetraethylammonium hydroxide 25, HCl 20, EGTA 11, HEPES 10, CsCl2 20, CaCl2 1, MgATP 4, Na2GTP 0.3 and Na-Creatine phosphate 7. The pH of this solution was adjusted to 7.20 with tetraethylammonium hydroxide. Both stock solutions of morphine and fentanyl (both from Sigma Aldrich) were prepared in water and diluted in the external recording solution to their final concentration. The agonists were applied to the neuron under study with a custom-designed gravity-fed microperfusion system.
Statistical Analysis
Both data and statistical analyses were carried out with Igor Pro (WaveMetrics, Inc., Lake Oswego, OR) and Prism (GraphPad Software, Inc., La Jolla, CA) software packages, respectively. The acquired curved fits (using the Hill equation) for each data set were compared employing an F test with a P value < 0.05 considered statistically significant. Further, the plotted data shown in Figure 1 was compared employing a two-tailed, unpaired t test with a P value < 0.05 considered statistically significant.
Figure 1.
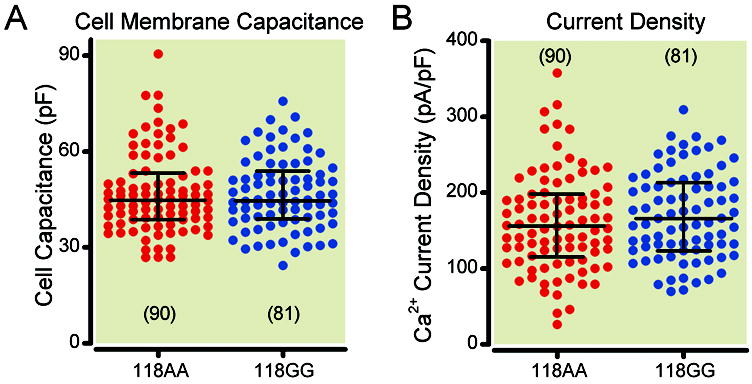
Summary scatter plots of mean membrane capacitance (picoFarads, pF) and Ca2+ current density (picoAmperes/picoFarads, pA/pF) in 118AA and 118GG carrier mice. Membrane capacitance (A) was determined from the numerical integration of a transient elicited with a depolarizing pulse from -80 mV to -70 mV before electronic compensation. Current density (B) was calculated from the peak Ca2+ current amplitude at a test pulse of -15 mV normalized to membrane capacitance. The lines on the plots represent the median with the interquartile range. No significant differences between groups were found employing the two-tailed, unpaired t test for A (P = 0.92) and B (P = 0.32). Numbers in parenthesis indicate the number of neurons tested.
Antinociception Testing
Mice were housed (3-5 per cage) in climate controlled (22 ± 2°C) rooms on a normal 12 hour light cycle (lights on 7 AM) with food and water available ad libitum until the day of testing. The mice were separated into individual cages the morning prior to testing. These procedures were approved by the Gallo Center Institutional Animal Care and Use Committee (Emeryville, CA) and were in accordance with National Institutes of Health guidelines for the Humane Care and Use of Laboratory Animals.
Antinociception was assessed using the hotplate latency test. Individual mice were placed on the hotplate, set at 52 ± 0.02°C, and observed for the first behavioral signs of nociception (time to lick/flick their front and hind paws and jump from the hotplate). A cut-off time of 60 s was used to minimize tissue damage. Predosing reaction times were the average of the three readings taken approximately 15 min apart. After subcutaneous administration of morphine (3 mg/kg) (or saline) antinociceptive testing was performed at the following times: 15, 30, 45, 60, 75, 90 and 180 min. Hotplate latency times were then converted to % maximal possible effect (MPE) using the following formula28:
All data are presented as the mean (± s.e.m.). The %MPE was calculated using Microsoft Excel (Microsoft Corp., Redmond, WA) and Prism was used to calculate the area under the curve. Comparisons between experimental groups were made for the area under the %MPE versus time curve (extent and duration of morphine antinociception; %MPE area under the curve) and performed using the Student’s t test as implemented in the SigmaStat (Aspire Software International, Ashburn, VA) statistical analysis package.
Results
Comparison of Biophysical Parameters of Sensory Neurons from 118AA and 118GG Mice
In the first set of experiments, the biophysical parameters of TG neurons isolated from 118AA and 118GG mice were compared. Figure 1A shows the neuron capacitance, a measure of cell size, between both 118AA and 118GG group of neurons. The results show that the two groups were nearly identical (two-tailed, unpaired t test, P = 0.92). Further, Figure 1B shows the Ca2+ current density of both neuron sets. The statistical comparison of this parameter showed that there were no significant differences between both groups (two-tailed, unpaired t test, P = 0.32).
Figure 2 shows the current voltage (I-V) relationships of acutely dissociated TG neurons from both 118AA and 118GG mice. The Ca2+ currents were recorded employing the whole-cell variant of the patch-clamp technique and elicited with a 70 ms depolarizing step to various test pulse potentials from a holding potential of -80 mV. The current amplitude was measured isochronally 10 ms from the beginning of the test pulse. The normalized I-V curves shown in Figures 2A and 2C were recorded from 118AA (n = 36 to 58) and 118GG (n = 42 to 56) neurons, respectively. Both curves indicate that the inward current began to activate near -40 mV and reached a peak amplitude at -15 mV. Figures 2B and 2D depict superimposed Ca2+ current traces from a representative 118AA and 118GG neuron, respectively. As a result, the morphine and fentanyl concentration-response relationships described below were measured at the test potential to -15 mV from a holding potential of -80 mV. Overall, these results indicate that acutely isolated TG sensory neurons exhibited similar physical and Ca2+ channel characteristics.
Figure 2.
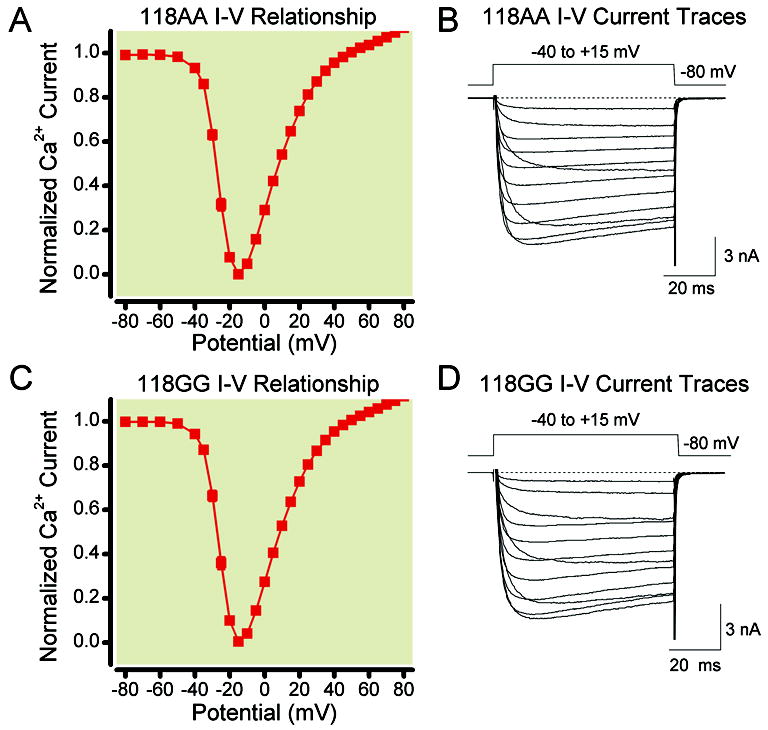
Normalized current-voltage (I-V) curves of Ca2+ currents evoked with a 70 ms pulse from a holding potential of -80 mV to test potentials between -80 and +60 mV in mice carrying the 118AA (A) and 118GG (C) alleles. The current amplitude was measured 10 ms after the onset of the test pulse and normalized to the amplitude at -15 mV. The data in A and C represent the mean (± s.e.m.) Ca2+ current amplitude for each test potential. The number of neurons depicted in A is 58 for test potentials from -80 to -40 mV, 36 for -35 mV, 57 for +45 to +55 mV and 55 for +60 mV. In C, the number of neurons shown is 56 for all test potentials, except for -35 mV where 42 recordings were acquired. The Ca2+ current traces in B and D correspond to a sensory neuron isolated from 118AA and 118GG allele carriers, respectively. The currents were elicited from a holding potential of -80 mV to the indicated test potentials applied every 3 s.
Time Course of Morphine Block and Concentration-Response Relationships
In this set of experiments, the morphine concentration-response relationship was determined. Figure 3 shows the time courses of peak Ca2+ current amplitude obtained before and during application of morphine (10 μM) in 118AA and 118GG sensory neurons, respectively. The Ca2+ currents were evoked every 10 s with a 50 ms test pulse to -15 mV from a holding potential of -80 mV (shown in Figure 3B). The peak current amplitude was measured isochronally 10 ms after the initiation of the test pulse. Figure 3B shows the numbered Ca2+ current traces evoked with this paradigm and correspond to those plotted in Figure 3A. Exposure of the neuron to morphine (trace 2) resulted in approximately 45% inhibition of the Ca2+ current. Removal of morphine resulted in a rapid recovery of the current amplitude. The time course of a 118GG neuron in Figure 3C shows the effect of morphine on the peak Ca2+ current and the corresponding numbered traces are shown in Figure 3D. The application of morphine to the neuron led to a 27% inhibition of the current, and the time of recovery after agonist removal was fast.
Figure 3.
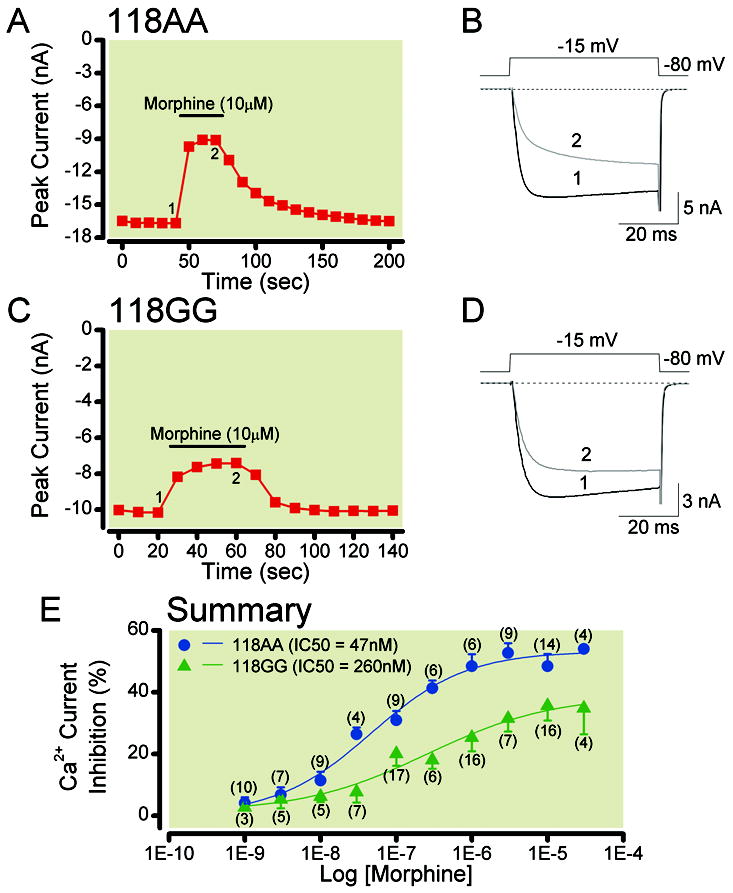
Morphine concentration-response relationships of acutely dissociated TG neurons isolated from humanized mice expressing the MOR 118AA (A) or 118GG (C) allele. Time courses of Ca2+ current inhibition acquired during morphine (10 μM) application in a sensory neuron from 118AA (A) and 118GG (C) mice. The currents were evoked every 10 s by a single 70 ms test pulse to -15 mV from a holding potential of -80 mV (shown in 3B). Peak current amplitudes were determined isochronally 10 ms after depolarization. The filled bars indicate application of 10 μM morphine. B and D show the superimposed Ca2+ currents before (black, 1) and during (grey, 2) morphine application shown in A and C. The concentration-response relationships of 118AA and 118GG sensory neurons exposed to morphine are illustrated in E. Each point represents the mean (± s.e.m.) of the morphine-mediated Ca2+ current inhibition. The numbers in parenthesis indicate the number of neurons that were tested. The smooth curves were obtained by fitting the points to the Hill equation and the IC50 (nM) values for 118AA (●) and 118GG (▲) are shown in the inset. The curve fits for each group were significantly (P < 0.0001) different from each other. MOR = mu opioid receptors; TG = trigeminal ganglion.
The morphine concentration-response curves for 118AA (●) and 118GG (▲) sensory neurons are plotted in Figure 3E. The data points in both groups were fit to the Hill equation. The IC50 (nM), maximum current inhibition (%, ± s.e.m.) and Hill coefficient (± s.e.m.) for 118AA neurons were: 47 [19 to 115], 53 ± 2.4 [47 to 59] and 0.70 ± 0.16 [0.29 to 1.10] (95% confidence intervals are in brackets); and 260 [54 to 1250], 39 ± 2.6 [26 to 52] and 0.53 ± 0.22 [-0.004 to 1.06] for 118GG neurons, respectively. The plots show that in 118AA sensory neurons, morphine exhibited just over a 5-fold greater potency and a higher efficacy than 118GG neurons. The statistical comparison of both fits showed that they were significantly different (P < 0.0001).
In another set of experiments, a morphine concentration-response curve was obtained in TG neurons isolated from the parent C57/BL6 line (i.e. not modified genetically). The data showed that the curves for 118AA and parent mice neurons were similar (data not shown). The IC50 (nM), maximum current inhibition (%, ± s.e.m.) and Hill coefficient (± s.e.m.) values were 99 [22 to 434], 50 ± 5.0 [37 to 62], and 1.23 ± 0.26 [-0.81 to 3.28], respectively (n = 4 to 19 neurons; 95% confidence intervals are in brackets). Statistical comparison of 118AA and parent wild-type neuron curve fits did not reach significance (P = 0.69). Thus, the TG neurons isolated from homozygous AA mice and the parent colony did not show detectable differences in the morphine-mediated Ca2+ current inhibition.
Comparison of Fentanyl Block and Concentration-Response Relationships in TG Neurons
In the next series of experiments, we examined whether the fast-acting opioid agonist fentanyl would exhibit a similar pharmacological profile with regard to Ca2+ channel inhibition. Figure 4 shows the time course of peak Ca2+ current inhibition in 118AA (Figure 4A) and 118GG (Figure 4C) neurons before and during fentanyl (10 μM) application. Ca2+ channel currents were evoked with a 50 ms test pulse to -15 mV from a holding potential of -80 mV applied every 10 s. The traces shown in Figure 4B and Figure 4D correspond to the numbers for 118AA and 118GG neurons, respectively. As described for morphine above (see Results, page 12, first paragraph) in 118AA neurons, exposure to fentanyl led to a 52% (Figure 4A) and 61% (Figure 4C) inhibition of Ca2+ currents. It can be seen that following fentanyl removal the period of recovery was longer when compared to that observed with morphine (cf. Figure 3A and Figure 3C). Figure 4E is a plot that compares the fentanyl concentration-response relationships for 118AA (●) and118GG (▲) neurons. The data points were also fitted to the Hill equation as described above (see Materials and Methods, pages 7 to 8, second paragraph). It can be seen that the curves for both group of neurons were nearly identical. The IC50 (nM), maximum current inhibition (%, ± s.e.m.) and Hill coefficient (± s.e.m.) for 118AA neurons were: 62, 52 ± 15.1 [4 to 100] and 0.55 ± 0.66 [-1.56 to 2.65] for 118AA neurons, respectively; while in 118GG neurons these values were: 102, 79 ± 89 [-204 to 363] and 0.31 ± 0.77 [-2.15 to 2.77]. The 95% confidence intervals are shown in brackets. Comparison of both curve fits did not show a significant difference (P = 0.63).
Figure 4.
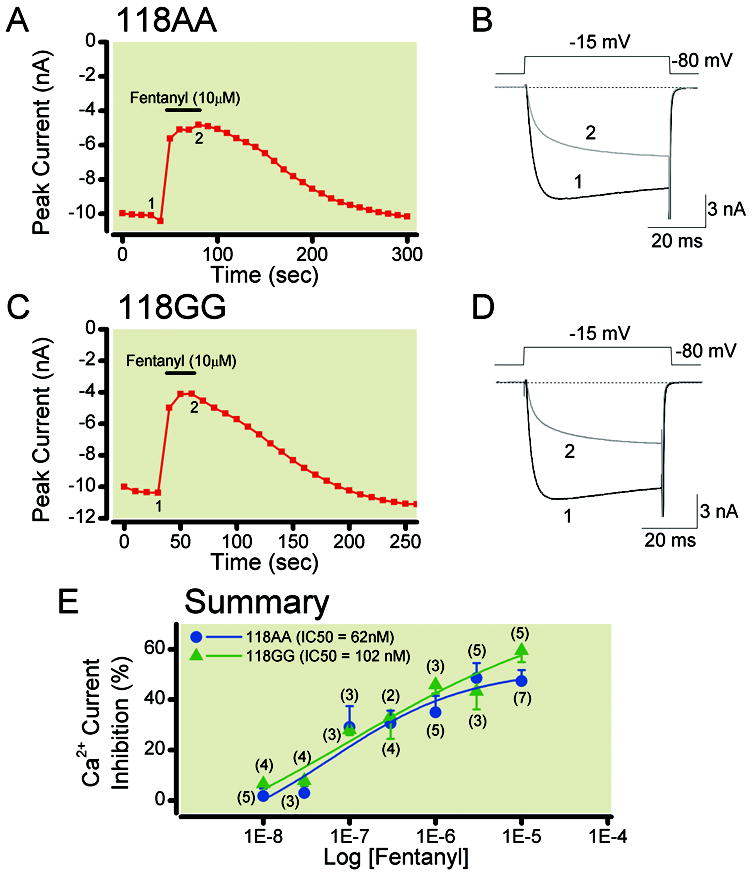
Fentanyl concentration-response relationships of acutely dissociated TG neurons isolated from humanized mice expressing the MOR 118AA (A) or 118GG (C) allele. Time courses of Ca2+ current inhibition acquired during fentanyl (10 μM) application in a sensory neuron from 118AA (A) and 118GG (C) mice. The currents were evoked every 10 s by a single 70 ms test pulse to -15 mV from a holding potential of -80 mV (shown in 4B). Peak current amplitudes were determined isochronally 10 ms after depolarization. The filled bars indicate application of 10 μM fentanyl. B and D show the superimposed Ca2+ currents before (black, 1) and during (grey, 2) fentanyl application shown in A and C. The concentration-response relationships of 118AA and 118GG sensory neurons exposed to fentanyl are depicted in E. Each point represents the mean (± s.e.m.) of the fentanyl-mediated Ca2+ current inhibition, except 0.03 μM fentanyl (▲) where n = 2. The numbers in parenthesis indicate the number of neurons that were tested. The smooth curves were obtained by fitting the points to the Hill equation and the IC50 (nM) values for 118AA (●) and 118GG (▲) are shown in the inset. The curve fits for each group were not significantly different from each other (P = 0.63). MOR = mu opioid receptors; TG = trigeminal ganglion.
Comparison of the Morphine-Mediated Analgesia in both Humanized Mouse Lines
Due to the significant pharmacological shift of the morphine concentration responses in 118GG relative to 118AA neurons, we next measured the antinociceptive response to morphine in both humanized mouse lines. Morphine (3 mg/kg) was administered subcutaneously and the change in response latency was measured and converted to %MPE (Figure 5A) as described above (see Materials and Methods, page 9, second paragraph). In addition, the %MPE area under the curve was calculated to determine the extent and duration of morphine antinociception for both genotypes. The data depicted in Figure 5B show that 118AA mice had a significantly (P < 0.05) greater %MPE area under the curve when compared to 118GG. These results suggest that the 118GG carrying mice exhibited an impaired analgesic response with morphine.
Figure 5.
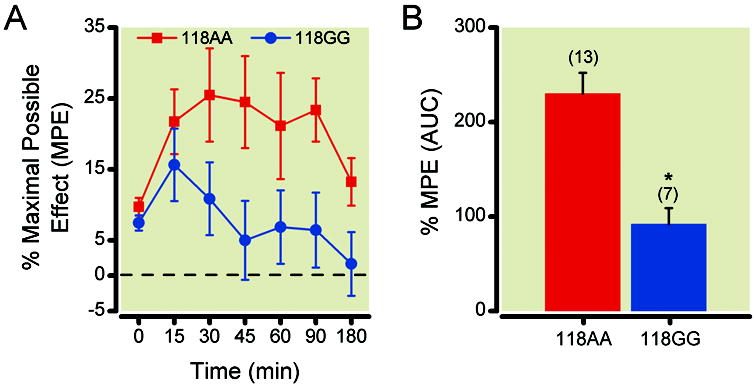
Morphine-mediated antinociceptive responses employing the hotplate assay in humanized mice expressing the MOR 118AA (●) or 118GG (▲) allele. Humanized 118AA (n = 13) and 118GG (n = 7) mice were administered morphine (3 mg/kg) subcutaneously and the antinociceptive response was determined employing the hotplate apparatus. Thereafter, the % maximal possible effect (MPE) (5A) and %MPE area under the curve (AUC) (5B) were determined. All data are presented as the mean (± s.e.m.); * indicates P < 0.05 employing the Student’s t test. MOR = mu opioid receptors.
Discussion
Recently, we described the generation of two humanized mouse lines in which the native MOR’s exon 1 was replaced with human exon 1 that encompasses the polymorphism25. Our initial study presented evidence for the 118G allele to be a gain-of-function variant with regard to dopamine response to an alcohol challenge, but did not address whether it moderates morphine responses relevant to analgesia. Thus, the present study examined the pharmacological profile of MOR in sensory neurons isolated from homozygous mice expressing either 118AA or 118GG allele. The main finding was a differential response of 118GG sensory neurons to morphine when compared to 118AA neurons. Neurons expressing the variant allele exhibited a five-fold decrease of the morphine-mediated Ca2+ current inhibition potency (IC50) as well as a 26% decrease in efficacy. Furthermore, when both groups of mice were tested for morphine requirement on a hotplate assay, the 118GG homozygous mice displayed a diminished response for up to 3 hours when compared to 118AA mice. These behavioral assays strongly support our electrophysiological observations which suggest that the mutant MOR exhibits an altered morphine pharmacological profile. These results are in agreement with several clinical studies which have shown that carriers of the mutant allele require an increase of the dosing requirements to achieve analgesia or adequate pain control2-3,29.
It is known that, unlike most opiates (i.e. fentanyl, etorphine, DAMGO and β-endorphin), morphine exhibits a unique pharmacological profile with a propensity to promote slower and incomplete receptor internalization with a typical exposure time greater than 5 min30. In our electrophysiological experiments, exposure of the cells to morphine was generally less than 40 seconds (see Figure 3A and Figure 3C). Hence, the observed difference is not likely a result of significant altered receptor internalization rates. Nevertheless, our data suggest that the physiological response of the opioid receptor variants is ligand-dependent and that morphine’s ‘recognition’ of the mutant receptor diminishes its analgesic effectiveness.
Given the heterogeneous nature of sensory neurons, the electrophysiological experiments were performed in cells with comparable biophysical characteristics, including cell size, Ca2+ channel current density, and peak current potential. Thus, it is unlikely that the effects observed with morphine were a result of employing different cell subpopulations. In addition, the electrophysiological data obtained from sensory neurons isolated from the parent mice were not significantly different from the 118AA group. Also differences in MOR density between 118AA and 118GG neurons are unlikely to account for our findings. Binding assays, which measured receptor density in several brain regions, showed no significant differences in our mouse model25. Moreover a recent study, also performed in postmortem human brain areas involved in nociception, found that receptor density of MOR was not different between 118AA and 118GG carriers24. However, another report found lower MOR messenger RNA in postmortem human brain tissue from 118G individuals compared to both heterozygous or 118AA subjects22. However, in this study protein levels were not assessed.
The A118G single nucleotide polymorphism has been reported to be associated with elevating27 or decreasing11,31 the pain threshold of the 118G allele carriers. Healthy volunteers carrying the variant allele, for example, have been shown to have higher pain (i.e. pressure) threshold when compared to homozygous 118A subjects27. On the other hand, it has been reported that the morphine requirement for post cesarean analgesia and pain scores in patients homozygous for the 118A allele were significantly lower than carriers of the 118G allele (either 118AG or 118GG)11. This conflicting effect of the polymorphism on pain threshold may be a result of an endogenous opioid that exerts opposite effects on the variant receptors (i.e. higher receptor affinity) than that observed with morphine. For instance, a recent study in healthy volunteers found that carriers of the 118G allele displayed an enhanced cortisol response to naloxone but a dampened response to psychosocial stress compared to 118A carriers32. The authors suggested that with a higher MOR affinity, 118G allele carriers have a greater inhibitory opioidergic tone on corticotropin releasing hormone neurons in the arcuate nucleus. As a result, exposure to naloxone led to the enhanced cortisol response32. Thus, the blunted response to psychological stress may result from a higher affinity of the mutant receptor, for this native opioid ligand brings about a differential response from the hypothalamic-pituitary-adrenal axis. It is, therefore, tempting to speculate that under normal conditions, the 118G allele imparts a ‘protective’ effect on carriers with a higher pain threshold. However, once that threshold is reached, 118G carriers will require higher amounts of opiates to achieve adequate pain control33 that may, unfortunately, not be obtained. As a result, the likelihood of addiction is increased and detrimental to this patient population.
Unlike the effects described with morphine above, the fentanyl pharmacological profile of 118AA and 118GG sensory neurons was similar. These results differ from two clinical studies which have reported that 118G allele carriers required more12 or less5 fentanyl for anesthesia than 118A carriers. It is unclear why fentanyl-mediated Ca2+ channel inhibition would be comparable in both types of sensory neurons in our mouse model and exert a different effect in the clinical setting5,27. Our model system consists of acutely dissociated neurons, and thus, the influence of other neurons (either pre- or postsynaptically) or glial cells is removed. Further, under our recording conditions, the temporal resolution is in the ms to s range and the exposure of the neurons to the receptor agonists is limited. The conditions observed in vivo are significantly more complex. In the clinical setting, for instance, there are varied routes of administration; morphine metabolism that is influenced by gender, age, disease state; and different rates of elimination.
Additionally, we previously found that the DAMGO and β-endorphin pharmacology were also similar in sensory neurons between 118AA and 118GG allele carriers25. These findings differed from a study that reported a 3-fold increase in potency by β-endorphin with regard to activating G protein-gated inwardly rectifying K+ channels in frog oocytes expressing 118G MOR when compared to 118A receptors1. The difference between morphine and these three other opioid receptor agonists may be due to differences in the physical binding to the receptors (see Discussion, page 14, second paragraph, 4th-6th sentences) or the signaling components (i.e. heterotrimeric G proteins) that couple each MOR subtype and effectors (i.e. ion channels and enzymes) are different or there are other differences between each model system employed (i.e. native vs. heterologous expression levels).
Our humanized mouse line model differs from that of Blendy and colleagues who first reported a murine model of the A118G polymorphism34. In that model, the equivalent nucleotide substitution was performed at position 112 (A112G) of the MOR gene. The result was a similar amino acid substitution (N38D) at the N-terminus and the loss of the putative glycosylation site. However, whereas the receptor polymorphism in humans results in the loss of 1 of 5 putative glycosylation sites (our mouse model), the polymorphism in Blendy’s model removes 1 of 4 glycosylation sites. Nevertheless, our electrophysiological and behavioral studies with morphine are in agreement with their observations of the morphine-mediated anti-nociception with the hot-plate assay. In a cumulative dosing paradigm, they found that 112GG carriers exhibited a significantly lower maximal possible effect of morphine34. These results suggest that morphine’s effects in mutant receptor carriers will be manifested with either three or four glycosylation sites. The loss of the glycosylation site may be significant in decreasing the opioid receptor’s ability to dimerize with other opioid receptors35. For example, the loss of the glycosylation site in β1-adrenergic receptors has been reported to markedly decrease both the ability of the receptor to dimerize and reach the cell surface36.
Previous in vitro studies that examined how the A118G polymorphism affected signaling mechanisms and receptor function relied on the heterologous expression of the receptors. Some of the reported observations indicated that the results were affected by cell type and transfection method employed17,19,37. The advantage of the humanized mouse model used in our study is that the underlying mechanisms of the opiate inter-variability observed clinically can be investigated directly in cells from tissue that is involved in pain transmission.
In summary, this is the first electrophysiological study to employ an animal model and examine the functional consequence of the A118G polymorphism in sensory neurons with regard to opioid-mediated Ca2+ current inhibition. The experiments were performed in neurons that had comparable biophysical parameters. The data for the morphine pharmacological profile of the 118GG carriers illustrated a diminished potency and efficacy resembling the clinical, behavioral, and in vitro observations. On the other hand, no significant pharmacological differences between both groups of neurons were observed when fentanyl was employed. From the data we conclude that the use of the humanized mouse line will be a valuable tool to further explore the signal transduction pathways that mediate the changes in morphine pharmacology in 118GG patients.
Acknowledgments
Supported in part by National Institute of Arthritis and Musculoskeletal and Skin Diseases (Bethesda, MD, USA) research grant AR-059397 to V. Ruiz-Velasco and intramural National Institute on Alcohol Abuse and Alcoholism (Bethesda, MD, USA) funds to M. Heilig.
References
- 1.Bond C, LaForge KS, Tian M, Melia D, Zhang S, Borg L, Gong J, Schluger J, Strong JA, Leal SM, Tischfield JA, Kreek MJ, Yu L. Single-nucleotide polymorphism in the human mu opioid receptor gene alters β-endorphin binding and activity: Possible implications for opiate addiction. Proc Natl Acad Sci U S A. 1998;95:9608–13. doi: 10.1073/pnas.95.16.9608. [DOI] [PMC free article] [PubMed] [Google Scholar]
- 2.Lötsch J, Geisslinger G. Are μ-opioid receptor polymorphisms important for clinical opioid therapy? Trends Mol Med. 2005;11:82–9. doi: 10.1016/j.molmed.2004.12.006. [DOI] [PubMed] [Google Scholar]
- 3.Mayer P, Höllt V. Pharmacogenetics of opioid receptors and addiction. Pharmacogenet Genomics. 2006;16:1–7. doi: 10.1097/01.fpc.0000182781.87932.0d. [DOI] [PubMed] [Google Scholar]
- 4.Kolesnikov Y, Gabovits B, Levin A, Voiko E, Veske A. Combined catechol-O-methyltransferase and μ-opioid receptor gene polymorphisms affect morphine postoperative analgesia and central side effects. Anesth Analg. 2011;112:448–53. doi: 10.1213/ANE.0b013e318202cc8d. [DOI] [PubMed] [Google Scholar]
- 5.Landau R, Kern C, Columb MO, Smiley RM, Blouin JL. Genetic variability of the μ-opioid receptor influences intrathecal fentanyl analgesia requirements in laboring women. Pain. 2008;139:5–14. doi: 10.1016/j.pain.2008.02.023. [DOI] [PMC free article] [PubMed] [Google Scholar]
- 6.Klepstad P, Rakvåg TT, Kaasa S, Holthe M, Dale O, Borchgrevink PC, Baar C, Vikan T, Krokan HE, Skorpen F. The 118A>G polymorphism in the human μ-opioid receptor gene may increase morphine requirements in patients with pain caused by malignant disease. Acta Anaesthesiol Scand. 2004;48:1232–9. doi: 10.1111/j.1399-6576.2004.00517.x. [DOI] [PubMed] [Google Scholar]
- 7.Klepstad P, Dale O, Skorpen F, Borchgrevink PC, Kaasa S. Genetic variability and clinical efficacy of morphine. Acta Anaesthesiol Scand. 2005;49:902–8. doi: 10.1111/j.1399-6576.2005.00772.x. [DOI] [PubMed] [Google Scholar]
- 8.Fukuda K, Hayashida M, Ide S, Saita N, Kokita Y, Kasai S, Nishizawa D, Ogai Y, Hasegawa J, Nagashima M, Tagami M, Komatsu H, Sora I, Koga H, Kaneko Y, Ikeda K. Association between OPRM1 gene polymorphisms and fentanyl sensitivity in patients undergoing painful cosmetic surgery. Pain. 2009 Dec;147:194–201. doi: 10.1016/j.pain.2009.09.004. [DOI] [PubMed] [Google Scholar]
- 9.Walter C, Lötsch J. Meta-analysis of the relevance of the OPRM1 118A>G genetic variant for pain treatment. Pain. 2009;146:270–5. doi: 10.1016/j.pain.2009.07.013. [DOI] [PubMed] [Google Scholar]
- 10.Chou WY, Wang CH, Liu PH, Liu CC, Tseng CC, Jawan B. Human opioid receptor A118G polymorphism affects intravenous patient-controlled analgesia morphine consumption after total abdominal hysterectomy. Anesthesiology. 2006;105:334–7. doi: 10.1097/00000542-200608000-00016. [DOI] [PubMed] [Google Scholar]
- 11.Sia AT, Lim Y, Lim EC, Goh RW, Law HY, Landau R, Teo YY, Tan EC. A118G single nucleotide polymorphism of human μ-opioid receptor gene influences pain perception and patient-controlled intravenous morphine consumption after intrathecal morphine for postcesarean analgesia. Anesthesiology. 2008;109:520–6. doi: 10.1097/ALN.0b013e318182af21. [DOI] [PubMed] [Google Scholar]
- 12.Zhang W, Chang YZ, Kan QC, Zhang LR, Lu H, Chu QJ, Wang ZY, Li ZS, Zhang J. Association of human μ-opioid receptor gene polymorphism A118G with fentanyl analgesia consumption in Chinese gynaecological patients. Anaesthesia. 2010;65:130–5. doi: 10.1111/j.1365-2044.2009.06193.x. [DOI] [PubMed] [Google Scholar]
- 13.Chou W-Y, Wang C-H, Liu P-H, Liu C-C, Tseng C-C, Jawan B. Human opioid receptor A118G polymorphism affects intravenous patient-controlled analgesia morphine consumption after total abdominal hysterectomy. Anesthesiology. 2006;105:334–7. doi: 10.1097/00000542-200608000-00016. [DOI] [PubMed] [Google Scholar]
- 14.Shi J, Hui L, Xu Y, Wang F, Huang W, Hu G. Sequence variations in the mu-opioid receptor gene (OPRM1) associated with human addiction to heroin. Hum Mutat. 2002;19:459–60. doi: 10.1002/humu.9026. [DOI] [PubMed] [Google Scholar]
- 15.Ray LA, Hutchison KE. A polymorphism of the μ-opioid receptor gene (OPRM1) and sensitivity to the effects of alcohol in humans. Alcohol Clin Exp Res. 2004;28:1789–95. doi: 10.1097/01.alc.0000148114.34000.b9. [DOI] [PubMed] [Google Scholar]
- 16.Huang J, Young B, Pletcher MT, Heilig M, Wahlestedt C. Association between the nociceptin receptor gene (OPRL1) single nucleotide polymorphisms and alcohol dependence. Addict Biol. 2008;13:88–94. doi: 10.1111/j.1369-1600.2007.00089.x. [DOI] [PubMed] [Google Scholar]
- 17.Arias A, Feinn I, Kranzler HR. Association of an Asn40Asp (A118G) polymorphism in the μ-opioid receptor gene with substance dependence: A meta-analysis. Drug Alcohol Depend. 2006;83:262–8. doi: 10.1016/j.drugalcdep.2005.11.024. [DOI] [PubMed] [Google Scholar]
- 18.Compton P, Geschwind DH, Alarcón M. Association between human μ-opioid receptor gene polymorphism, pain tolerance, and opioid addiction. Am J Med Genet B Neuropsychiatr Genet. 2003;121:76–82. doi: 10.1002/ajmg.b.20057. [DOI] [PubMed] [Google Scholar]
- 19.Chong RY, Oswald L, Yang X, Uhart M, Lin PI, Wand GS. The mu-opioid receptor polymorphism A118G predicts cortisol responses to naloxone and stress. Neuropsychopharmacology. 2006;31:204–11. doi: 10.1038/sj.npp.1300856. [DOI] [PubMed] [Google Scholar]
- 20.Hishimoto A, Cui H, Mouri K, Nushida H, Ueno Y, Maeda K, Shirakawa O. A functional polymorphism of the μ-opioid receptor gene is associated with completed suicides. J Neural Transm. 2008;115:531–6. doi: 10.1007/s00702-007-0853-y. [DOI] [PubMed] [Google Scholar]
- 21.Kroslak T, Laforge KS, Gianotti RJ, Ho A, Nielsen DA, Kreek MJ. The single nucleotide polymorphism A118G alters functional properties of the human mu opioid receptor. J Neurochem. 2007;103:77–87. doi: 10.1111/j.1471-4159.2007.04738.x. [DOI] [PubMed] [Google Scholar]
- 22.Zhang Y, Wang D, Johnson AD, Papp AC, Sadée W. Allelic expression imbalance of human mu opioid receptor (OPRM1) caused by variant A118G. J Biol Chem. 2005;280:32618–24. doi: 10.1074/jbc.M504942200. [DOI] [PubMed] [Google Scholar]
- 23.Beyer A, Koch T, Schröder H, Schulz S, Höllt V. Effect of the A118G polymorphism on binding affinity, potency and agonist-mediated endocytosis, desensitization, and resensitization of the human mu-opioid receptor. J Neurochem. 2004;89:553–60. doi: 10.1111/j.1471-4159.2004.02340.x. [DOI] [PubMed] [Google Scholar]
- 24.Oertel BG, Kettner M, Scholich K, Renné C, Roskam B, Geisslinger G, Schmidt PH, Lötsch J. A common human μ-opioid receptor genetic variant diminishes the receptor signaling efficacy in brain regions processing the sensory information of pain. J Biol Chem. 2009;284:6530–5. doi: 10.1074/jbc.M807030200. [DOI] [PubMed] [Google Scholar]
- 25.Ramchandani VA, Umhau J, Pavon FJ, Ruiz-Velasco V, Margas W, Sun H, Damadzic R, Eskay R, Schoor M, Thorsell A, Schwandt ML, Sommer WH, George DT, Parsons LH, Herscovitch P, Hommer D, Heilig M. A genetic determinant of the striatal dopamine response to alcohol in men. Mol Psychiatry. 2011;16:809–17. doi: 10.1038/mp.2010.56. [DOI] [PMC free article] [PubMed] [Google Scholar]
- 26.Zamponi GW, Lewis RJ, Todorovic SM, Arneric SP, Snutch TP. Role of voltage-gated calcium channels in ascending pain pathways. Brain Res Rev. 2009;60:84–9. doi: 10.1016/j.brainresrev.2008.12.021. [DOI] [PMC free article] [PubMed] [Google Scholar]
- 27.Fillingim RB, Kaplan L, Staud R, Ness TJ, Glover TL, Campbell CM, Mogil JS, Wallace MR. The A118G single nucleotide polymorphism of the μ-opioid receptor gene (OPRM1) is associated with pressure pain sensitivity in humans. J Pain. 2005;6:159–67. doi: 10.1016/j.jpain.2004.11.008. [DOI] [PubMed] [Google Scholar]
- 28.Brady LS, Holtzmann SG. Analgesic effects of intraventricular morphine and enkephalins in nondependent and morphine-dependent rats. J Pharmacol Exp Ther. 1982;222:190–7. [PubMed] [Google Scholar]
- 29.Mague SD, Blendy JA. OPRM1 SNP (A118G): Involvement in disease development, treatment response, and animal models. Drug Alcohol Depend. 2010;108:172–82. doi: 10.1016/j.drugalcdep.2009.12.016. [DOI] [PMC free article] [PubMed] [Google Scholar]
- 30.Connor M, Osborne PB, Christie MJ. Mu-opioid receptor desensitization: Is morphine different? Br J Pharmacol. 2004;143:685–96. doi: 10.1038/sj.bjp.0705938. [DOI] [PMC free article] [PubMed] [Google Scholar]
- 31.Oertel BG, Schmidt R, Schneider A, Geisslinger G, Lotsch J. The mu-opioid receptor gene polymorphism 118A>G depletes alfentanil-induced analgesia and protects against respiratory depression in homozygous carriers. Pharmacogenetics Genomics. 2006;16:625–36. doi: 10.1097/01.fpc.0000220566.90466.a2. [DOI] [PubMed] [Google Scholar]
- 32.Wand GS, McCaul M, Yang X, Reynolds J, Gotjen D, Lee S, Ali A. The mu-opioid receptor gene polymorphism (A118G) alters HPA axis activation induced by opioid receptor blockade. Neuropsychopharmacology. 2002;26:106–14. doi: 10.1016/S0893-133X(01)00294-9. [DOI] [PubMed] [Google Scholar]
- 33.Janicki PK, Schuler G, Francis D, Bohr A, Gordin V, Jarzembowski T, Ruiz-Velasco V, Mets B. A genetic association study of the functional A118G polymorphism of the human mu-opioid receptor gene in patients with acute and chronic pain. Anesth Analg. 2006;103:1011–7. doi: 10.1213/01.ane.0000231634.20341.88. [DOI] [PubMed] [Google Scholar]
- 34.Mague SD, Isiegas C, Huang P, Liu-Chen LY, Lerman C, Blendy JA. Mouse model of OPRM1 (A118G) polymorphism has sex-specific effects on drug-mediated behavior. Proc Natl Acad Sci USA. 2009;106:10847–52. doi: 10.1073/pnas.0901800106. [DOI] [PMC free article] [PubMed] [Google Scholar]
- 35.Levac BA, O’Dowd BF, George SR. Oligomerization of opioid receptors: Generation of novel signaling units. Curr Opin Pharmacol. 2002;2:76–81. doi: 10.1016/s1471-4892(02)00124-8. [DOI] [PubMed] [Google Scholar]
- 36.He J, Xu J, Castleberry AM, Lau AG, Hall RA. Glycosylation of β1-adrenergic receptors regulates receptor surface expression and dimerization. Biochem Biophys Res Comm. 2002;297:565–72. doi: 10.1016/s0006-291x(02)02259-3. [DOI] [PubMed] [Google Scholar]
- 37.Margas W, Zubkoff I, Schuler HG, Janicki PK, Ruiz-Velasco V. Modulation of Ca2+ channels by heterologously expressed wild-type and mutant human μ-opioid receptors (hMORs) containing the A118G single-nucleotide polymorphism. J Neurophysiol. 2007;97:1058–67. doi: 10.1152/jn.01007.2006. [DOI] [PubMed] [Google Scholar]