Abstract
Variability in risk of developmental defects caused by dioxin-like compounds (DLCs) has been demonstrated within and among several vertebrate species. Beyond our knowledge of the aryl hydrocarbon receptor (AHR) and its role in mediating toxicity for this class of compounds, little else is known concerning precise downstream targets influencing this vulnerability. In the present study, zebrafish with divergent genetic backgrounds were screened for susceptibility to developmental cardiotoxicity caused by the prototypical DLC, 3,3′,4,4′,5-pentachlorobiphenyl (PCB126); a range up to ∼40-fold differences was observed. Differentially sensitive zebrafish were chosen for a genetic cross, and the recombinant generation was used for genome-wide quantitative trait loci (QTL) mapping. Multiple QTLs were identified––several acting alone, one additively, and two others via epistatic interaction. Together, these QTLs account for 24% of the phenotypic variance observed in cardioteratogenicity resulting from PCB126 exposure (logarithm of the odds = 13.55, p = 1.89 × 10⁻¹⁰). Candidate genes in these QTL regions include the following: ahr2, bcor, and capn1 (Chr 22); e2f1 and pdyn (Chr 23); ctnnt2, plcg1, eno3, tgm1, and tgm2 (interacting on Chr 23); and vezf1 (Chr 15). These data demonstrate that DLC-induced cardiac teratogenicity is a multifactorial complex trait influenced by gene × gene and gene × environment interactions. The identified QTLs harbor many DLC-responsive genes critical to cardiovascular development and provide insight into the genetic basis of susceptibility to AHR-mediated developmental toxicity.
Keywords: polychlorinated biphenyls, dioxin, heart, development, quantitative trait loci, genetic susceptibility, aryl hydrocarbon receptor
Polychlorinated dibenzo-p-dioxins and structurally related dioxin-like compounds (DLCs), including coplanar polychlorinated biphenyls (PCBs), are potent teratogens that persist in the environment and pose significant risk to human and ecological health. Amid the toxic effects associated with DLC exposure, a mounting body of evidence suggests that the cardiovascular system is one of the primary targets during development. Aberrant morphogenesis and dysfunction of the heart are observed following early-life stage exposure. Among vertebrates, this cardiotoxicity is evolutionarily conserved.
The cardioteratogenic effects of DLCs have been most extensively studied in zebrafish. Exposure to 2,3,7,8-tetrachlorodibenzo-p-dioxin (TCDD) or 3,3′,4,4′,5-pentachlorobiphenyl (PCB126) arrests ventricular cardiomyocyte cell cycle (Antkiewicz et al., 2005), impairs atrioventricular and bulboventricular valve development (Grimes et al., 2008; Mehta et al., 2008), and prevents normal looping of the heart (Carney et al., 2006b). The hypoplastic heart is accompanied by a reduction in blood flow, pericardial edema, and a slowed heart beat with intermittent ventricular standstill (Antkiewicz et al., 2005). Morphological and functional deficits are also manifested in higher vertebrates following early-life stage DLC exposure.
Chicken embryos exposed to dioxin and dioxin-like PCBs exhibit compromised endocardial cushion, thin ventricular walls, a reduction in cardiomyocyte proliferation, reduced ventricular function, and edema (Ivnitski et al., 2001; Walker and Catron, 2000). Mice exposed in utero exhibit a dose-related decrease in heart-to-body weight ratio, interventricular septal defects, significant decrease in cardiomyocyte proliferation, and diminished heart rate (Lin et al., 2001; Thackaberry et al., 2005b).
Susceptibility to DLCs has been shown to vary within and among several piscine, avian, and mammalian species. Resistance to DLC-induced early-life stage effects has been observed in perch, tomcod, rainbow trout, and killifish populations residing in habitats with PCB-contaminated sediment (Carvalho et al., 2004; Forlin and Celander, 1995; Nacci et al., 1999; Wirgin et al., 2011; Yuan et al., 2006). Differences in susceptibility to DLC-induced cardiomyopathy between two breeds of chickens have been reported (Walker and Catron, 2000). Responsiveness to DLCs has also been shown to differ among lines of inbred mice (reviewed in Nebert, 1989). Moreover, in humans, differences in the inducibility of DLC-responsive genes have been reported (Micka et al., 1997).
Susceptibility to environmental toxicants is determined by an individual’s genetic background, environment, gene × environment interactions, and epistasis. In the postgenomic era, the interindividual variation that exists in DLC-induced cardiotoxicity can be leveraged to elucidate the genetic factors influencing vulnerability. Genome-wide comparisons of phenotypically discordant individuals can be made to link phenotypic variation to its underlying genetic basis, offering new insights into toxicological mechanisms and modes of action. In this study, a quantitative trait loci (QTL) analysis of PCB126-induced developmental cardiotoxicity was performed in zebrafish (Danio rerio). Genetically divergent strains of zebrafish were screened for differences in sensitivity to PCB126, and the most sensitive and tolerant strains were then chosen for a genetic cross. A bulk segregant analysis (BSA) was performed, comparing extreme discordant phenotypes from the recombinant generation. Candidate loci co-segregating with sensitivity differences were then chosen for QTL analysis. Herein, multiple QTLs are reported, identified from a genome-wide scan for single- and multiple-gene effects, including additive and epistatic interactions.
MATERIALS AND METHODS
Zebrafish maintenance, collection of embryos, and waterborne PCB126 exposure.
Zebrafish strains AB, TL, TU, and WIK were obtained from the Zebrafish Information Network Repository (University of Oregon, Eugene, OR), strain EKW was obtained from Ekwill Fish Farms (Gibsonton, FL), and strain PKR originated from Parker Tropical Fish farm (Ruskin, FL). Zebrafish were maintained according to described procedures (Westerfield, 1995). Embryos were exposed to vehicle (0.1% dimethyl sulfoxide), graded concentrations of PCB126 (0–320 ppb), or [14C]PCB169 (1μM; specific activity 12 μCi/μmol) for 1 h within 2 hours post-fertilization (hpf). At 144 hpf, larval zebrafish were evaluated for presence or absence of signs of DLC early-life stage toxicity––including abnormal looping of the heart, pericardial and yolk-sac edema, reduced heart rate, impaired swim bladder inflation, and craniofacial malformations. The proportion of individuals in each treatment group exhibiting overt toxic end points was determined, and the EC50 values for each strain were calculated using Probit Analysis software (U.S. Environmental Protection Agency, 2001).
DNA extraction and genotyping.
Genomic DNA was extracted from larval fish using column-based kits (DNeasy; Qiagen). PCR was performed using a 3-primer probe system (2.0μM [FAM-CACGACGTTGTAAAACGAC] added to the 5′-end of the forward primer; Schuelke, 2000) to fluorescently label amplicons. PCR conditions also included: 20mM Tris-HCl, pH 8.4, 50mM KCl, 1.5mM MgCl2, 1.0mM dNTPs, 0.2μM forward primer, 2.0μM reverse primer, 0.03 U of Taq, and 5 ng of template DNA per reaction. Thermal cycler (Tetrad; MJ Research/Bio-Rad) parameters were as follows: 3.0 min at 95°C (1 cycle); 30 s at 95°C, 30 s at 64°C, and 1.5 min at 72°C (repeat for 11 cycles, decreasing the annealing temperature by 0.8°C per cycle); 30 s at 95°C, 30 s at 54°C, and 1.5 min at 72°C (22 cycles); and then 15 min at 72°C (final extension). Amplified microsatellites were visualized using an ABI 3730 Genetic Analyzer (Applied Biosystems), and polymorphisms were scored using GeneMarker (v1.85; Softgenetics, LLC).
Genetic cross and BSA.
Zebrafish from the most PCB-sensitive and PCB-tolerant strains were crossed following a classic F2-intercross design. The recombinant generation (F2) was exposed to PCB126 (80 ppb) and phenotyped to determine sensitivity. F2 larvae were classified as “sensitive” if they exhibited significant edema, an incompletely looped (elongated) heart, and an obvious reduction in both heart rate and peripheral blood flow. Larvae were classified as “resistant” if they were indistinguishable from negative controls (no signs of toxicity). From these, two groups of 50––representing the most sensitive and most resistant fish—were pooled for BSA. The bulk samples were amplified with microsatellite markers (N = 234; Supplementary appendix 1) spanning the entire genome and were screened for skewed allelic frequency distributions dominated by the parental allele in its phenotypic class. Loci were identified as candidates if there was an overrepresentation of the sensitive parents’ allele in the sensitive bulk or an overrepresentation of the resistant parents’ allele in the resistant bulk.
QTL analysis.
Genetic linkage maps were constructed using MAPMAKER/EXP (1994). QTL analysis was performed using R/qtl (Broman et al., 2003)—an interactive environment for mapping QTLs, implemented thru the statistical language/software R (Ihaka and Gentleman, 1996). Individual phenotypes were handled as binomial (sensitive vs. resistant) and quantitative (ranked by heart rate) traits. Heart rate was used as a noninvasive indicator of cardiotoxicity (Rubinstein, 2006) in order to preserve sample integrity and ensure that a sufficient quantity of DNA could be obtained from each individual for a genome-wide survey. One-dimensional (1D) genome scans were explored using marker regression and interval mapping (Feenstra et al., 2006; Haley and Knott, 1992; Sen and Churchill, 2001); two-dimensional (2D) scans were performed by multiple imputation (Sen and Churchill, 2001). Higher-order QTL models were also explored by multiple imputation. Logarithm of the odds (LOD) thresholds for genome-wide significance were estimated by permutation (Churchill and Doerge, 1994).
RESULTS
Interstrain Variation in Sensitivity to PCB126
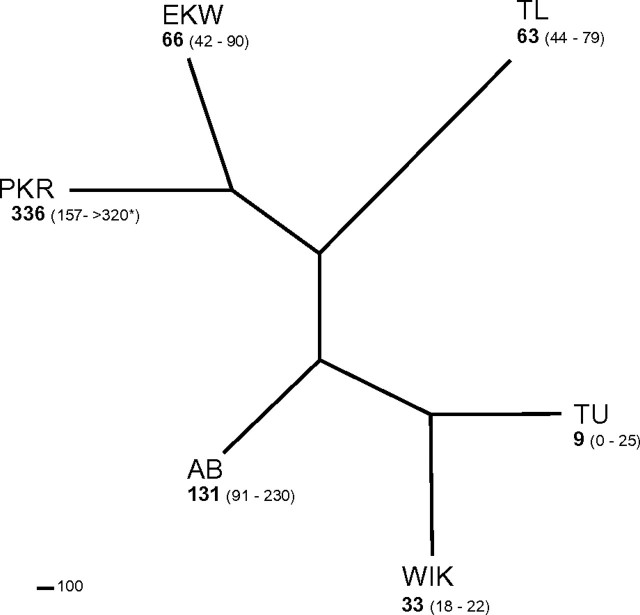
Differences in susceptibility among genetically divergent strains of zebrafish were observed at 144 hpf (Fig. 1; Supplementary tables S1a and S1b) based on the presence or absence of cardinal signs of DLC early-life stage toxicity—including reduced peripheral blood flow, pericardial and yolk-sac edema, impaired swim bladder inflation, and craniofacial malformation (see Carney et al., 2006b for illustration of DLC developmental toxicity). EC50 values ranged from 9 to 336 ppb (95% confidence interval: 0–25 and 179–8561 ppb, respectively) (Fig. 1; Supplementary table S1a).
FIG. 1.
The median effective concentration (EC50) at which the teratogenic effects of PCB126 were observed among genetically divergent zebrafish strains. EC50 values were determined, as described in the “Materials and Methods” section. Branch lengths reflect genetic distance; numbers in parentheses represent 95% confidence intervals. Details regarding genetic differentiation and interstrain sensitivity differences can be found in Supplementary table S1.
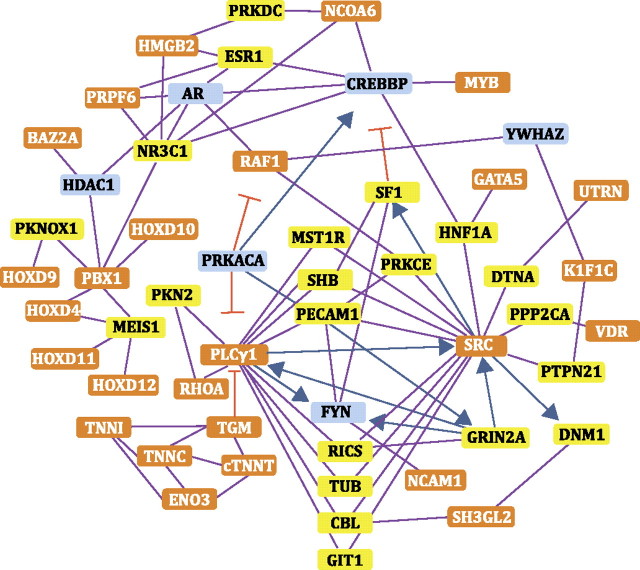
FIG. 7.
Interactome of loci colocalizing with the two QTLs (orange boxes) representing the epistatic interaction (cTNNT2::z59202). Yellow boxes represent significant intermediates (z-score > 2.5). Blue boxes represent intermediates with a z-score < 2.5.
The most sensitive (TU) and tolerant (PKR) strains were also evaluated for a decrease in heart rate, a commonly used indicator of cardiac toxicity (reviewed in Rubinstein, 2006) sensitive to DLC exposure (Antkiewicz et al., 2005). Following exposure to PCB126 at 80 ppb—a concentration found to be highly toxic for TU but not for PKR (Supplementary table S1a)— significant differences in heart rate were observed between vehicle controls and PCB126-exposed TU fish at 72 and 144 hpf. No differences were observed in heart rate at either time point for strain PKR (Fig. 2A). Additionally, no differences were observed in uptake of radiolabeled PCB between the two respective strains (data not shown, p = 0.20).
FIG. 2.
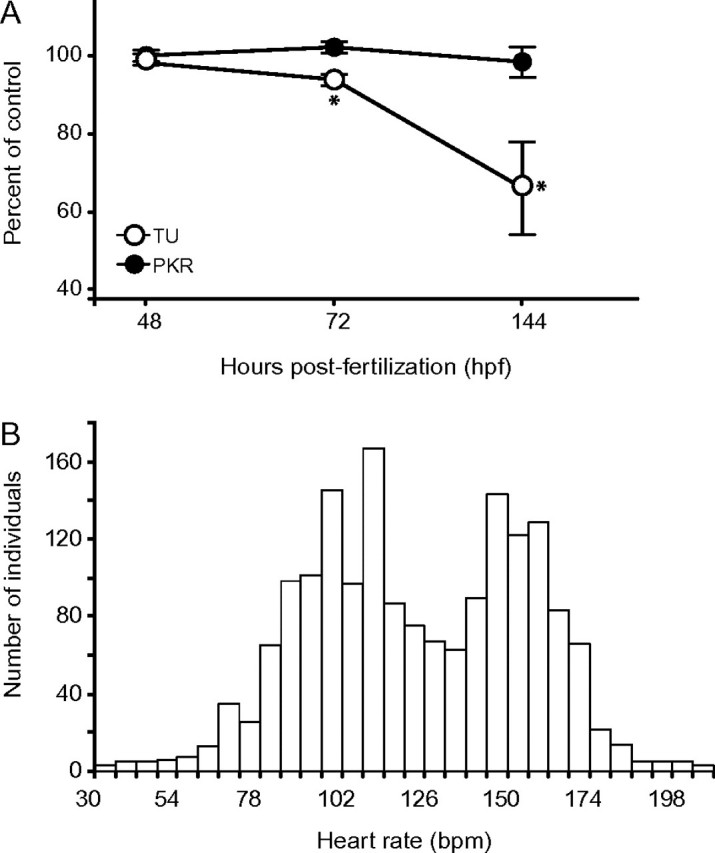
Phenotypic differences in heart function (bpm). (A) At 48, 72, and 144 hpf, following PCB126 exposure (80 ppb), as observed in the parental generation represented by TU (○) and PKR (•). Error bars represent ± 1 SEM, *Indicates significantly different from respective control. (B) Phenotypic distribution of sensitivity in the recombinant F2 generation. Heart rate (bpm), a noninvasive indicator of cardiotoxicity, is displayed.
Because 80 ppb PCB126 negatively impacts heart function and is teratogenic in sensitive TU fish but not the more tolerant PKR fish, this concentration was chosen to be used in subsequent exposures to maximize the genotype-to-phenotype signal for detecting loci associated with sensitivity differences.
Bulk Segregant Analysis
The genetic cross produced a recombinant population (N = 1750, F2) segregating for sensitivity to PCB126. A broad bimodal distribution of cardiotoxicity (Fig. 2b) was observed at 144 hpf, confirming penetrance of the genetic information responsible for interstrain vulnerability differences to the experimental generation. The BSA of “sensitive” (unlooped heart, reduced or absent peripheral blood flow, pericardial edema, and a heart rate of ≤84 beats per minute [bpm]) versus “resistant” (no morphological signs of toxicity, heart rate of 132–156 bpm) individuals identified nine candidate microsatellite markers co-segregating with phenotypic differences (Fig. 3). 2To confirm the skewed allelic frequency distributions observed, each individual (N = 100) represented in the bulks was genotyped independently and strength-of-association with sensitivity was determined (Single-Marker analysis; QTL Cartographer v3.0). Following validation, highly significant (p < 0.01) genotype-phenotype associations were identified for Z21982/Chr15, Z10321/Chr22, and Z10949/Chr23. Subsequent fine-mapping efforts were concentrated on defining the chromosomal regions linked to these three loci.
FIG. 3.
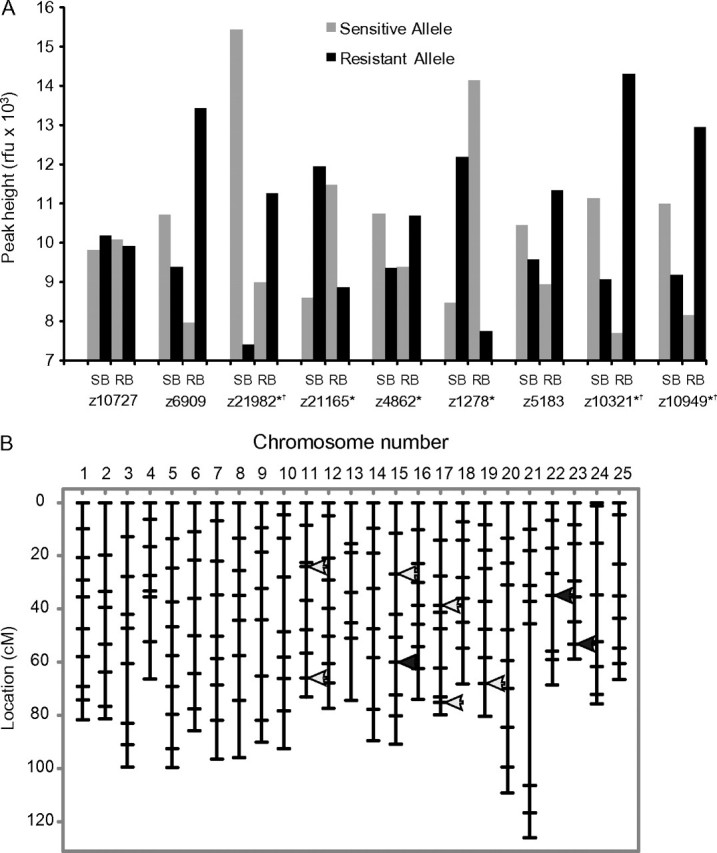
Microsatellite markers identified by BSA which cosegregate with sensitivity differences observed in the F2 bulks. (A) Relative peak intensities observed in sensitive and tolerant bulks for each candidate marker identified. Individuals from each bulk were genotyped independently to confirm skewed allele distributions (*p = 0.05, †p < 0.01). (B) Genomic location of candidates. Arrows indicate all candidate markers identified; solid arrows identify the loci found to be highly significant (qtl/Cartographer).
Linkage Mapping
To define and narrow the chromosomal regions representing QTLs, F2 larvae representing extreme discordant phenotypes (N = 116 sensitive; N = 113 tolerant) were genotyped with additional polymorphic microsatellite markers (Supplementary appendix 2) flanking the candidate loci identified by BSA. Due to the genomic location of the BSA candidate microsatellite markers, we also developed microsatellites located within the ahr2 (GB#HQ116647), ctnnt2a (GB#HQ116648), actc1b (GB#HQ116648), and myh7b (GB#HQ116650) genes to test for genotype-phenotype associations.
Single-point analysis (Mapmaker/QTL) identified a total of nine linkage groups with a coverage ranging from 8.2 to 75.9 cM (Supplementary fig. S1a and appendix 2). A 2D scan of recombination fractions (Supplementary fig. S1b) using R/qtl (Broman et al., 2003) verified the arrangement of these markers in each linkage group. The genetic maps representing the chromosomal regions genotyped are 100% concordant with the most current physical assembly of the zebrafish genome (Zv9, release 61, February 2011).
QTL Analysis
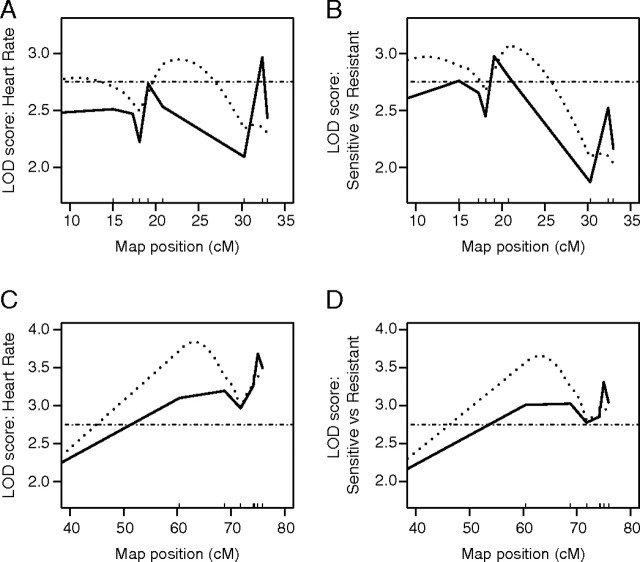
The 1D scan for main QTL controlling sensitivity to the teratogenic effects of PCB126 identified multiple QTL on chromosomes (Chr) 22 and Chr 23 (Figs. 4 and 5). Disagreement exists between marker regression and interval mapping approaches regarding the predicted location of QTL on Chr 22. Marker regression identified zAHR2 as the most significant QTL (at 19.1 cM, LOD = 2.98, p = 0.03) on Chr 22 when treating susceptibility as a binomial trait (sensitive vs. resistant). The genetic architecture surrounding the zAHR2 QTL (Fig. 4) suggests the presence of two additional QTL on Chr 22: one 4.1 cM upstream (at 15 cM, LOD = 2.76, p = 0.05) and another 13.4 cM downstream (at 32.4 cM, LOD = 2.52, p = 0.10). Ranking discordant phenotypes by severity of cardiotoxicity increases the strength of the QTL at 32.4 cM to LOD 2.97 (p = 0.03). Contrary to marker regression, interval mapping predicts a single QTL downstream from the ahr2 gene, just inside the adjacent interval (at 23 cM, LOD = 2.95, p = 0.03). On Chr 23, marker regression and interval mapping produced compatible results. The 1D scans identified two QTL––one at 62 cM (LOD = 3.81, p = 0.003) and the other at 75 cM (LOD = 3.43, p = 0.007).
FIG. 4.
LOD profiles of 1D genome scans for QTL associated with PCB126-induced cardioteratogenicity on Chr 22 (A and B) and Chr 23 (C and D). Sensitivity of each individual was considered as a binomial trait (sensitive vs. resistant; B and D) or quantitatively ranked by severity of cardiotoxicity (heart rate; A and C). Solid lines represent LOD profile determined by marker regression, dotted lines represent LOD profile determined by interval mapping, and the horizontal dashed line indicates significance threshold.
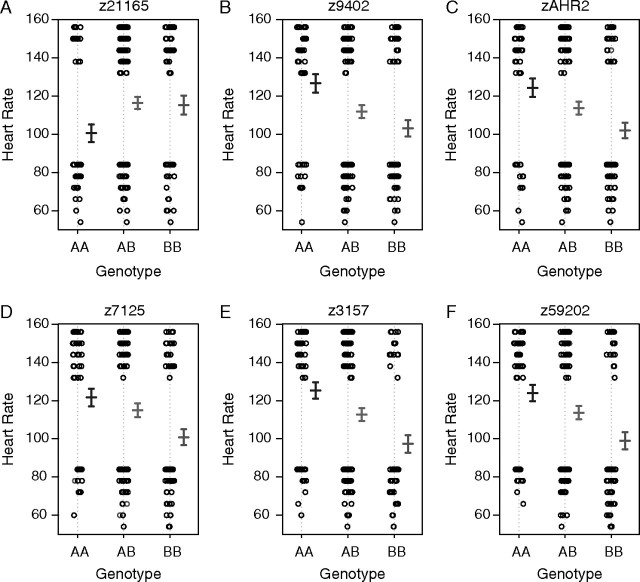
FIG. 5.
Main effect plots displaying the phenotype-to-genotype relationship for each marker closest to the QTLs identified by the 1D scan (A–F). For each marker genotype, the individual phenotype is plotted, with the mean of genotype AA, AB, and BB. Error bars represent ± 1 SEM. Microsatellite allele sizes (bp) for “AA” and “BB,” respectively, are 139/139 and 157/157 (z21165), 260/260 and 258/258 (z9402), 221/221 and 229/229 (zAHR2), 220/220 and 184/184 (z7125), 104/104 and 128/128 (z3175), and 267/267 and 234/260 (z59202).
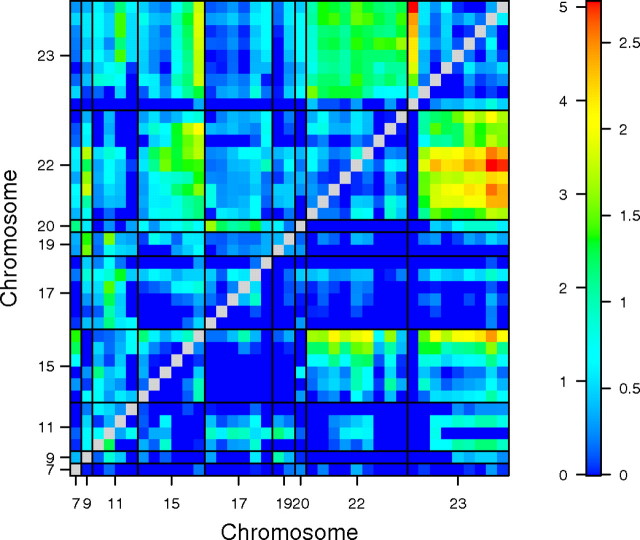
To test for additive and epistatic interactions, a genome × genome comparison was performed. The 2D scan (Fig. 6) revealed additive relationships involving the QTLs identified by the 1D scan and an additional QTL on Chr 15 (at 46.4 cM, LODadditive = 5.77, p = 0.008). The 2D scan also identified an epistatic interaction linked to markers at opposing ends of Chr 23 (cTNNT2::z59202). Alone, marker cTNNT2 cannot account for a significant portion of the phenotypic variance observed in the genetic cross (Table 1); however, when considered with z59202, the pair-wise interaction explains 14.01% of the phenotypic variance observed in sensitivity (LOD = 7.53, p = 4.45 × 10−05). In the full, multiple QTL model which allows for main, additive, and epistatic interactions, the total amount of variance in PCB126 sensitivity that can be explained by all QTL identified in this study is 24% (LOD = 13.55, p = 1.89 × 10⁻¹⁰).
FIG. 6.
Heat map of genome × genome scan for additive (lower diagonal) and epistatic (upper diagonal) interactions contributing to PCB126-induced cardiotoxicity. LOD legend for heat: Numbers on the left and right correspond to epistatic and additive LOD scores, respectively, for all pair-wise comparisons.
TABLE 1.
Percent Phenotypic Variance that Each QTL Represents
| QTL | Chr | Position (cM) | Nearest marker | (%) Variancea | p value |
| Q1 | 15 | 46.4 | z21165 | 4.43 | 0.005 |
| Q2 | 22 | 15 | z9402 | 5.64 | 0.001 |
| Q3 | 22 | 19.1 | AHR2 | 5.49 | 0.001 |
| Q4 | 22 | 32.4 | z7125 | 4.21 | 0.007 |
| Q5 | 23 | 0 | cTNNT2 | 1.47 | 0.187 |
| Q6 | 23 | 62 | z3157 | 7.05 | 0.000 |
| Q7 | 23 | 75.9 | z59202 | 5.94 | 0.000 |
| Q5:Q7 | 23 | 0::75.9 | cTNNT2::z59202 | 14.01 | 0.000 |
Note. Multiple QTL model: y ∼ Q1 + Q2 + Q3 + Q4 + Q5 + Q6 + Q7 + Q5:Q7. Total % variance explained by fully interacting model = 23.86%, LOD = 13.55, p = 2.6 × 10⁻¹⁰.
Single QTL model.
DISCUSSION
The genetic architecture of interindividual variation in sensitivity to the cardioteratogenic effects of PCB126 reveals that susceptibility is a complex trait influenced by multiple loci. The identified QTL intervals harbor DLC-responsive genes known to have roles in cardiovascular development and function. Intriguing candidate susceptibility loci include genes involved in cell cycle control, endocardial and myocardial development, cardiac sarcomere assembly, and, notably, the aryl hydrocarbon receptor (AHR).
Main QTLs on Chr 22
The predicted position of the QTL on Chr 22 varies depending on the method used for linkage analysis (Fig. 4). Interval mapping generally offers an improvement over marker regression, utilizing information between markers to provide a refined estimate of QTL location (Broman and Sen, 2009). However, interval mapping can mistakenly estimate multiple, closely linked QTL as a single (ghost) QTL with a larger effect at the wrong position (reviewed in Kao and Zeng, 2010). In the present study, marker regression identified three closely linked QTLs on Chr 22. The central QTL corresponds to a marker located within the ahr2 gene—the cytoplasmic receptor for dioxins and DLCs. The molecular mechanisms controlling DLC-induced teratogenesis are mediated by AHR, corroborating the results obtained by marker regression and lending support to the likelihood that the single QTL identified by interval mapping is indeed a ghost QTL.
The AHR has been shown to mediate sensitivity in multiple species. AHR-deficient mice are resistant to many effects of TCDD (Fernandez-Salguero et al., 1996), and morpholino gene knockdowns of the zebrafish ahr2 (Prasch et al., 2003) afford protection against DLC-induced cardiotoxicity. In DLC-resistant Atlantic killifish (Fundulus heteroclitus), there is a genome-wide loss of responsiveness in AHR signaling (Whitehead et al., 2010), and suppression of the AHR pathway rescues DLC-sensitive killifish from cardiac teratogenesis (Clark et al., 2010). Moreover, a genetic mutation was recently identified in the ahr2 gene of Atlantic tomcod which contributes to TCDD and PCB126 resistance (Wirgin et al., 2011).
Colocalizing with the QTL upstream from ahr2 is an attractive candidate—the BCL6 corepressor gene (bcor). Carney et al. (2006a) identified bcor as a member of the heart-specific transcriptome following TCDD exposure in zebrafish. BCOR is a key transcriptional regulator during early embryogenesis and is associated with congenital cardiac abnormalities, including septal and mitral valve defects (Ng et al., 2004). BCOR regulates the NOTCH-signaling pathway (Sakano et al., 2010)—an evolutionarily conserved intercellular mechanism essential for proper cardiac development (High and Epstein, 2008). In zebrafish, the NOTCH-signaling pathway is disrupted following early-life stage exposure to TCDD. The timing and location of NOTCH dysregulation corresponds to a deficit in valve formation and ventricular myocardium in these fish (Mehta et al., 2008).
Colocalizing with the QTL downstream from ahr2 is the capn1 gene encoding for calpain-1, which is known to induce myocardial dysfunction (Papp et al., 2000). Interestingly, this marker becomes a highly significant QTL when differentially sensitive zebrafish are ranked by heart function (Fig. 4). CAPN1 also mediates the dioxin-induced activation and downregulation of the AHR (Dale and Eltom, 2006), further supporting a possible role in susceptibility to DLCs.
Main QTL on Chr 23
In vertebrates, DLC-associated cardioteratogenicity is characterized by a hypoplastic heart with fewer smaller cardiomyocytes. In all models, a decrease in cardiomyocyte proliferation is observed (reviewed in Kopf and Walker, 2009). More than one gene colocalizing with the major Chr 23 QTL could contribute to the universal hypoplasia: transcription factor E2F1 (e2f1) and prodynorphin (pdyn). E2F1 is part of a transcriptional regulatory framework repressing the expression of genes involved in cell proliferation and organ morphogenesis following PCB exposure (Reymann and Borlak, 2006). In the heart-specific TCDD-responsive transcriptome, the expression of several G1/S-type cyclins under the control of E2F1 are repressed in both mice and zebrafish (Carney et al. 2006a; Thackaberry et al. 2005a). E2F1-dependent cell cycle progression is repressed following exposure to dioxins (Puga et al., 2000), and combinatorial interactions of E2F1 and AHR have been documented (Marlowe et al., 2008). PDYN orchestrates the differentiation of multipotent embryonic stem (ES) cells into beating cardiomyocytes by triggering the transcription of genes essential for cardiogenesis, including Nkx2.5 (Ventura and Maioli, 2000). Following exposure to TCDD, however, Nkx2.5 expression is repressed and fewer ES cells commit to becoming cardiomyocytes (Wang et al., 2010).
A cluster of Cyp2 genes also map to the main Chr23 QTL. CYP2 enzymes are well known to be involved in eicosanoid synthesis and degradation; functions of eicosanoid second-messengers include organogenesis and other developmental functions (reviewed in Nebert and Karp, 2008).
Interacting QTLs on Chr 23
The systems that underlie cellular, developmental, and physiological processes are complex and contain many elements that interact and regulate one another. Epistatic interactions among loci (i.e., when the phenotypic effect of one locus depends on the genotype at a second locus) often make a substantial contribution to variation in complex traits––including cardiovascular disease (Tsai et al., 2007). In the genetic cross described in this study, an interaction involving two QTLs on Chr 23, accounts for approximately half of the variance that can be explained by our model for sensitivity to PCB126-induced cardiotoxicity. Cross-referencing genes linked to the interacting QTL intervals with publicly available protein × protein interaction databases (Berger et al., 2007) revealed an extensive gene network (Fig. 7). This network contains loci responsive to DLC exposure that are known to have roles in cardiovascular development and function.
One of the interacting QTLs is anchored to a genetic marker located within the cardiac troponin T2 gene (ctnnt2), a component of the sarcomere responsible for heart contraction and found to be differentially expressed in DLC-sensitive versus tolerant Atlantic tomcod populations (Carlson et al., 2009). Linked to ctnnt2 is the plcγ1 gene encoding phospholipase Cγ1. PLCγ1-signaling provides the calcium transients required for ventricular contractility and affects key steps in vasculogenesis (Rottbauer et al., 2005). The companion interacting QTL is represented by a genetic marker tightly linked to the muscle-specific gycolytic isoenzyme, β-enolase (eno3) and transglutaminase isoforms 1 and 2 (tgm1 and tgm2). During development, ENO3 first appears in the cardiac heart tube and binds troponin with high affinity, where ATP is needed for contraction (Merkulova et al., 1997). In the heart, transglutaminase is responsible for cross-linking troponins (Bergamini et al., 1995; Gorza et al., 1996), interacts directly with PLCγ1 as a negative effector (Murthy et al., 1999), and has been implicated in multiple cardiac diseases (reviewed in Sane et al., 2009). Moreover, cTNNT2, PLCγ1, TGM1, and TGM2 are all known to be perturbed following exposure to DLCs (Handley-Goldstone et al., 2005; Rice and Cline, 1984; Rodriguez-Fragoso et al., 2009; Rubin and Rice, 1988).
Other Candidate Loci
Localizing candidates for the QTL on Chr 15, which becomes significant when considering additive relationships with the other QTLs identified, will require additional mapping; the position of this QTL is unresolved (Supplementary fig. S2). However, under the assumption that a candidate is located nearby, the vascular endothelial zinc finger-1 gene (vezf1) colocalizes with this QTL (46.4 cM). VEZF1 regulates the expression of endothelin-1 (ET-1) (Aitsebaomo et al., 2001), a gene found to be upregulated in the hearts of larval zebrafish (Carney et al., 2006a) and fetal mice (Thackaberry et al. 2005a) following embryonic exposure to TCDD. In mice, elevated levels of ET-1 are associated with cardiac dysfunction (Lund et al., 2003, 2006).
Genetic Susceptibility and DLCs
It is not surprising that the QTLs identified in this study contain a number of candidate loci that could contribute to the cardioteratogenic effects of DLCs. In eukaryotic genomes, genes with related functions tend to be spatially clustered and are often coexpressed as sequential components of a common pathway or biological process (reviewed in Hurst, 2004). Elucidating the precise gene in each QTL responsible for the observed differential sensitivity will require further mapping and demonstration of causality. Techniques—including positional cloning followed by targeted gene replacement, deletion mapping, morpholino knockdown experiments, and/or functional complementation—will be used to establish such a relationship. For many of the candidates that colocalize with the QTLs identified, morpholino knock downs in zebrafish and Xenopus have been described. Loss of function of cTNNT2 (Sehnert et al., 2002), PLCγ1 (Rottbauer et al., 2005), E2F1 (Waits, Bartman, and Nebert, unpublished data), BCOR (Hilton et al., 2007; Ng et al., 2004), and GATA5 (Peterkin et al., 2007) during development results in defects ranging from lack of heart beat to severe endocardial and myocardial hypoplasia––end points similar to those observed following embryonic exposure to DLCs. While a direct link between the candidate susceptibility loci and PCB126-induced cardioteratogenicity has not yet been firmly established, it is our hope that the information provided by this study, in conjunction with other related molecular and “omics” investigations, will contribute to the discovery of the precise molecular mechanisms involved.
SUPPLEMENTARY DATA
Supplementary data are available online at http://toxsci.oxfordjournals.org/.
FUNDING
National Exposure Research Laboratory, U.S. Environmental Protection Agency and, in part, by the National Institutes of Health (R01 ES014403 and P30 ES06096 to D.W.N.).
Supplementary Material
Acknowledgments
We thank Richard Peterson, Amy Prasch, and Sara Carney for helpful discussions regarding exposures and phenotyping DLC toxicity in zebrafish. We thank Alvaro Puga, Mary-Beth Genter, Thomas Bartman, Daniel Prows, Diane Nacci, Mark Bagley, and John Darling for valuable discussions and careful readings of this manuscript. Although this work was reviewed by the U.S. Environmental Protection Agency and approved for publication, it may not necessarily reflect official agency policy. All authors declare they have no actual or potential competing financial interest.
References
- Aitsebaomo J, Kingsley-Kallesen ML, Wu Y, Quertermous T, Patterson C. Vezf1/DB1 is an endothelial cell-specific transcription factor that regulates expression of the endothelin-1 promoter. J. Biol. Chem. 2001;276:39197–39205. doi: 10.1074/jbc.M105166200. [DOI] [PubMed] [Google Scholar]
- Antkiewicz DS, Burns CG, Carney SA, Peterson RE, Heideman W. Heart malformation is an early response to TCDD in embryonic zebrafish. Toxicol. Sci. 2005;84:368–377. doi: 10.1093/toxsci/kfi073. [DOI] [PubMed] [Google Scholar]
- Bergamini CM, Signorini M, Barbato R, Menabo R, Di Lisa F, Gorza L, Beninati S. Transglutaminase-catalyzed polymerization of troponin in vitro. Biochem. Biophys. Res. Commun. 1995;206:201–377. doi: 10.1006/bbrc.1995.1028. [DOI] [PubMed] [Google Scholar]
- Berger SI, Posner JM, Ma'ayan A. Genes2Networks: connecting lists of gene symbols using mammalian protein interactions databases. BMC Bioinformatics. 2007;8:372. doi: 10.1186/1471-2105-8-372. [DOI] [PMC free article] [PubMed] [Google Scholar]
- Broman KW, Sen SS. New York, NY: Springer-Verlag; 2009. p. 396. A guide to QTL mapping with R/qtl. Springer-Verlag, New York, NY. [Google Scholar]
- Broman KW, Wu H, Sen Ś, Churchill GA. R/qtl: QTL mapping in experimental crosses. Bioinformatics. 2003;19:889–890. doi: 10.1093/bioinformatics/btg112. [DOI] [PubMed] [Google Scholar]
- Carlson EA, Roy NK, Wirgin II. Microarray analysis of polychlorinated biphenyl mixture. induced changes in gene expression among Atlantic tomcod populations displaying differential sensitivity to halogenated aromatic hydrocarbons. Environ. Toxicol. Chem. 2009;28:759–771. doi: 10.1897/08-195R.1. [DOI] [PubMed] [Google Scholar]
- Carney SA, Chen J, Burns CG, Xiong KM, Peterson RE, Heideman W. Aryl hydrocarbon receptor activation produces heart-specific transcriptional and toxic responses in developing zebrafish. Mol. Pharmacol. 2006a;70:549–561. doi: 10.1124/mol.106.025304. [DOI] [PubMed] [Google Scholar]
- Carney SA, Prasch AL, Heideman W, Peterson RE. Understanding dioxin developmental toxicity using the zebrafish model. Birth Defects Res. 2006b;76:7–18. doi: 10.1002/bdra.20216. [DOI] [PubMed] [Google Scholar]
- Carvalho PSM, Noltie DB, Tillitt DE. Intra-strain dioxin sensitivity and morphometric effects in swim-up rainbow trout (Oncorhynchus mykiss) Comp. Biochem. Physiol. C Toxicol. Pharmacol. 2004;137:133–142. doi: 10.1016/j.cca.2003.12.005. [DOI] [PubMed] [Google Scholar]
- Churchill GA, Doerge RW. Empirical threshold values for quantitative trait mapping. Genetics. 1994;138:963–971. doi: 10.1093/genetics/138.3.963. [DOI] [PMC free article] [PubMed] [Google Scholar]
- Clark BW, Matson CW, Jung D, Di Giulio RT. AHR2 mediates cardiac teratogenesis of polycyclic aromatic hydrocarbons and PCB-126 in Atlantic killifish (Fundulus heteroclitus) Aquat. Toxicol. 2010;99:232–240. doi: 10.1016/j.aquatox.2010.05.004. [DOI] [PMC free article] [PubMed] [Google Scholar]
- Dale YR, Eltom SE. Calpain mediates the dioxin-induced activation and down-regulation of the aryl hydrocarbon receptor. Mol. Pharmacol. 2006;70:1481–1487. doi: 10.1124/mol.106.027474. [DOI] [PubMed] [Google Scholar]
- Feenstra B, Skovgaard IM, Broman KW. Mapping quantitative trait loci by an extension of the Haley-Knott regression method using estimating equations. Genetics. 2006;173:2111–2119. doi: 10.1534/genetics.106.058537. [DOI] [PMC free article] [PubMed] [Google Scholar]
- Fernandez-Salguero PM, Hilbert DM, Rudikoff S, Ward JM, Gonzalez FJ. Aryl hydrocarbon receptor-deficient mice are resistant to, 2,3,7,8-tetrachlorodibenzo-pdioxin-induced toxicity. Toxicol. Appl. Pharmacol. 1996;140:173–179. doi: 10.1006/taap.1996.0210. [DOI] [PubMed] [Google Scholar]
- Forlin L, Celander M. Studies of the inducibility of P450 1A in perch from the PCB-contaminated Lake Jarnsjon in Sweden. Mar. Environ. Res. 1995;39:85–88. [Google Scholar]
- Gorza L, Menabo R, Vitadello M, Bergamini C, Di Lisa F. Cardiomyocyte troponin T immunoreactivity is modified by cross-linking resulting from intracellular calcium overload. Circulation. 1996;95:1896–1904. doi: 10.1161/01.cir.93.10.1896. [DOI] [PubMed] [Google Scholar]
- Grimes AC, Erwin KN, Stadt HA, Hunter GL, Gefroh HA, Tsai HJ, Kirby ML. PCB126 exposure disrupts zebrafish ventricular and branchial but not early neural crest development. Toxicol. Sci. 2008;106:193–205. doi: 10.1093/toxsci/kfn154. [DOI] [PMC free article] [PubMed] [Google Scholar]
- Haley CS, Knott SA. A simple regression method for mapping quantitative trait loci in line crosses using flanking markers. Heredity. 1992;69:315–324. doi: 10.1038/hdy.1992.131. [DOI] [PubMed] [Google Scholar]
- Handley-Goldstone HM, Grow MW, Stegeman JJ. Cardiovascular gene expression profiles of dioxin exposure in zebrafish embryos. Toxicol. Sci. 2005;85:683–693. doi: 10.1093/toxsci/kfi116. [DOI] [PubMed] [Google Scholar]
- High FA, Epstein JA. The multifaceted role of Notch in cardiac development and disease. Nat. Rev. Genet. 2008;9:49–61. doi: 10.1038/nrg2279. [DOI] [PubMed] [Google Scholar]
- Hilton EN, Manson FD, Urquhart JE, Johnston JJ, Slavotinek AM, Hedera P, Stattin E, Nordgren A, Biesecker LG, Black G. Left-sided embryonic expression of the BCL-6 corepressor, BCOR, is required for vertebrate laterality determination. Hum. Mol. Genet. 2007;16:1773–1782. doi: 10.1093/hmg/ddm125. [DOI] [PubMed] [Google Scholar]
- Hurst LD. The evolutionary dynamics of eukaryotic gene order. Nat. Rev. Genet. 2004;5:299–310. doi: 10.1038/nrg1319. [DOI] [PubMed] [Google Scholar]
- Ihaka R, Gentleman R. R: a language for data analysis and graphics. J. Comp. Graph. Stat. 1996;5:299–314. [Google Scholar]
- Ivnitski I, Elmaoued R, Walker MK. 2,3,7,8-Tetrachlorodibenzo-p-dioxin (TCDD) inhibition of coronary development is preceded by a decrease in myocyte proliferation and an increase in cardiac apoptosis. Teratology. 2001;64:201–212. doi: 10.1002/tera.1065. [DOI] [PubMed] [Google Scholar]
- Kao CH, Zeng MH. An investigation of the power for separating closely linked QTL in experimental populations. Genet. Res. (Camb.) 2010;92:283–294. doi: 10.1017/S0016672310000273. [DOI] [PubMed] [Google Scholar]
- Kopf PG, Walker MK. Overview of developmental heart defects by dioxins, PCBs, and pesticides. J. Environ. Sci Health. C Environ. Carcinog. Ecotoxicol. Rev. 2009;27:276–285. doi: 10.1080/10590500903310195. [DOI] [PubMed] [Google Scholar]
- Lin TM, Ko K, Moore RW, Buchanan DL, Cooke PS, Peterson RE. Role of the aryl hydrocarbon receptor in the development of control and 2,3,7,8-tetrachlorodibenzo-p-dioxin-exposed male mice. J. Toxicol. Environ. Health. 2001;64:327–342. doi: 10.1080/152873901316981312. [DOI] [PubMed] [Google Scholar]
- Lund AK, Goens MB, Kanagy NL, Walker MK. Cardiac hypertrophy in aryl hydrocarbon receptor null mice is correlated with elevated angiotensin II, endothelin-1, and mean arterial blood pressure. Toxicol. Appl. Pharmacol. 2003;193:177–187. doi: 10.1016/j.taap.2003.08.008. [DOI] [PubMed] [Google Scholar]
- Lund AK, Goens MB, Nunez BA, Walker MK. Characterizing the role of endothelin-1 in the progression of cardiac hypertrophy in aryl hydrocarbon receptor (AhR) null mice. Toxicol. Appl. Pharmacol. 2006;212:127–135. doi: 10.1016/j.taap.2005.07.005. [DOI] [PubMed] [Google Scholar]
- Marlowe JL, Fan Y, Chang X, Peng L, Knudsen ES, Xia Y, Puga A. The aryl hydrocarbon receptor binds to E2F1 and inhibits E2F1-induced apoptosis. Mol. Biol. Cell. 2008;19:3263–3271. doi: 10.1091/mbc.E08-04-0359. [DOI] [PMC free article] [PubMed] [Google Scholar]
- Mehta V, Peterson RE, Heideman W. 2,3,7,8-Tetrachlorodibenzo-p-dioxin exposure prevents cardiac valve formation in developing zebrafish. Toxicol. Sci. 2008;104:303–311. doi: 10.1093/toxsci/kfn095. [DOI] [PMC free article] [PubMed] [Google Scholar]
- Merkulova T, Lucas M, Jabet C, Lamande N, Rouzeau JD, Gros F, Lazar M, Keller AL. Biochemical characterization of the mouse muscle-specific enolase: developmental changes in electrophoretic variants and selective binding to other proteins. Biochem. J. 1997;323:791–800. doi: 10.1042/bj3230791. [DOI] [PMC free article] [PubMed] [Google Scholar]
- Micka J, Milatovich A, Menon A, Grabowski GA, Puga A, Nebert DW. Human Ah receptor (AHR) gene: localization to 7p15 and suggestive correlation of polymorphism with CYP1A1 inducibility. Pharmacogenetics. 1997;7:95–101. doi: 10.1097/00008571-199704000-00002. [DOI] [PubMed] [Google Scholar]
- Murthy SN, Lomasney JW, Mak EC, Lorand L. Interactions of Gh transglutaminase with phospholipase Cγ1 and with GTP. Proc. Natl. Acad. Sci. U.S.A. 1999;96:11815–11819. doi: 10.1073/pnas.96.21.11815. [DOI] [PMC free article] [PubMed] [Google Scholar]
- Nacci DE, Coiro L, Champlin D, Jayaraman S, McKinney R, Gleason TR, Munns WR, Specker JL, Cooper KR. Adaptations of wild populations of the estuarine fish Fundulus heteroclitus to persistent environmental contaminants. Mar. Biol. 1999;134:9–17. [Google Scholar]
- Nebert DW. The Ah locus: genetic differences in toxicity, cancer, mutation, and birth defects. Crit. Rev. Toxicol. 1989;20:153–174. doi: 10.3109/10408448909017908. [DOI] [PubMed] [Google Scholar]
- Nebert DW, Karp CL. Endogenous functions of the aryl hydrocarbon receptor (AHR): intersection of cytochrome P450 1 (CYP1)-metabolized eicosanoids and AHR biology. J. Biol. Chem. 2008;283:36061–36065. doi: 10.1074/jbc.R800053200. [DOI] [PMC free article] [PubMed] [Google Scholar]
- Ng D, Thakker N, Corcoran CM, Donnai D, Perveen R, Schneider A, Hadley DW, Tifft C, Zhang L, Wilkie AO, et al. Oculofaciocardiodental and Lenz microphthalmia syndromes result from distinct classes of mutations in BCOR. Nat. Genet. 2004;36:411–416. doi: 10.1038/ng1321. [DOI] [PubMed] [Google Scholar]
- Papp Z, van der Velden J, Stienen GJM. Calpain-I induced alterations in the cytoskeletal structure and impaired mechanical properties of single myocytes of rat heart. Cardiovasc. Res. 2000;45:981–993. doi: 10.1016/s0008-6363(99)00374-0. [DOI] [PubMed] [Google Scholar]
- Peterkin T, Gibson A, Patient R. Redundancy and evolution of GATA factor requirements in development of the myocardium. Dev. Biol. 2007;311:623–635. doi: 10.1016/j.ydbio.2007.08.018. [DOI] [PMC free article] [PubMed] [Google Scholar]
- Prasch AL, Teraoka H, Carney SA, Dong W, Hiraga T, Stegeman JJ, Heideman W, Peterson RE. Aryl hydrocarbon receptor 2 mediates 2,3,7,8-tetrachlorodibenzo-p-dioxin developmental toxicity in zebrafish. Toxicol. Sci. 2003;76:138–150. doi: 10.1093/toxsci/kfg202. [DOI] [PubMed] [Google Scholar]
- Puga A, Barnes SJ, Dalton TP, Chang C, Knudsen ES, Maier MA. Aromatic hydrocarbon receptor interaction with the retinoblastoma protein potentiates repression of E2F-dependent transcription and cell cycle arrest. J. Biol. Chem. 2000;275:2943–2950. doi: 10.1074/jbc.275.4.2943. [DOI] [PubMed] [Google Scholar]
- Reymann S, Borlak J. Transcriptome profiling of human hepatocytes treated with Aroclor 1254 reveals transcription factor regulatory networks and clusters of regulated genes. BMC Genomics. 2006;7:217. doi: 10.1186/1471-2164-7-217. [DOI] [PMC free article] [PubMed] [Google Scholar]
- Rice RH, Cline PR. Opposing effects of 2,3,7,8-tetrachlorodibenzo-p-dioxin and hydrocortisone on growth and differentiation of cultured malignant human keratinocytes. Carcinogenesis. 1984;5:367–371. doi: 10.1093/carcin/5.3.367. [DOI] [PubMed] [Google Scholar]
- Rodriguez-Fragoso L, Melendez K, Hudson LG, Lauer FT, Burchiel SW. EGF-receptor phosphorylation and downstream signaling are activated by benzo[a]pyrene 3,6-quinone and benzo[a]pyrene 1,6-quinone in human mammary epithelial cells. Toxicol. Appl. Pharmacol. 2009;235:321–328. doi: 10.1016/j.taap.2008.12.022. [DOI] [PMC free article] [PubMed] [Google Scholar]
- Rottbauer W, Just S, Wessels G, Trano N, Most P, Katus HA, Fishman MC. VEGF-PLCgamma1 pathway controls cardiac contractility in the embryonic heart. Genes. Dev. 2005;19:1624–1634. doi: 10.1101/gad.1319405. [DOI] [PMC free article] [PubMed] [Google Scholar]
- Rubin AL, Rice RH. 2,3,7,8-Tetrachlorodibenzo-p-dioxin and polycyclic aromatic hydrocarbons suppress retinoid-induced tissue transglutaminase in SCC-4 cultured human squamous carcinoma cells. Carcinogenesis. 1988;9:1067–1070. doi: 10.1093/carcin/9.6.1067. [DOI] [PubMed] [Google Scholar]
- Rubinstein AL. Zebrafish assays for drug toxicity screening. Expert. Opi. Drug. Metab. Toxicol. 2006;2:231–240. doi: 10.1517/17425255.2.2.231. [DOI] [PubMed] [Google Scholar]
- Sakano D, Kato A, Parikh N, McKnight K, Terry D, Stefanovic B, Kato Y. BCL6 canalizes Notch-dependent transcription, excluding Mastermind-like1 from selected target genes during left-right patterning. Dev. Cell. 2010;18:450–462. doi: 10.1016/j.devcel.2009.12.023. [DOI] [PMC free article] [PubMed] [Google Scholar]
- Sane DC, Kontos JL, Greenberg CS. Roles of transglutaminases in cardiac and vascular diseases. Front. Biosci. 2009;12:2530–2545. doi: 10.2741/2253. [DOI] [PMC free article] [PubMed] [Google Scholar]
- Schuelke M. An economic method for the fluorescent labeling of PCR fragments. Nat. Biotech. 2000;18:233–234. doi: 10.1038/72708. [DOI] [PubMed] [Google Scholar]
- Sehnert AJ, Huq A, Weinstein BM, Walker C, Fishman M, Stainier DY. Cardiac troponin T is essential in sarcomere assembly and cardiac contractility. Nat. Genet. 2002;31:106–110. doi: 10.1038/ng875. [DOI] [PubMed] [Google Scholar]
- Sen S, Churchill GA. A statistical framework for quantitative trait mapping. Genetics. 2001;159:371–387. doi: 10.1093/genetics/159.1.371. [DOI] [PMC free article] [PubMed] [Google Scholar]
- Staessen JA, Nawrot T, Hond ED, Thijs L, Fagard R, Hoppenbrouwers K, Koppen G, Nelen V, Schoeters G, Vanderschueren D, et al. Renal function, cytogenetic measurements, and sexual development in adolescents in relation to environmental pollutants: a feasibility study of biomarkers. Lancet. 2001;357:1660–1669. doi: 10.1016/s0140-6736(00)04822-4. [DOI] [PubMed] [Google Scholar]
- Thackaberry EA, Jiang Z, Johnson CD, Ramos KS, Walker MK. Toxicogenomic profile of 2,3,7,8-tetrachlorodibenzo-p-dioxin in the murine fetal heart: modulation of cell cycle and extracellular matrix genes. Toxicol. Sci. 2005a;88:231–241. doi: 10.1093/toxsci/kfi301. [DOI] [PubMed] [Google Scholar]
- Thackaberry EA, Nunez BA, Ivnitski-Steele ID, Friggins M, Walker MK. Effect of 2,3,7,8-tetrachlorodibenzo-p-dioxin on murine heart development: alteration in fetal and postnatal cardiac growth, and postnatal cardiac chronotropy. Toxicol. Sci. 2005b;88:242–249. doi: 10.1093/toxsci/kfi302. [DOI] [PubMed] [Google Scholar]
- Tsai CT, Hwang JJ, Ritchie MD, Moore JH, Chiang FT, Lai LP, Hsu KL, Tseng CD, Lin JL, Tseng YZ. Renin-angiotensin system gene polymorphisms and coronary artery disease in a large angiographic cohort: detection of high order gene-gene interaction. Atherosclerosis. 2007;195:172–180. doi: 10.1016/j.atherosclerosis.2006.09.014. [DOI] [PubMed] [Google Scholar]
- U.S. Environmental Protection Agency. EPA Probit Analysis Software, ver. 1.3. 2001. Available at: http://www.epa.gov/nerleerd/stat2.htm. Accessed June 3, 2011. [Google Scholar]
- Ventura C, Maioli M. Opioid peptide gene expression primes cardiogenesis in embryonal pluripotent stem cells. Circ. Res. 2000;87:189–194. doi: 10.1161/01.res.87.3.189. [DOI] [PubMed] [Google Scholar]
- Walker MK, Catron TF. Characterization of cardiotoxicity induced by 2,3,7,8-tetrachlorodibenzo-p-dioxin and related chemicals during early chick embryo development. Toxicol. Appl. Pharmacol. 2000;167:210–221. doi: 10.1006/taap.2000.8992. [DOI] [PubMed] [Google Scholar]
- Wang Y, Fan Y, Puga A. Dioxin exposure disrupts the differentiation of mouse embryonic stem cells into cardiomyocytes. Toxicol. Sci. 2010;115:225–237. doi: 10.1093/toxsci/kfq038. [DOI] [PMC free article] [PubMed] [Google Scholar]
- Westerfield M. The Zebrafish Book. A Guide for the Laboratory Use of Zebrafish (Danio rerio). 3rd ed. University of Oregon Press, Eugene, OR; 1995. [Google Scholar]
- Whitehead A, Triant D, Champlin D, Nacci D. Comparative transcriptomics implicates mechanisms of evolved pollution tolerance in a killifish population. Mol. Ecol. 2010;19:5186–5203. doi: 10.1111/j.1365-294X.2010.04829.x. [DOI] [PubMed] [Google Scholar]
- Wirgin I, Roy NK, Loftus M, Chambers C, Franks DG, Hahn ME. Mechanistic basis of resistance to PCBs in Atlantic tomcod from the Hudson River. Science. 2011;331:1322–1325. doi: 10.1126/science.1197296. [DOI] [PMC free article] [PubMed] [Google Scholar]
- Yuan Z, Courtenay S, Chambers RC, Wirgin I. Evidence of spatially extensive resistance to PCBs in an anadromous fish of the Hudson River. Environ. Health Perspect. 2006;114:77–84. doi: 10.1289/ehp.8255. [DOI] [PMC free article] [PubMed] [Google Scholar]
Associated Data
This section collects any data citations, data availability statements, or supplementary materials included in this article.


