

Abstract
PURPOSE
Common polymorphisms in the N-acetyltransferase-2 (NAT2) metabolic enzyme determine slow or rapid acetylator phenotypes. We investigated the effects of alcohol, smoking, and caffeine on fecundability, and determined whether the effects were modified by NAT2.
METHODS
Three NAT2 polymorphisms were genotyped in 319 women office workers participating in a prospective pregnancy study (1990–1994). Women were ages 20–41 and at risk for pregnancy. Discrete-time survival analysis was used to determine the effects of alcohol, smoking, and caffeine on fecundability and evaluate effect modification by NAT2.
RESULTS
319 women (161 slow acetylators, 158 rapid) were followed for an average of 8 menstrual cycles, resulting in 124 pregnancies. There was no effect of caffeine on fecundability. Drinking 1+ alcoholic drink/day and current smoking were significantly associated with reduced fecundability, but only among slow acetylators (adjusted fecundability odds ratio (FOR) for smoking= 0.34: 95% CI, 0.22, 0.90; adjusted FOR for 1+ drink/day = 0.20: 0.05, 0.92). There was no effect among rapid acetylators.
CONCLUSIONS
NAT2 status significantly modified the effects of alcohol and smoking on fecundability, emphasizing the importance of incorporating genetic and metabolic information in studies of reproductive health. Replication of this study is warranted.
MeSH Key words: NAT2, Fertility, Smoking, Alcohol Drinking, Caffeine, Pregnancy, Genetic Polymorphism
Subfertility and infertility are growing public health issues, largely because women are waiting until older ages to attempt pregnancy. Fecundability, a related concept, is defined as the probability of pregnancy per time unit, and is operationalized by counting the number of cycles at risk until a pregnancy occurs (time to pregnancy) (1). Smoking, alcohol, and caffeine are modifiable risk factors that are possibly related to reduced fecundability, but epidemiologic studies of these exposures have had inconsistent results (2, 3).
Caffeine was found to reduce fecundability in a prospective study by Wilcox et al. (1988), where consuming more than 3150 mg/month (about 1 cup of coffee/day) was associated with a 50% reduction in fecundability, which prompted research in this area (4). However, other prospective studies have found either no effect (5) or even increased fecundability (6).
Results for alcohol and smoking are more consistent; typically, both are associated with increased time to pregnancy (indicating reduced fecundability), although some have found no effect. Among prospective studies, Buck Louis et al. found that fecundability was reduced 4% for each alcoholic beverage consumed in a 28-day period, and Jensen et al. observed a dose response between alcohol intake and increased time to pregnancy (7, 8). Wilcox et al. did not find an association between alcohol and fecundability (4). Jensen et al. found reduced fecundability associated with a woman’s smoking, particularly if she was also exposed to her mother’s smoking in utero (9). However, Buck Louis et al. reported no effect of smoking (7).
Genetic heterogeneity is one factor that may explain the inconsistent results of previous studies. N-acetyltransferase-2 (NAT2) is an enzyme that catalyzes the N-acetylation of aromatic and heterocyclic amines (11). NAT2 metabolizes and detoxifies xenobiotics such as caffeine, tobacco smoke, pesticides, and prescription drugs (12, 13). Polymorphisms in the NAT2 gene determine haplotypes that correspond with slow or rapid acetylator phenotypes (14, 15).
NAT2 haplotypes may modify associations between toxicants and various outcomes. For example, slow acetylators are especially susceptible to hepatotoxicity during prescription drug treatment (16). Acetylator status also modified the association of smoking with risk of colorectal adenoma and bladder cancer, with slow acetylators being more susceptible (17, 18). No studies to date have investigated NAT2 polymorphisms as effect modifiers of exposures that affect fecundability or fertility.
This study investigates the effects of caffeine, alcohol, and smoking on fecundability using daily exposure data and prospectively measured time to pregnancy, including subclinical pregnancies. Further, this study addresses potential genetic heterogeneity by assessing whether NAT2 acetylator status modified any of these effects.
MATERIALS AND METHODS
Population
The Study of Women Office Workers was a prospective study of fertility and menstrual function conducted from 1990–1994 (19, 20). A total of 4640 women completed eligibility questionnaires. Women between the ages of 18 and 40 who were sexually active in the preceding month were eligible. Exclusion criteria included the use of hormonal contraception, an intrauterine device, or current infertility (>1 year of unprotected intercourse without pregnancy). Women with a history of hysterectomy, infertility, polycystic ovaries, tubal ligations, or with partners who had vasectomies were also excluded. Of the 855 women that met these criteria, 563 (64%) agreed to participate. Fourteen of these women became newly ineligible, and seventy-nine women did not collect any urine samples. The remaining 470 women were requested to complete daily diaries for 12 months or until pregnancy. They collected urine samples on the first two days of every menstrual cycle (where the first day of bleeding is considered day 1). If menses did not occur when expected, two urine samples were collected 1 week following the date of expected menses, based on the usual cycle length reported in the intake interview. Urine samples were stored in the woman’s freezer until a courier retrieved them. Information on year of birth, race, ethnicity, body mass index (BMI, kg/m2), age at menarche, previous months of unprotected intercourse, desire to become pregnant, and reproductive and medical histories was recorded during an interview at the onset of the study.
Exposure information
Women recorded daily information on caffeine, alcohol, smoking, and covariates in the diaries. Caffeine was recorded as cups of caffeinated tea, coffee, and cola. Alcohol was recorded as cans of beer, glasses of wine and shots of liquor. Smoking was recorded as the number of cigarettes. Menstrual bleeding, intercourse (yes/no), and birth control use (e.g., barrier method, withdrawal, etc.) were indicated on a daily basis. A variable for the frequency of unprotected intercourse during the (estimated) ovulatory window was created from the intercourse and birth control variables. The 10-day window starts 7 days before and ends 2 days after the estimated day of ovulation. The day of ovulation was estimated by counting 14 days before the onset of the next menses. This method accounts for the 14-day lifespan of the corpus luteum (21) and the relatively consistent length of the luteal phase (22).
Caffeine was converted into milligrams using the following factors: 1 cup caffeinated coffee = 150 mg; 1 cup caffeinated tea = 55 mg; 1 cup caffeinated cola = 45 mg, which are within the ranges of reported values (23). Caffeine was averaged over each cycle and categorized into low (mean caffeine intake < 150 mg/day), medium (150–300 mg/day) and high (> 300 mg/day) groups. Alcohol was averaged over each cycle and divided into three categories: nondrinkers, <1 drink/day, and 1+ drinks/day. Categories were created to be practically meaningful while maintaining stable sample sizes. Current smoking was divided into nonsmokers, <10 cigarettes/day, and ≥10 cigarettes/day. These variables are all cycle-specific; in other words, a woman may be categorized as a smoker for one cycle and a non-smoker for the next. For cycles in which a pregnancy occurred, the mean alcohol, caffeine, and smoking values were calculated for that woman’s average cycle length (e.g., 28 days) and subsequent days were excluded.
NAT2 Genotyping
DNA was extracted from the urine samples using the Qiagen MagAttract DNA Mini M48 kit in combination with the BioRobot M48 workstation (Qiagen, Valencia, CA). DNA was extracted in duplicate from 20% of the women, in order to check genotyping accuracy. We genotyped three single nucleotide polymorphisms (SNPs) in NAT2: rs1799929 (C481T), rs1799930 (G590A), and rs1208 (A803G). SNPs were chosen based on minor allele frequencies in HapMap ( > 5%) and their ability to differentiate slow from rapid acetylators. Slow acetylator haplotypes were defined by having either a C→ T polymorphism at rs1799929, a G→A polymorphism at rs1799930, and/or an A→G polymorphism at rs1208. Haplotypes were assigned using PHASE (version 2.1.1) using the expectation-maximization algorithm (24, 25). The *4 haplotype (wild-type) is the rapid acetylator haplotype. Zero copies of this rapid haplotype determined slow acetylator status, whereas 1 or 2 determined rapid. Good concordance between genotype and acetylator phenotype has been documented (26, 27).
The SNPs were genotyped using the Beckman Coulter GenomeLab SNPstream system (Beckman Coulter, Inc., Brea, CA, USA) using primers designed by Autoprimer.com (28). Up to 6 ng of DNA was used for genotyping. The GenomeLab SNPstream Genotyping System Software Suite version 2.3 was used to check the quality of the genotyping results, along with visual inspection of signal intensity and clustering pattern to make individual calls where questionable.
Statistical Analyses
Time to pregnancy was measured as the number of menstrual cycles up until and including the cycle when a pregnancy was achieved. Only first pregnancies were included in the present analysis. Subclinical pregnancies were detected by measuring human chorionic gonadotropin (hCG) levels in urine samples collected on days 1 and 2 of the subsequent menstrual cycle, or 1 week after the expected date of menses, in cases where menses had not yet occurred. The hCG was analyzed and pregnancies were diagnosed as described in Small et al. (29). Briefly, two samples of hCG greater than > 0.25 ng/μL determined pregnancy. We used questions from the entry interview to determine an approximate number of cycles a woman had been at risk for pregnancy at study entry. In our primary analyses we added these cycles to prospective cycles at risk, meaning that if a woman indicated she had been at risk for pregnancy for three cycles prior to enrollment, her prospective cycle 1 would instead be entered as cycle 4. As a sensitivity analysis, we instead included the prior cycles at risk in the model as a covariate.
The effects of the exposures and covariates on time to pregnancy were assessed using discrete-time survival analysis. This approach is more powerful than dichotomizing reproductive success as fertile/infertile (1). The discrete-time hazard is the probability that a woman became pregnant in a given menstrual cycle conditional on a pregnancy not occurring in prior cycles. The likelihood is equivalent to that for binary regression models (30). We modeled the per-cycle probability of conception using logistic regression and generated fecundability odds ratios representing the odds of conception in one group compared with the odds of conception in the referent group. We adjusted for variables that were statistically significantly associated with fecundability in the multivariable model.
Interactions between caffeine, alcohol, smoking, and NAT2 were assessed by including interaction terms in the multivariable models. Three separate models were run to evaluate interactions of NAT2 acetylator status with smoking, alcohol, and caffeine. Evaluating all three interactions simultaneously was not feasible, given our limited sample. Models evaluating one interaction (e.g., smoking/NAT2) were adjusted for variables statistically significantly associated with fecundability, in addition to being adjusted for the other exposures of interest (e.g., caffeine, alcohol). We dichotomized alcohol intake (<1 vs. ≥1 drink/day) and caffeine intake (<300 vs. ≥300 mg/day) for the interaction models, to allow for stable subgroup sizes. As a sensitivity analysis, the NAT2 interaction models were restricted to non-Hispanic whites with genotype information (N=248) to reduce the potential for confounding by population stratification.
The Emory Institutional Review Board approved the study protocol after complete de-identification of all samples, surveys and interviews.
RESULTS
Study Participants
Study participants were mostly white, non-Hispanic, married, and had some college education (Table I). A substantial number of women smoked cigarettes (39%) and drank alcohol (89%) during follow-up. Although all participants were at risk for pregnancy according to our definition, only 23% reported that they were trying to become pregnant. The median number of cycles at risk before study entry was 1 (interquartile range[IQR] = 0, 7). Thirty-eight percent of the 470 women (N=179) achieved pregnancy during the study.
Table I.
Population Characteristics of 470 Women Office Workers and 319 Women Who Were Genotyped for NAT2
| All women | Genotyped women | ||
|---|---|---|---|
| N=470 | N=319 | χ2 | |
| N (%)a | N (%) | P value (2-sided)b | |
| Age (years) | 0.74 | ||
| 19–24 | 41 (9) | 30 (9) | |
| 25–29 | 150 (32) | 102 (32) | |
| 30–34 | 164 (35) | 113 (35) | |
| 35–41 | 115 (24) | 74 (23) | |
| Race | 0.21 | ||
| White | 376 (80) | 248 (78) | |
| African-American or Black | 58 (12) | 45 (14) | |
| Asian | 13 (3) | 8 (3) | |
| Other | 23 (5) | 18 (6) | |
| Ethnicity | 0.36 | ||
| Hispanic | 22 (5) | 18 (6) | |
| Non-Hispanic | 445 (95) | 299 (94) | |
| Missing | 3 (1) | 2 (1) | |
| Marital status | 0.91 | ||
| Married | 309 (66) | 208 (65) | |
| Single (never married) | 127 (27) | 87 (27) | |
| Divorced/separated/widowed | 34 (7) | 24 (8) | |
| Ever Pregnant | 0.91 | ||
| Yes | 285 (61) | 194 (61) | |
| No | 185 (39) | 125 (39) | |
| Highest education | 0.23 | ||
| High school or technical | 110 (23) | 76 (24) | |
| Some college | 156 (33) | 112 (35) | |
| College graduate | 203 (43) | 131 (41) | |
| Missing | 1 (0) | 0 (0) | |
| BMI (kg/m2) | 0.04 | ||
| <18.5 | 23 (5) | 9 (3) | |
| 18.5–<25 | 297 (63) | 204 (64) | |
| 25–<30 | 91 (19) | 62 (19) | |
| 30+ | 58 (12) | 43 (13) | |
| Missing | 1 (0) | 1 (0) | |
| Trying to get pregnant | 0.39 | ||
| Yes | 108 (23) | 73 (23) | |
| No | 332 (71) | 229 (72) | |
| Missing | 30 (6) | 17 (5) | |
| Months at-risk for pregnancy prior to study start | 0.22 | ||
| <1 | 220 (47) | 148 (46) | |
| 1–3 | 96 (20) | 60 (19) | |
| 4–6 | 36 (8) | 24 (8) | |
| >6 | 117 (25) | 87 (27) | |
| Mean times unprotected intercourse in the ovulatory window during follow-up | 0.81 | ||
| <1 | 293 (62) | 201 (63) | |
| 1–2 | 97 (21) | 63 (20) | |
| >2 | 65 (14) | 48 (15) | |
| Missing | 15 (3) | 7 (2) | |
| Mean smoking during follow-up | 0.57 | ||
| None | 287 (61) | 161 (63) | |
| <10 cigarettes/day | 117 (25) | 63 (23) | |
| ≥10 cigarettes/day | 66 (14) | 38 (14) | |
| Mean alcohol intake during follow-up | 0.10 | ||
| None | 54 (11) | 34 (11) | |
| <1 drink/day | 346 (74) | 230 (72) | |
| ≥1 drink/day | 70 (15) | 55 (17) | |
| Mean caffeine intake during follow-up | 0.99 | ||
| ≤150 mg/day | 256 (54) | 174 (55) | |
| 151–300 mg/day | 137 (29) | 93 (29) | |
| >300 mg/day | 77 (16) | 52 (16) |
Percentages may not add to 100 due to rounding.
Chi-square p-value for comparing those genotyped (N=319) to those not genotyped (N=151). Missings not included in Chi-square calculations.
Of the 470 women we attempted to genotype, high quality DNA (resulting in successful genotyping) was obtained from 319 of the women. The 319 women genotyped for NAT2 were followed for an average of 8 menstrual cycles, resulting in 124 pregnancies. Of those women who became pregnant, the median number of cycles until pregnancy was achieved was 3 (IQR: 1, 7). Figure 1 shows the cumulative proportion of women who became pregnant during the study.
Figure 1.
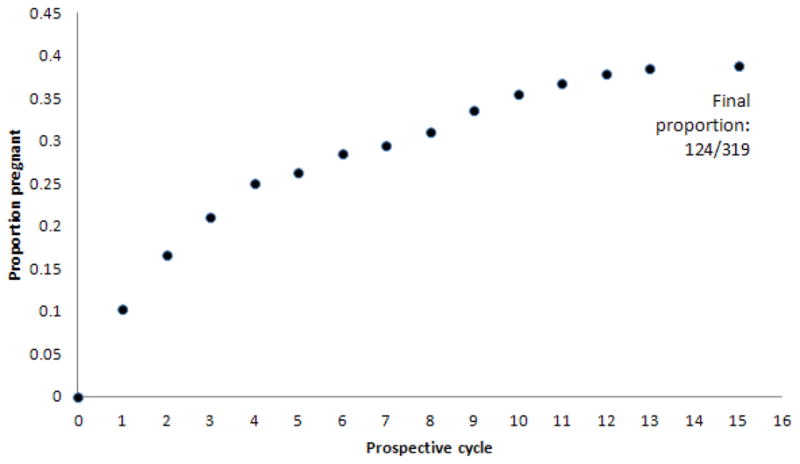
Cumulative proportion of genotyped women achieving pregnancy during the study.
The 319 women who were genotyped for NAT2 were not different from the other 151 women for any of the characteristics shown in Table I, with the exception of BMI, where there were fewer women with BMI <18.5 who were successfully genotyped than expected. The p-values in Table 1 were obtained by comparing the distribution of characteristics of those who were genotyped (N=319) to those who were not genotyped (N=151).
The median intakes of the exposures of interest were 2 alcoholic drinks per week (IQR: 0, 5); 2 caffeinated beverages per day (IQR: 1,3); and 0 cigarettes per day (IQR: 0, 1). The maximum reported values for any cycle were 68 alcoholic drinks per week, 17 caffeinated beverages per day, and 56 cigarettes per day; each maximum value came from a different participant.
NAT2 Genotyping Results
The minor allele frequencies of the NAT2 SNPs among non-Hispanic whites were similar to those in the CEU population of HapMap (Utah residents of Northern and Western European ancestry): 0.39 for rs1799929, 0.30 for rs1799930, and 0.40 for rs1208 in the study sample, compared with 0.42, 0.30, and 0.39 in HapMap (31, 32). The concordance of genotype duplicates was 100% for all three SNPs. The frequency of the rapid acetylator haplotype in the sample was 0.28, and thus the frequency of the slow acetylator haplotype was 0.72. Of the 319 women, 161 (50%) carried two copies of a slow haplotype and were assigned “slow” acetylator status. The other individuals carried at least one copy of the rapid acetylator haplotype and were assigned “rapid” acetylator status. Of the non-Hispanic whites, 54% were slow acetylators; this is consistent with other estimates (59%, 62%) in other Caucasian populations (27). African-Americans had a higher proportion of rapid acetylators than whites (65% vs. 46%).
Effects of Smoking, Alcohol and Caffeine on Time to Pregnancy
The multivariable model shown in Table II includes the three exposures of interest along with covariates that were significantly associated with fecundability. Age at menarche, marital status, ethnicity, black race, other race, partner’s age, and gravidity (0, >0) were not associated with fecundability when included as covariates, and did not meaningfully alter the associations of caffeine, alcohol, or smoking with fecundability (results not shown). Older age and obesity (BMI>30) were significantly associated with reduced fecundability (FOR < 1). A higher frequency of unprotected intercourse during the ovulatory window and the intention to become pregnant were associated with a higher fecundability (FOR > 1).
Table II.
Associations with Time to Pregnancy in a Multivariable Modela
| Variable | Fecundability odds ratio | 95% CI | Score test P-value (two-sided) |
|---|---|---|---|
| Age (per year) | 0.96 | 0.92, 1.00 | 0.04 |
| Unprotected intercourse during the ovulatory window (times per window) | 1.36 | 1.25, 1.48 | < 0.0001 |
| Trying to get pregnant | 0.002 | ||
| No | Ref | ||
| Yes | 1.80 | 1.23, 2.60 | |
| Body mass index (kg/m2) | 0.02 | ||
| <18.5 | 0.69 | 0.27, 1.75 | |
| 18.5–<25 | Ref | ||
| 25–<30 | 0.83 | 0.54, 1.30 | |
| 30+ | 0.40 | 0.21, 0.73 | |
| Average caffeine intake | 0.83 | ||
| <150 mg/day | Ref | ||
| 150–300 mg/day | 1.02 | 0.67, 1.56 | |
| 300+ mg/day | 0.89 | 0.58, 1.38 | |
| Average alcohol intake | 0.05 | ||
| None | Ref | ||
| <1 drink/day | 0.70 | 0.47, 1.04 | |
| ≥1 drink/day | 0.50 | 0.28, 0.89 | |
| Smoking | 0.80 | ||
| None | Ref | ||
| <10 cigarettes/day | 1.04 | 0.65, 1.67 | |
| ≥10 cigarettes/day | 1.19 | 0.71, 2.00 |
All variables listed are in the model simultaneously.
Alcohol intake was significantly associated with reduced fecundability. A dose-response effect was apparent, with those who drink <1 drink/day experiencing a 30% reduction, and those who drink 1+ drinks/day experiencing a 50% reduction in the FOR when compared to nondrinkers (Table II; FOR: 0.50; 95% CI: 0.28, 0.89). Smoking and caffeine were not associated with fecundability in this model whether modeled categorically (as shown) or continuously as cigarettes per day or milligrams of caffeine per day (results not shown). Including prior cycles at risk as a covariate in the analysis (as opposed to prospectively measured cycles) did not alter the results.
Interactions with NAT2
The three interaction models revealed significant interactions between NAT2 status and smoking and alcohol, but not caffeine (Table III). Models adjusted for age only are presented, as well as fully adjusted models which include the important covariates shown in Table II. The minimally adjusted models suggested possible interactions between alcohol and smoking with NAT2 status. The fully adjusted models revealed statistically significant interactions. In the NAT2/smoking interaction model, the FOR for smoking among slow acetylators was 0.34 (95% CI: 0.22, 0.90) and among rapid acetylators was 1.65 (0.93, 2.94) (two-sided Pinteraction= 0.002). These values can be calculated from the values shown in Table III (e.g., the effect of smoking among slow acetylators = 0.35/1.05 = 0.34). In the NAT2/alcohol interaction model, the FOR for alcohol (≥1 vs <1 drink/day) was 0.20 (0.05, 0.92) among slow acetylators and 1.16 (0.61, 2.22) among rapid acetylators (Pinteraction = 0.03). There was no interaction between NAT2 and caffeine intake (≥300 vs. <300 mg/day): among slow acetylators, FOR= 0.81 (0.36, 1.81); among rapid, FOR=0.96 (0.50, 1.85).
Table III.
Models Examining Interactions with NAT2 Acetylator Status
| Adjusted for age (N=319 women; 2413 cycles) | Adjusted for variables shown in Table IIa (N= 295 women; 2327 cycles) | ||||||||
|---|---|---|---|---|---|---|---|---|---|
| Interaction Modela | NAT2 status/exposure | N cyclesb | Fecund-ability odds ratio | 95% CI | Score test P-value for interaction (two-sided) | N cycles | Fecund-ability odds ratio | 95% CI | Score test P-value for interaction (two-sided) |
| NAT2/Caffeine (mg/day) | Rapid/<300 | 859 | (ref) | 0.35 | 822 | (ref) | 0.21 | ||
| Slow/<300 | 871 | 0.75 | 0.49, 1.15 | 839 | 0.72 | 0.45, 1.14 | |||
| Rapid/≥300 | 292 | 0.93 | 0.50, 1.73 | 292 | 0.96 | 0.50, 1.85 | |||
| Slow/≥300 | 387 | 0.62 | 0.34, 1.14 | 374 | 0.58 | 0.30, 1.12 | |||
|
| |||||||||
| NAT2/Alcohol (drinks/day) | Rapid/<1 | 881 | (ref) | 0.07 | 844 | (ref) | 0.03 | ||
| Slow/<1 | 1086 | 0.80 | 0.54, 1.19 | 1040 | 0.83 | 0.54, 1.28 | |||
| Rapid/≥1 | 270 | 0.92 | 0.50, 1.69 | 270 | 1.16 | 0.61, 2.22 | |||
| Slow/≥1 | 176 | 0.18 | 0.04, 0.73 | 173 | 0.17 | 0.04, 0.72 | |||
|
| |||||||||
| NAT2/Smoking | Rapid/Nonsmoker | 751 | (ref) | 0.03 | 714 | (ref) | 0.002 | ||
| Slow/Nonsmoker | 871 | 0.91 | 0.59, 1.41 | 842 | 1.05 | 0.64, 1.70 | |||
| Rapid/Smoker | 400 | 1.06 | 0.63, 1.78 | 400 | 1.65 | 0.93, 2.94 | |||
| Slow/Smoker | 388 | 0.34 | 0.16, 0.74 | 372 | 0.35 | 0.15, 0.82 | |||
Fully adjusted models include age, BMI, frequency of unprotected intercourse during the ovulatory window, and pregnancy intention, as in Table II. The model examining smoking interaction was also adjusted for caffeine and alcohol, in the categories shown in Table II; the model examining alcohol interaction was adjusted for caffeine and smoking; and likewise for caffeine.
The number of cycles for the fully adjusted model is shown. A woman may be in one exposure category (e.g., slow/smoker) for one cycle and a different category (e.g., slow/nonsmoker) for the next. Each woman contributed an average of 8 cycles to the study.
In each of these models, NAT2 acetylator status alone was not significantly associated with fecundability, though there was some suggestion that rapid acetylators have a higher fecundability. When acetylator status was added to the no-interaction model in Table II, the fecundability odds ratio comparing rapid vs. slow acetylators was 1.44 (95% CI: 0.89, 2.35).
When the three interaction models shown in Table III were restricted to the non-Hispanic whites (N=247), the smoking/NAT2 interaction was still significant (Pinteraction=0.03) and the significance of the alcohol/NAT2 interaction was not changed (Pinteraction =0.03). The effect estimates for the interaction models were similar (data not shown).
Factors Associated with Retention in the Study
To investigate whether differential drop-out from the study may have biased our results, we compared characteristics of those who remained in the study for more than 6 cycles with those who voluntarily left the study during or before the 6th cycle. We excluded women who became pregnant during or before the 6th cycles from this analysis since they did not have an opportunity to remain in the study past 6 cycles. Women who remained in the study were not different from women who dropped out with respect to age, race, ethnicity, body mass index, current smoking, alcohol consumption, caffeine consumption, or NAT2 acetylator status (Chi-square p>0.10 for each variable; results not shown). However, women who remained in the study had higher levels of education (p=0.05).
DISCUSSION
In this study, we estimated the effects of caffeine, alcohol, and smoking on fecundability, and assessed whether these effects were modified by NAT2 acetylator activity. No effect of caffeine on fecundability was found, regardless of NAT2 acetylator status. Smoking and alcohol significantly reduced fecundability, but only among women who were slow acetylators. These associations and interactions were adjusted for potential confounders including age, frequency of unprotected intercourse, intention to become pregnant, and BMI, and also persisted when the population was restricted to non-Hispanic whites.
Although several studies have observed a detrimental effect of smoking on fecundability (9, 33–35) others have not (6, 7, 36). Without stratifying on NAT2, no effect of smoking was observed in this study. Thus, it is possible that genetic heterogeneity obscured the effect of smoking on fecundability in previous studies.
There are several mechanisms by which smoking may affect fecundability, which are discussed in a recent review (3). Smoking has been related to measures of ovarian aging, including increased levels of follicle-stimulating hormone (FSH) and decreased levels of antimullerian hormone (AMH) (37–39). Smoking may also cause alterations in estrogen synthesis and metabolism (40), irregular menstrual cycles (40, 41), and chromosomal errors (42). Each of these effects could theoretically be mediated by a combination of toxicants present in cigarette smoke; however, the observed interaction between smoking and NAT2 on fecundability suggests that any effects of smoking on fecundability are mediated by the aromatic and heterocyclic amine carcinogens found in cigarette smoke which are metabolized by NAT2 (13).
A significant effect of alcohol on fecundability was observed in this population without accounting for NAT2. However, a more detailed examination revealed that the effect was limited to the slow acetylators. While there is presently no evidence that NAT2 could directly metabolize ethanol, other studies have also reported an interaction between NAT2 and alcohol use with respect to various outcomes. In one study, alcohol intake was associated with increased risk of oral squamous cell cancer, but only among rapid or intermediate acetylators (43). In a case-control study of bladder cancer, alcohol had a much stronger effect among slow acetylators (44). One explanation is that alcohol intake may be correlated with intake of other toxicants present in alcoholic beverages (e.g., ethyl carbamates, tetra-beta carbolines, or food additives) or other substances (e.g., cooked meat) which contain toxicants that are metabolized by NAT2 (45, 46). Thus, the effect modification observed with alcohol could be a reflection of: 1) the effect modification of the substances correlated with alcohol intake, 2) the alcohol adding to total body burden of toxicants, so that NAT2 and other enzymes cannot metabolize all toxicants as efficiently, or 3) interactions between alcohol and smoking, which we were not able accommodate in our analysis due to the limited sample size.
There was no discernable effect of caffeine on time to pregnancy in this population. This is the first study to report findings from daily, prospective information on caffeine intake and prospectively ascertained pregnancies, including subclinical pregnancies, while controlling for frequency of intercourse, smoking and alcohol. While our findings are consistent with many null or equivocal studies of caffeine intake and reproductive outcomes (2), misclassification of caffeine intake could have biased any effect estimates towards the null. In a recent validity study, self-reported caffeine use in a prospective daily diary was moderately correlated with salivary caffeine concentrations (r = 0.68) (47). In addition, our study assumed that each cup of coffee (or tea, or soda) contained the same amount of caffeine, but in reality this varies, causing further misclassification. In addition, we did not have measurements from other caffeine sources such as chocolate or medications.
A limitation of this study was the small numbers in some of the risk groups, resulting in wide confidence intervals for some measures. Only a subset of the women could be genotyped, which affected the final sample size. However, there were no differences in characteristics between the studied eligible women (319) and those with insufficient DNA, reducing the likelihood that our subsampling resulted in selection bias. In addition, NAT2 SNP frequencies were virtually identical to those found in the CEU population of HapMap, further indicating that this subset was a representative sample.
Another limitation of this study is that we did not have information on the partner’s behaviors, such as smoking. These behaviors might have altered the fecundability of some women, though it should not meaningfully change the interaction between the women’s acetylator status and her exposures on fecundability.
There was some misclassification of the measurement of unprotected intercourse, made evident by the fact that 12 women became pregnant even though they did not report having unprotected intercourse. Women may have misreported their unprotected intercourse, or birth control may not have been effective. For this reason, we included women in the analysis whether or not they reported having unprotected intercourse. Our inclusion of some women who may not have truly been at risk for pregnancy may have reduced the overall apparent fecundability of this population. A sensitivity analysis restricted to cycles in which unprotected intercourse was reported did not have meaningfully different effect estimates, though p-values were attenuated for some variables due to reduced sample size and power (data not shown).
The lower apparent fecundability of this population compared to populations in other prospective studies may be a result of several additional factors. First, we did not exclude subfecund women (women who were at risk for pregnancy 1–12 months prior to the study). These women may also have different susceptibilities to factors that affect pregnancy rates, such as smoking or alcohol intake. Second, only 23% of the women in this sample reported that they were consciously trying to become pregnant. Of those who reported trying (N=73), the fecundability was higher (58% became pregnant during the study). Finally, women office workers are known to be less fertile than the general population, due to the concept of the “infertile worker effect”: in essence, by limiting the sample to office workers, we have excluded fertile women who may be at home already taking care of children (48).
Because this population consisted of a mixture of women with varying pregnancy intentions, it is more representative of the general population than other studies that restrict to women who are all attempting pregnancy. During the years of this study approximately 50% of all pregnancies in the U.S. were unintended (49). However, our study is subject to possible confounding by factors associated with pregnancy intention. We attempted to control for such unmeasured confounders by adjusting for stated pregnancy intention and frequency of unprotected intercourse during the ovulatory window. Women who were attempting pregnancy were not different from the remaining women by age, smoking, alcohol intake, or caffeine intake (results not shown).
The apparent effects of alcohol and smoking on time to pregnancy could be a result of very early pregnancy losses (before the expected start of the next menstrual cycle), as opposed to a delay in conception. In our study we tested hCG at the start of every bleeding segment (or 1 week after expected menses) and included all subclinical pregnancies in the analysis. However, losses occurring close to implantation may have been missed in our analysis.
In summary, we observed strong and significant effects of alcohol and smoking on time to pregnancy among women who were slow NAT2 acetylators. When slow and rapid acetylators were combined, the effects of alcohol were attenuated and the effects of smoking were no longer detectable. This research emphasizes the need to incorporate genetic information about metabolic enzymes to better interpret and understand the effects of xenobiotics on human health.
Acknowledgments
This work was supported by funding from the National Institutes of Health (RO1HD24618, RO3HD55176, R01HG03618), and the University Research Committee of Emory University. This manuscript was developed under a STAR Research Assistance Agreement No. 916891 awarded by the U.S. Environmental Protection Agency. It has not been formally reviewed by the EPA. The views expressed in this manuscript are solely those of the authors and the EPA does not endorse any products or commercial services mentioned in this manuscript.
ABBREVIATIONS
- AMH
antimullerian hormone
- BMI
body mass index (kg/m2)
- CEU
Utah residents with Northern and Western European ancestry
- CI
confidence interval
- DNA
deoxyribonucleic acid
- FOR
fecundability odds ratio
- FSH
follicle-stimulating hormone
- hCG
human chorionic gonadotropin
- IQR
interquartile range
- kg
kilogram
- m
meter
- μL
microliter
- mg
milligram
- MAF
minor allele frequency
- NAT2
N-acetyltransferase-2 (Gene)
- NAT2
N-acetyltransferase-2 (Protein)
- ng
nanogram
- OR
odds ratio
- rs
reference SNP
- SE
standard error
- SNP
single nucleotide polymorphism
Footnotes
Publisher's Disclaimer: This is a PDF file of an unedited manuscript that has been accepted for publication. As a service to our customers we are providing this early version of the manuscript. The manuscript will undergo copyediting, typesetting, and review of the resulting proof before it is published in its final citable form. Please note that during the production process errors may be discovered which could affect the content, and all legal disclaimers that apply to the journal pertain.
References
- 1.Baird DD, Wilcox AJ, Weinberg CR. Use of time to pregnancy to study environmental exposures. Am J Epidemiol. 1986;124:470–480. doi: 10.1093/oxfordjournals.aje.a114417. [DOI] [PubMed] [Google Scholar]
- 2.Sadeu JC, Hughes CL, Agarwal S, Foster WG. Alcohol, drugs, caffeine, tobacco, and environmental contaminant exposure: reproductive health consequences and clinical implications. Crit Rev Toxicol. 2010;40:633–652. doi: 10.3109/10408444.2010.493552. [DOI] [PubMed] [Google Scholar]
- 3.Dechanet C, Anahory T, Mathieu Daude JC, Quantin X, Reyftmann L, Hamamah S, et al. Effects of cigarette smoking on reproduction. Hum Reprod Update. 2011;17:76–95. doi: 10.1093/humupd/dmq033. [DOI] [PubMed] [Google Scholar]
- 4.Wilcox A, Weinberg C, Baird D. Caffeinated beverages and decreased fertility. Lancet. 1988;2:1453–1456. doi: 10.1016/s0140-6736(88)90933-6. [DOI] [PubMed] [Google Scholar]
- 5.Hakim RB, Gray RH, Zacur H. Alcohol and caffeine consumption and decreased fertility. Fertil Steril. 1998;70:632–637. doi: 10.1016/s0015-0282(98)00257-x. [DOI] [PubMed] [Google Scholar]
- 6.Florack EI, Zielhuis GA, Rolland R. Cigarette smoking, alcohol consumption, and caffeine intake and fecundability. Prev Med. 1994;23:175–180. doi: 10.1006/pmed.1994.1024. [DOI] [PubMed] [Google Scholar]
- 7.Buck Louis GM, Dmochowski J, Lynch C, Kostyniak P, McGuinness BM, Vena JE. Polychlorinated biphenyl serum concentrations, lifestyle and time-to-pregnancy. Human Reproduction. 2009;24:451–458. doi: 10.1093/humrep/den373. [DOI] [PMC free article] [PubMed] [Google Scholar]
- 8.Jensen TK, Hjollund NH, Henriksen TB, Scheike T, Kolstad H, Giwercman A, et al. Does moderate alcohol consumption affect fertility? Follow up study among couples planning first pregnancy. BMJ. 1998;317:505–510. doi: 10.1136/bmj.317.7157.505. [DOI] [PMC free article] [PubMed] [Google Scholar]
- 9.Jensen TK, Henriksen TB, Hjollund NH, Scheike T, Kolstad H, Giwercman A, et al. Adult and prenatal exposures to tobacco smoke as risk indicators of fertility among 430 Danish couples. Am J Epidemiol. 1998;148:992–997. doi: 10.1093/oxfordjournals.aje.a009576. [DOI] [PubMed] [Google Scholar]
- 10.Buck Louis GM, Lynch CD, Cooney MA. Environmental influences on female fecundity and fertility. Seminars in Reproductive Medicine. 2006;24:147–155. doi: 10.1055/s-2006-944421. [DOI] [PubMed] [Google Scholar]
- 11.Blum M, Grant DM, McBride W, Heim M, Meyer UA. Human arylamine N-acetyltransferase genes: isolation, chromosomal localization, and functional expression. DNA Cell Biol. 1990;9:193–203. doi: 10.1089/dna.1990.9.193. [DOI] [PubMed] [Google Scholar]
- 12.Weber WW, Hein DW. N-acetylation pharmacogenetics. Pharmacol Rev. 1985;37:25–79. [PubMed] [Google Scholar]
- 13.Kataoka H, Kijima K, Maruo G. Determination of mutagenic heterocyclic amines in combustion smoke samples. Bull Environ Contam Toxicol. 1998;60:60–67. doi: 10.1007/s001289900591. [DOI] [PubMed] [Google Scholar]
- 14.Sim E, Lack N, Wang CJ, Long H, Westwood I, Fullam E, et al. Arylamine N-acetyltransferases: structural and functional implications of polymorphisms. Toxicology. 2008;254:170–183. doi: 10.1016/j.tox.2008.08.022. [DOI] [PubMed] [Google Scholar]
- 15.Hein DW, Doll MA, Fretland AJ, Leff MA, Webb SJ, Xiao GH, et al. Molecular Genetics and Epidemiology of the NAT1 and NAT2 Acetylation Polymorphisms. Cancer Epidemiol Biomarkers Prev. 2000;9:29–42. [PubMed] [Google Scholar]
- 16.Makarova SI. Human N-acetyltransferases and drug-induced hepatotoxicity. Curr Drug Metab. 2008;9:538–545. doi: 10.2174/138920008784892047. [DOI] [PubMed] [Google Scholar]
- 17.Risch A, Wallace DM, Bathers S, Sim E. Slow N-acetylation genotype is a susceptibility factor in occupational and smoking related bladder cancer. Hum Mol Genet. 1995;4:231–236. doi: 10.1093/hmg/4.2.231. [DOI] [PubMed] [Google Scholar]
- 18.Moslehi R, Chatterjee N, Church TR, Chen J, Yeager M, Weissfeld J, et al. Cigarette smoking, N-acetyltransferase genes and the risk of advanced colorectal adenoma. Pharmacogenomics. 2006;7:819–829. doi: 10.2217/14622416.7.6.819. [DOI] [PubMed] [Google Scholar]
- 19.Marcus M, Gerr F. Upper extremity musculoskeletal symptoms among female office workers: associations with video display terminal use and occupational psychosocial stressors. Am J Ind Med. 1996;29:161–170. doi: 10.1002/(SICI)1097-0274(199602)29:2<161::AID-AJIM6>3.0.CO;2-V. [DOI] [PubMed] [Google Scholar]
- 20.Marcus M, McChesney R, Golden A, Landrigan P. Video Display Terminals and miscarriages. J Am Med Wom Assoc. 2000;55:84–88. [PubMed] [Google Scholar]
- 21.Yen SS, Jaffe RB. Reproductive Endocrinology: Physiology, Pathophysiology, and Clinical Management. 4. W. B. Saunders; Philadelphia: 1998. [Google Scholar]
- 22.Waller K, Swan SH, Windham GC, Fenster L, Elkin EP, Lasley BL. Use of urine biomarkers to evaluate menstrual function in healthy premenopausal women. American Journal of Epidemiology. 1998;147:1071–1080. doi: 10.1093/oxfordjournals.aje.a009401. [DOI] [PubMed] [Google Scholar]
- 23.Bunker ML, McWilliams M. Caffeine content of common beverages. J Am Diet Assoc. 1979;74:28–32. [PubMed] [Google Scholar]
- 24.Stephens M, Donnelly P. A comparison of bayesian methods for haplotype reconstruction from population genotype data. Am J Hum Genet. 2003;73:1162–1169. doi: 10.1086/379378. [DOI] [PMC free article] [PubMed] [Google Scholar]
- 25.Stephens M, Smith NJ, Donnelly P. A new statistical method for haplotype reconstruction from population data. Am J Hum Genet. 2001;68:978–989. doi: 10.1086/319501. [DOI] [PMC free article] [PubMed] [Google Scholar]
- 26.Cascorbi I, Drakoulis N, Brockmoller J, Maurer A, Sperling K, Roots I. Arylamine N-acetyltransferase (NAT2) mutations and their allelic linkage in unrelated Caucasian individuals: correlation with phenotypic activity. Am J Hum Genet. 1995;57:581–592. [PMC free article] [PubMed] [Google Scholar]
- 27.Gross M, Kruisselbrink T, Anderson K, Lang N, McGovern P, Delongchamp R, et al. Distribution and Concordance of N-Acetyltransferase Genotype and Phenotype in an American Population. Cancer Epidemiol Biomarkers Prev. 1999;8:683–692. [PubMed] [Google Scholar]
- 28.Beckman Coulter I. In: GenomeLab SNPstream Genotyping System 48-plex Training Guide. Beckman Coulter I, editor. Beckman Coulter, Inc; Fullerton, CA: 2005. [Google Scholar]
- 29.Small CM, Manatunga AK, Klein M, Feigelson HS, Dominguez CE, McChesney R, et al. Menstrual cycle characteristics: associations with fertility and spontaneous abortion. Epidemiology. 2006;17:52–60. doi: 10.1097/01.ede.0000190540.95748.e6. [DOI] [PubMed] [Google Scholar]
- 30.Scheike TH, Keiding N. Design and analysis of time-to-pregnancy. Statistical Methods in Medical Research. 2006;15:127–140. doi: 10.1191/0962280206sm435oa. [DOI] [PubMed] [Google Scholar]
- 31.Frazer KA, Ballinger DG, Cox DR, Hinds DA, Stuve LL, Gibbs RA, et al. A second generation human haplotype map of over 3.1 million SNPs. Nature. 2007;449:851–61. doi: 10.1038/nature06258. [DOI] [PMC free article] [PubMed] [Google Scholar]
- 32.The International HapMap Project. Nature. 2003;426:789–796. doi: 10.1038/nature02168. [DOI] [PubMed] [Google Scholar]
- 33.Olsen J, Rachootin P, Schiodt AV, Damsbo N. Tobacco use, alcohol consumption and infertility. Int J Epidemiol. 1983;12:179–184. doi: 10.1093/ije/12.2.179. [DOI] [PubMed] [Google Scholar]
- 34.Curtis KM, Savitz DA, Arbuckle TE. Effects of cigarette smoking, caffeine consumption, and alcohol intake on fecundability. Am J Epidemiol. 1997;146:32–41. doi: 10.1093/oxfordjournals.aje.a009189. [DOI] [PubMed] [Google Scholar]
- 35.Hassan MA, Killick SR. Negative lifestyle is associated with a significant reduction in fecundity. Fertil Steril. 2004;81:384–392. doi: 10.1016/j.fertnstert.2003.06.027. [DOI] [PubMed] [Google Scholar]
- 36.de Mouzon J, Spira A, Schwartz D. A prospective study of the relation between smoking and fertility. Int J Epidemiol. 1988;17:378–384. doi: 10.1093/ije/17.2.378. [DOI] [PubMed] [Google Scholar]
- 37.Kinney A, Kline J, Kelly A, Reuss ML, Levin B. Smoking, alcohol and caffeine in relation to ovarian age during the reproductive years. Hum Reprod. 2007;22:1175–1185. doi: 10.1093/humrep/del496. [DOI] [PubMed] [Google Scholar]
- 38.Freour T, Masson D, Mirallie S, Jean M, Bach K, Dejoie T, et al. Active smoking compromises IVF outcome and affects ovarian reserve. Reproductive biomedicine online. 2008;16:96–102. doi: 10.1016/s1472-6483(10)60561-5. [DOI] [PubMed] [Google Scholar]
- 39.Plante BJ, Cooper GS, Baird DD, Steiner AZ. The impact of smoking on antimullerian hormone levels in women aged 38 to 50 years. Menopause. 2010;17:571–576. doi: 10.1097/gme.0b013e3181c7deba. [DOI] [PMC free article] [PubMed] [Google Scholar]
- 40.Shiverick KT, Salafia C. Cigarette smoking and pregnancy I: ovarian, uterine and placental effects. Placenta. 1999;20:265–272. doi: 10.1053/plac.1998.0377. [DOI] [PubMed] [Google Scholar]
- 41.Rowland AS, Baird DD, Long S, Wegienka G, Harlow SD, Alavanja M, et al. Influence of medical conditions and lifestyle factors on the menstrual cycle. Epidemiology. 2002;13:668–674. doi: 10.1097/00001648-200211000-00011. [DOI] [PubMed] [Google Scholar]
- 42.Zenzes MT. Smoking and reproduction: gene damage to human gametes and embryos. Hum Reprod Update. 2000;6:122–131. doi: 10.1093/humupd/6.2.122. [DOI] [PubMed] [Google Scholar]
- 43.Chen C, Ricks S, Doody DR, Fitzgibbons ED, Porter PL, Schwartz SM. N-Acetyltransferase 2 polymorphisms, cigarette smoking and alcohol consumption, and oral squamous cell cancer risk. Carcinogenesis. 2001;22:1993–1999. doi: 10.1093/carcin/22.12.1993. [DOI] [PubMed] [Google Scholar]
- 44.Lu CM, Chung MC, Huang CH, Ko YC. Interaction Effect in Bladder Cancer between N-Acetyltransferase 2 Genotype and Alcohol Drinking. Urologia Internationalis. 2005;75:360–364. doi: 10.1159/000089175. [DOI] [PubMed] [Google Scholar]
- 45.Hein DW. Molecular genetics and function of NAT1 and NAT2: role in aromatic amine metabolism and carcinogenesis. Mutation research. 2002;506–507:65–77. doi: 10.1016/s0027-5107(02)00153-7. [DOI] [PubMed] [Google Scholar]
- 46.Rehm J, Kanteres F, Lachenmeier DW. Unrecorded consumption, quality of alcohol and health consequences. Drug and alcohol review. 2010;29:426–436. doi: 10.1111/j.1465-3362.2009.00140.x. [DOI] [PubMed] [Google Scholar]
- 47.Addicott M, Yang L, Peiffer A, Laurienti P. Methodological considerations for the quantification of self-reported caffeine use. Psychopharmacology. 2009;203:571–578. doi: 10.1007/s00213-008-1403-5. [DOI] [PMC free article] [PubMed] [Google Scholar]
- 48.Joffe M. Biases in research on reproduction and women’s work. International journal of epidemiology. 1985;14:118–23. doi: 10.1093/ije/14.1.118. [DOI] [PubMed] [Google Scholar]
- 49.Henshaw SK. Unintended pregnancy in the United States. Fam Plann Perspect. 1998;30:24–29. 46. [PubMed] [Google Scholar]