


Abstract
Accurate prediction of protein–DNA complexes could provide an important stepping stone towards a thorough comprehension of vital intracellular processes. Few attempts were made to tackle this issue, focusing on binding patch prediction, protein function classification and distance constraints-based docking. We introduce ParaDock: a novel ab initio protein–DNA docking algorithm. ParaDock combines short DNA fragments, which have been rigidly docked to the protein based on geometric complementarity, to create bent planar DNA molecules of arbitrary sequence. Our algorithm was tested on the bound and unbound targets of a protein–DNA benchmark comprised of 47 complexes. With neither addressing protein flexibility, nor applying any refinement procedure, CAPRI acceptable solutions were obtained among the 10 top ranked hypotheses in 83% of the bound complexes, and 70% of the unbound. Without requiring prior knowledge of DNA length and sequence, and within <2 h per target on a standard 2.0 GHz single processor CPU, ParaDock offers a fast ab initio docking solution.
INTRODUCTION
As DNA is believed today to be the carrier of genetic information in all living organisms, and while all DNA functions within the living cell, including among others, transcription, replication, damage repair, packing and strand splitting, are dependent on interaction with proteins, the study of DNA–protein binding is of high significance. Comprehensive understanding of these interactions, of which uncovering of the structural protein–DNA complex is a vital component, will most likely provide important insights to the inner cell systems, such as gene expression mechanisms, and DNA-related diseases. Although many studies tackled various aspects of protein–DNA binding, no well-established algorithm exists yet for ab initio protein–DNA docking, an important stepping stone in the establishment of an accurate complex structure.
A vital key to the comprehension and prediction of DNA–protein interaction lies in the broad and general characterization of the complex's intermolecular interface, and the conformational changes undergone by the participating molecules during binding.
Among the first characteristics to be spotted in the early DNA–protein complexes found, was the abundance of positively charged amino acids concentrated in the binding site upon the protein surface (1,2). This positive electrostatic charge is assumed to complement the negative charge found on the B-form DNA surface, mainly on its backbone. It was further suggested in some studies, that this electrostatic compatibility steers protein–DNA recognition, and is the source of the primary force pulling the molecules together (3,4).
A comprehensive study of protein surface patches taking part in DNA binding was performed by Thornton and colleagues (5). All intermolecular contacts between protein and DNA atoms were surveyed in 129 protein–DNA complex structures. One of the main insights of this study is that two-thirds of all protein–DNA interactions involve van der Waals contacts, while about one-sixth of the contacts are due to hydrogen bonds and another one-sixth to water mediated bonds. Interestingly, they also found that for all interaction types over two-thirds of contacts are made with the DNA backbone, which is independent of the DNA sequence. Furthermore, this study displayed the significant propensity of certain amino acids to be included in the interface.
Further work done by Thornton and colleagues (6), embodies the comparison between the abilities of five different score functions to distinguish the native binding site on the protein surface from equally sized decoys on that same protein. The scores studied were each based on one of the following properties of the candidate binding site: ASA (accessible surface area), amino acid propensities, electrostatic charge, hydrophobicity and residue conservation. The electrostatic and amino acid propensity-based scores, have shown good performance, while all three remaining scores exhibited poor prediction ability.
Although DNA is found in nature almost solely in B-form, namely, in double-stranded structure of a unique repeating shape (7), this native DNA structure changes noticeably when bound to a protein. Some changes are local, others global. A protein–DNA benchmark published by Van Dijk and Bonvin (8), contains an assembly of 47 complexes covering most major groups of DNA binding proteins, as defined by Luscombe et al. (9). In this benchmark, interface RMSD was calculated for each complex, resulting in 12 complexes displaying over 5.0 Å IRMSD, and another 22 of >2.0 Å, thus demonstrating the magnitude of structural deformation in protein DNA binding, projecting on its importance and effect on docking attempts. The IRMSD was calculated for all Cα atoms in the protein and phosphate atoms in the DNA belonging to interface residues and nucleotides, respectively.
One specific perspective (10) classifies DNA molecular deformations found in the majority of the complexes into just a few types: bending, twisting, groove widening or compression and base flipping. Visualization of such deformations can be seen in Figure 1, and representatives of all types can be found in the previously mentioned benchmark (8). Despite the numerous types, bending is the most common, and, more importantly, noticeably has the greatest effect on the DNA molecule global shape, whereas other types of structure distortion are of a local character.
Figure 1.

Various conformational changes undergone by DNA molecules when bound to proteins: (a) base flipping (1EMH); (b) helix unwinding (1EYU); (c) bending (1O3T); (d) A-form helix (1QRV).
Various methods have been applied to predict different aspects of protein–DNA binding, ranging from protein function classification, to full structural docking solutions. Mandel-Gutfreund and colleagues (11) introduced an algorithm locating the largest positively charged patch on the protein surface, and used its size and average potential to indicate whether the protein is DNA binding or not. Thornton and colleagues (6) have employed, as described earlier, diverse scoring functions to distinguish the native binding site among decoys. Machine-learning methods, such as SVM and perceptron were employed to identify the binding site, based on sequential motifs and conserved residue data (12–14). All mentioned attempts showed ability to predict the binding site with non trivial probability, but none managed to achieve >85% accuracy.
Recent publications (15,16) by Bonvin and colleagues embody the first large-scale head on confrontation with protein–DNA docking. The HADDOCK algorithm, applied to the whole (previously discussed) benchmark, modeling both protein and DNA flexibility, displayed highly accurate results. The algorithm utilizes distance constraints extracted from experimental data (gathered from various possible sources, such as NMR, conservation data, etc.), to reconstruct and refine the protein–DNA complex. In a recent paper (16), the experimental data was replaced with the derivation of ambiguous interaction restraints based in the interface information derived directly from the (known) protein-DNA complexes. The results, measured by the CAPRI (Critical Assessment of PRedicted Interactions) standards of FNAT (frequency of native contacts) and IRMS (Interface RMS) (17), included a high proportion of extremely accurate solutions, depicting HADDOCK's ability to accurately predict DNA–protein complexes, provided that the bulk of the interface distance constraints are supplied a priori by experiment or other prior knowledge.
In this work, we introduce ParaDock: an ab initio, rigid protein–flexible DNA docking algorithm. ParaDock relies solely on the protein's structure, to predict its complex with B-form DNA. We employ the aforementioned properties of DNA–protein binding (electrostatics and amino acid propensities) to detect local rigid shape-complementarity based docking solutions. B-form DNA structural repetition is utilized to combine pairs and triplets of such local solutions creating long bent DNA molecules, which are scored and ranked by geometric complementarity.
MATERIALS AND METHODS
Motivation—DNA planarity
Though DNA can be extremely long and an attempt to fully model or analyze its structure and flexibility might be somewhat presumptuous, many studies describe its spatial behavior at various levels, ranging from single base pair positions and angles, to complete chromosome structures. Known protein – DNA complexes, suggest that a scale of up to a few dozen base pairs is relevant for this study. We have already mentioned the centrality of DNA planar bending as can be deduced from (10). Dickerson (18,19) takes a different perspective. Measuring the angular position of each base pair in relation to the helix axis, he classifies each observed deformation as major or minor, and further divides them into three modes—kinks, planar curves and writhes. While smooth planar curves are the least common in his perspective, it can be observed that kinks and minor writhes create approximately planar DNA curves, as the deformation is local. Therefore, apart from major writhed molecules, amounting to 10 out of 86 surveyed complexes, surveyed DNA molecules were approximately planar. To strengthen the claim of DNA planarity at this scale, we have approximated the DNA target molecules of the protein–DNA benchmark (8) with planes. Only an average of 0.08% of the atoms were located farther than 12 Å (DNA helix radius, 20) from the approximated plane, and only in a single complex, 1EMH, the frequency of these distant atoms was >1%—easily explicable by a flipped base (shown in Figure 1a).
These findings naturally suggest the modeling of DNA molecules as planarly bent helices, and this assumption lies in the basis of ParaDock algorithm, significantly reducing the problem's complexity.
Overview
The ParaDock algorithm contains four main stages (illustrated in Figure 2):
Local docking and filtering—local rigid docking solutions of the protein and a short DNA fragment are found using PatchDock (21), and then filtered.
Co-linear pairs of solutions, and co-planar triplets are located, and planar conic (second-order polynomial) curves are generated to fit them.
Molecular solutions are constructed along the candidate curves.
Solutions are scored and ranked by geometrical complementarity.
Figure 2.

Illustration of the ParaDock algorithm. Illustrations are genuine figures from the 1O3T test run.
Algorithm
Paradock's input is a PDB file, containing the sequence and structure of the protein in question. First, we seek to find partial solutions, indicating local complementarity of the protein's shape to a fragment of B-form DNA. We use PatchDock (21), a geometric hashing (22) based rigid docking algorithm, which detects shape complementarity of molecular surfaces. Input to PatchDock is the protein molecule, and a short (6 bp) fragment of B-form DNA, of arbitrary sequence. Program parameters were adjusted to yield 15–30 thousand solutions, each of which is a complex containing the protein and the short DNA fragment, docked together. PatchDock scores the solutions, using a distance transform grid, thus scoring every atom of the ligand (in our case, the short DNA fragment molecule), by its distance from the protein surface. Distant atoms (>1 Å from the surface) are not scored, close atoms (−1, +1 Å) receive a positive score, and penetrating atoms receive a negative score, respective to the penetration depth.
Two other scoring functions have been added to the geometric score calculated by PatchDock, in order to filter out irrelevant partial solutions. A primitive electrostatic score is the number of interacting atoms of the protein, belonging to a positively charged amino acid, minus the number of these belonging to negatively charged amino acids. This score supplies very efficiently a rough approximation of the electrostatic charge of the interface patch on the protein surface. Finally, a third score was devised to account for the amino acid propensities observed by Thornton and colleagues (5) Protein atoms participating in the interface were counted by their residue type, resulting in a 20th dimensional vector. The inner product of this vector and the vector of average propensities found in Ref. (5), weighing both patch composition and size, was used as the third score.
Out of all the solutions generated by PatchDock, a mere 2000, having the highest scores, were left to proceed to the next step, focusing attention on specific areas on the protein surface, possessing properties of electrostatics, geometry and composition, compatible with DNA binding patches.
Next, we exploit the consistency of B-DNA shape, and represent the partial solutions by their central axes only, discarding the molecular data of the DNA. Hence, we are left with a protein molecule, surrounded by a cloud of segments in the 3D space (Figure 2). It should be noted, that the phase of the partial solutions, i.e. their rotational angle around the central axis, is (at this stage) discarded along with the molecular data. It will be implicitly accounted for during scoring.
Utilizing the aforementioned relative planarity of DNA molecules, we now combine pairs and triplets of segments, to generate long planar solutions, employing the known local compatibility to the protein. The segments extracted from the PatchDock filtered results are scanned to find co-linear pairs, and co-planar triplets (with necessary certain tolerances), used in turn to create linear and conic curves, respectively [a conic section (conic) is defined as the intersection curve between a cone and a plane. Thus, conics are second-degree planar curves—ellipses, parabolas and hyperbolas, which can be easily handled as quadratic equations in two variables]. These approximate well the central axes of observed DNA molecules. The produced curves represent the location of the desired DNA molecule central axis, around which we will forthwith build the solution molecule.
The creation of conic curves, which were implemented using CGAL (Computational Geometry Algorithms Library, http://www.cgal.org), may produce undesired artifacts such as complete circles and ellipses, alongside with double branched hyperbolas, all of which are not compatible with known DNA molecules. Thus the calculated curves are trimmed, to consist of a single branch, with an overall turning angle of no >90 degrees. The curve is trimmed to leave a section that has a maximal number of (axis) segments compatible with it. An (axis) segment is defined as compatible to the curve, if it is close to it, and almost parallel to its tangent. Trimmed curves containing points with curvature higher than a certain threshold are filtered out (as very sharp kinks are not common in B-form DNA, and might result in DNA molecules ‘wrapped’ around the protein, thus receiving an artificially high score).
Around the trimmed curve, a DNA molecule needs to be constructed. First, a template molecule of arbitrary sequence is multiplied to create a straight DNA molecule of the desired length. In order to bend this molecule, its central axis is segmented, and each segment is paired with a section on the target curve. Rigid transformations are created, transforming each such segment onto its corresponding section on the curve. Finally, each atom from the straight molecule is transformed onto its location using the appropriate transformation, creating the final bent molecule. Several molecules are created for each curve, using different translations along the central axis, and rotational angles around it. A geometrical score is calculated to choose the final candidate molecule. These final molecules are bent only DNA molecules, not accounting for any other type of flexibility.
Several scoring functions were examined in an attempt to rank the 1000–2000 solutions each complex produced. Electrostatics and amino acid propensities are natural candidates, but as they were already used in the filtering phase, their added value is insignificant. The amount of compatible partial solutions, which was used while trimming the curves, was tested as a score function as well, along with their original individual scores (geometric, electrostatic, propensities), but seem to let the density of the initial solutions weigh heavily on the final ranking. Curvature of the central axis curve might represent the energetic cost of the deformation involved, but has also shown poor performance. Thus the PatchDock geometrical score, which plainly yielded the best results, was used. Program output is therefore a geometrically ranked list of solution complexes, each containing the unchanged protein docked with an arbitrary sequenced DNA molecule, of varying length.
Data set
The Van Dijk and Bonvin benchmark (8) consists of experimentally elucidated complexes of 47 different DNA binding proteins, bound to the DNA, alongside with the native unbound proteins. The benchmark contains representatives of seven out of the eight groups defined in the structural classification of protein DNA complexes by Luscombe et al. (9), categorized by their IRMS (Interface RMS) as easy, intermediate or hard. IRMS is the root mean square deviation between interface atoms of both (DNA and protein) molecules in their bound and unbound versions, representing the magnitude of conformational changes undergone by both molecules when bound to each other. ParaDock was tested on both bound and unbound cases. The DNA molecule was removed from the target complex, leaving the protein structure as the input for ParaDock. In the bound case, the results were compared back with the target complex. As the protein's flexibility is not modeled, ParaDock's output, when run on the unbound protein, must be aligned, first, with the target complex in order to evaluate correctness. This was done by superimposing the unbound protein on its bound conformation in the complex using a Geometric Hashing based structural alignment server (22,23).
Proteins which bind to DNA in a non-monomeric form constitute a significant portion of the benchmark. Since Paradock is currently unable to deal with multiple molecules, only one copy of the protein was left in each complex, both as input and for solution evaluation.
Solution evaluation
Since the ParaDock algorithm is DNA sequence and length independent, some alterations are required in the standard result evaluation measures commonly used in docking benchmarks. Potential difference of length between the target DNA and the DNA output molecule, combined with the arbitrarity of the sequence used to create the solution, does not allow for a straightforward comparison between the two molecules, owing to three facts: (i) the correspondence between the target base pairs and the solution base pairs is undefined; (ii) not all atoms that exist in the target DNA appear in the solution, as the DNA sequences differ; (iii) some base pairs of the target might be missing, and vice versa (as lengths differ). Following the CAPRI docking challenge (17) evaluation methodology, Fnat is the first measure used with a slight adjustment (referred to as Fnat* from here on). Fnat* is calculated as the proportion of native contacts between a nucleotide and an amino acid that appear in the evaluated solution. As the correspondence of the base pairs is not known, all possible correspondences are examined (maintaining continuity and order of the base pairs), and the correspondence presenting the highest Fnat* is counted and also used subsequently for the FNONNAT* and IRMS calculations. To supplement the evaluation, we define FNONNAT* to be the proportion of the contacts found in the evaluated solution that do not exist in the target complex. Interface RMS (IRMS) is calculated between the solution and the target locations of the corresponding backbone atoms in the nucleotides and amino acids, which take part in the interface. IRMS is used to estimate the accuracy of the predicted interface, and it is important not to confuse it with native IRMS used to measure the true conformational change undergone by interface atoms during binding. Another important measure is the number of intermolecular clashes in the solution. A large amount of clashes will inflate the interface in both molecules, creating more contacts between nucleotides and amino acids, thus resulting in high Fnat* numbers. Clashes were defined to fit the CAPRI definition, as non-hydrogen atoms from different molecules, <3 Å apart. It may be noted that the CAPRI evaluation methodology utilizes another measure—ligand RMSD, calculated for the whole ligand, and used as an alternative to IRMS. The DNA molecule ‘tails’ far from the protein are very difficult to predict, and create an increase in ligand RMSD, which is more suited for use with smaller (in diameter) ligands. Since it is fully interchangeable with IRMS in terms of CAPRI standards, we have not used it here. Interface distance threshold was taken as 5 Å. To better perceive these measures, a few solution complexes are illustrated in Figure 3.
Figure 3.

Illustration of best result complexes within the top 10 ranking in four targets. Proteins are shown in blue (differences between bound and unbound versions can be observed), native solution in red, ParaDock solution in green. Trimmed curve (DNA central axis) is colored black.
RESULTS
ParaDock was run on the 47 benchmark complexes, in both bound and unbound versions. For each complex approximately 20 000–30 000 partial solutions were found by PatchDock, usually dispersed over the entire protein surface (as illustrated in Figure 2). The 2000 filtered partial solutions (in most complexes) are distinctly clustered in certain areas (Figure 2), implying either geometric, electrostatic or propensity compatibility in that location on the surface. Within these, 300–500 pairs of collinear solutions were normally located (each of which yields a linear curve), alongside 2–3 million coplanar triplets. While conic curves have 5 degrees of freedom, we have 6 known points on each curve (2 end points for each of the three segments). Requiring that all points will be on the curve disqualified the vast majority of candidate curves, resulting in 1000–2000 solutions of both types. ParaDock was run on a single 2.0 GHz processor, with an average overall run time of ∼2 h (∼45 min of which consumed by PatchDock).
CAPRI definition of an acceptable solution which was used here, is either Fnat* ≥ 0.3, or Fnat* ≥ 0.1 and IRMS <4.0 Å. When tested on the bound version, ParaDock places an acceptable or better solution within the 10 top ranking solutions, in 83% of the cases. From the remaining, another 13% presented a solution with Fnat > 0.2 (failing only to reach IRMS < 4.0 Å).
ParaDock exhibited slightly worse results when run on the unbound version of the benchmark. Scoring parameters were altered to allow more collisions (compensating for the lack of protein flexibility), and a clustering algorithm was applied to filter out similar solutions. An acceptable solution was found in the top 10 of 70% of the complexes, with an additional 17% with Fnat* > 0.2. Illustrations of result complexes are depicted in Figure 3. Both bound and unbound results are detailed in Table 1.
Table 1.
ParaDock results as tested on the benchmark
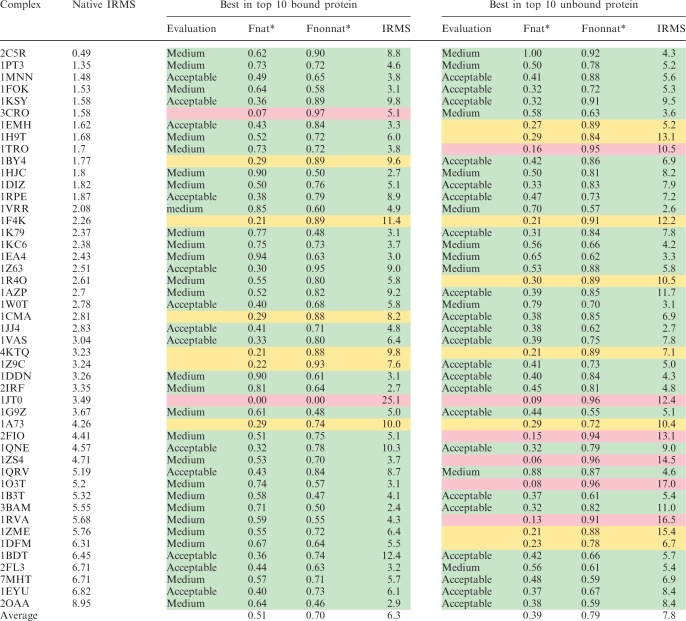 |
Shown are the best solutions within the top 10 ranked.
Native IRMS (Å), IRMS between bound and unbound molecules (8).
Evaluation, solution classification according to CAPRI standards.
Fnat*, the proportion of native contacts between a nucleotide and an amino acid that appear in the evaluated solution.
Fnonnat*, the proportion of the contacts found in the evaluated solution that do not exist in the target complex; IRMS (Å), calculated between the solution and the target locations of all backbone atoms in the nucleotides and amino acids, which take part in the interface.
Interface distance is defined to be 5 Å, as in CAPRI.
The acceptable solutions (both bound and unbound) present an average of 135.5 clashes per solution. More than 60% of these are very shallow clashes (<3 Å deep into the protein), which will most likely be handled easily by a future refinement procedure, leaving an average of 54 non-shallow clashes per solution, well in the neighborhood of normally accepted CAPRI solutions.
DISCUSSION
ParaDock provides a protein–DNA docking solution based entirely on the protein's structure. We have employed generic observations regarding the electrostatic and geometric properties, as well as amino acid-propensities of protein–DNA complexes, and made simplifying assumptions on the flexibility of DNA molecules, thus deriving a simple and fast algorithm, which combines partial binding solutions to predict complexes containing long bent DNA molecules. CAPRI acceptable solutions are within the 10 top ranked solutions in 83% of the bound and 70% of the unbound cases, prior to any form of refinement.
Using the assumption that the DNA molecule central axis is a conic curve, ParaDock is able to predict with good accuracy the specific location, interface, and the specific shape of the DNA molecule, resulting in good ‘fraction of native contacts’ scores. The solutions, however, exhibit lower accuracy when it comes to RMSD measures. This is explicable due to the lack of refinement and the simplification of flexibility in the DNA molecule, combined with the unaddressed flexibility of the protein. A local refinement algorithm, which is outside of this work's scope, will be part of future efforts. Further required developments also include managing multiple protein molecules, thermodynamics-based scoring functions, and more complex central axis curves.
As expected, ParaDock presents better performance on bound versions of the proteins. Target complexes in Table 1 are sorted by their bound–unbound IRMS, representing the magnitude of the conformational changes undergone during binding and as can be foreseen, it is apparent that in the unbound version results deteriorate as native IRMS rises.
In a vast majority of the solutions, Fnat* + Fnonnat* > 1, implying that the molecular interface found in the solution complex is larger than the target interface. This is due to two possible reasons—first, as mentioned before, the definition of interface used here inflates the interface size as the volume of intermolecular overlap (steric clashes) grows. Second, because the length of the target DNA molecule is not used by the algorithm, the output DNA molecule may be longer than the target molecule, likely enlarging the calculated intermolecular interface (Figure 3c exhibits a solution quite longer than the target molecule). This is due to the nature of the geometric score, which is based on maximizing shape complementarity and is, thus, biased towards larger interfaces. However, examining the results, one can see that on the average sum of Fnat* and Fnonnat* is merely 1.2, which cannot be regarded as a significant drawback.
Arbitrary DNA sequence was used both as input for PatchDock, and as a template for the full molecular solution. Although such a choice might have interrupted severely with molecular complementarity, it seems not to have deteriorated results significantly (as they are rather good). Despite the fact that energy was very indirectly handled here, this might suggest that significant affinity can be achieved with arbitrary DNA sequences, thus supporting the ‘DNA sliding’ theory (24). The latter suggests that some DNA binding proteins, slide along the DNA, searching for their cognate sequence, continuously in contact with the DNA, thereby exhibiting significant affinity to any DNA sequence. Several different DNA segments were used with no significant impact on final success rates.
While ParaDock handles the Bonvin et al. benchmark quite well, it is important to pay attention to two inherent inabilities, in addition to the lack of refinement. The filtering stage denies the creation of irregular solutions, i.e. solutions in which the protein's interface does not sustain such properties of electrostatics and amino acid propensities earlier observed. Such target complexes, will not be predictable by ParaDock. On top of that, as the length of target DNA molecules will increase, the underlying approximation of the central axis with a planar conic curve will eventually fail. Such larger targets will demand a different treatment, perhaps by combining several ParaDock solution curves to create a more complex DNA molecule.
ParaDock is available online at BioInfo3D.cs.tau.ac.il.
FUNDING
Israel Science Foundation (grant no. 1403/09 in part); Hermann Minkowski Minerva Geometry Center. Funding for open access charge: Israel Science Foundation grant.
Conflict of interest statement. None declared.
ACKNOWLEDGEMENTS
We wish to thank Efi Fogel for his assistance with CGAL, and Dina Schneidman-Duhovny for her support with PatchDock adaptation.
REFERENCES
- 1.Ohlendorf DH, Matthew JB. Electrostatics and flexibility in protein–DNA interactions. Advan. Biophys. 1985;20:137–151. doi: 10.1016/0065-227x(85)90034-6. [DOI] [PubMed] [Google Scholar]
- 2.Nadassy K, Wodak SJ, Janin J. Structural features of protein−nucleic acid recognition sites. Biochemistry. 1999;38:1999–2017. doi: 10.1021/bi982362d. [DOI] [PubMed] [Google Scholar]
- 3.Mandel-Gutfreund Y, Margalit H, Jernigan RL, Zhurkin VB. A role for CH … O interactions in protein–DNA recognition. J. Mol. Biol. 1998;277:1140–1129. doi: 10.1006/jmbi.1998.1660. [DOI] [PubMed] [Google Scholar]
- 4.Wade RC, Gabdoulline RR, Lu'demann SK, Lounnas V. Electrostatic steering and ionic tethering in enzyme–ligand binding: Insights from simulations. Proc. Natl Acad. Sci. USA. 1998;95:5942–5949. doi: 10.1073/pnas.95.11.5942. [DOI] [PMC free article] [PubMed] [Google Scholar]
- 5.Luscombe MN, Laskowski RA, Thornton JM. Amino acid-base interactions: a three-dimensional analysis of protein-DNA interactions at an atomic level. Nucleic Acids Res. 2001;21:2860–2874. doi: 10.1093/nar/29.13.2860. [DOI] [PMC free article] [PubMed] [Google Scholar]
- 6.Jones S, Shanahan HP, Berman HM, Thornton JM. Using electrostatic potentials to predict DNA-binding sites on DNA-binding proteins. Nucleic Acids Res. 2003;31:7189–7198. doi: 10.1093/nar/gkg922. [DOI] [PMC free article] [PubMed] [Google Scholar]
- 7.Voet D, Voet JG. Biochemistry. 2nd edn. New York: John Willey and Sons, Inc.; 1995. pp. 850–861. [Google Scholar]
- 8.Van Dijk M, Bonvin AMJJ. A protein–DNA docking benchmark. Nucleic Acids Res. 2008;36:e88. doi: 10.1093/nar/gkn386. [DOI] [PMC free article] [PubMed] [Google Scholar]
- 9.Luscombe NM, Austin SE, Berman HM, Thornton JM. An overview of the structures of protein-DNA complexes. Genome Biol. 2000;1:e1. doi: 10.1186/gb-2000-1-1-reviews001. [DOI] [PMC free article] [PubMed] [Google Scholar]
- 10.Jones S, Van Heyningen P, Berman HM, Thornton JM. Protein-DNA interactions: a structural analysis. J. Mol. Biol. 1999;287:877–896. doi: 10.1006/jmbi.1999.2659. [DOI] [PubMed] [Google Scholar]
- 11.Stawiski EW, Gregoret LM, Mandel-Gutfreund Y. Annotating nucleic acid-binding function based on protein structure. J. Mol. Biol. 2003;326:1065–1079. doi: 10.1016/s0022-2836(03)00031-7. [DOI] [PubMed] [Google Scholar]
- 12.Ahmad S, Gromiha MM, Sarai A. Analysis and prediction of DNA-binding proteins and their binding residues based on composition, sequence and structural information. Bioinformatics. 2004;20:477–486. doi: 10.1093/bioinformatics/btg432. [DOI] [PubMed] [Google Scholar]
- 13.Ahmad S, Sarai A. PSSM-based prediction of DNA binding sites in proteins. BMC Bioinformatics. 2005;6:33. doi: 10.1186/1471-2105-6-33. [DOI] [PMC free article] [PubMed] [Google Scholar]
- 14.Wu J, Wu H, Liu H, Zhou H, Sun X. Support vector machine for prediction of DNA-binding domains in protein-DNA complexes. Life system modeling and simulation. Lect. Notes Comp. Sci. 2007;4689/2007:180–187. [Google Scholar]
- 15.Van Dijk M, Van Dijk ADJ, Hsu V, Boelens R, Bonvin AMJJ. Information-driven protein–DNA docking using HADDOCK: it is a matter of flexibility. Nucleic Acids Res. 2006;34:3317–3325. doi: 10.1093/nar/gkl412. [DOI] [PMC free article] [PubMed] [Google Scholar]
- 16.Van Dijk M, Bonvin AMJJ. Pushing the limits of what is achievable in protein–DNA docking: benchmarking HADDOCK's performance. Nucleic Acids Res. 2010;2010:1–14. doi: 10.1093/nar/gkq222. [DOI] [PMC free article] [PubMed] [Google Scholar]
- 17.Méndez R, Leplae R, De Maria L, Wodak SJ. Assessment of blind predictions of protein–protein interactions: current status of docking methods. Proteins Struct. Funct. Genet. 2003;52:51–67. doi: 10.1002/prot.10393. [DOI] [PubMed] [Google Scholar]
- 18.Dickerson RE. DNA bending: the prevalence of kinkiness and the virtues of normality. Nucleic Acids Res. 1998;26:1906–1926. doi: 10.1093/nar/26.8.1906. [DOI] [PMC free article] [PubMed] [Google Scholar]
- 19.Dickerson RE, Chiu TK. Helix bending as a factor in protein/DNA recognition. Biopolymers. 1997;44:361–403. doi: 10.1002/(SICI)1097-0282(1997)44:4<361::AID-BIP4>3.0.CO;2-X. [DOI] [PubMed] [Google Scholar]
- 20.Mandelkern M, Elias J, Eden D, Crothers D. The dimensions of DNA in solution. J. Mol. Biol. 1981;152:153–161. doi: 10.1016/0022-2836(81)90099-1. [DOI] [PubMed] [Google Scholar]
- 21.Duhovny D, Nussinov R, Wolfson HJ. Efficient unbound docking of rigid molecules. In: Guigo R, Gusfield D, editors. Proceedings of the Fourth International Workshop on Algorithms in Bioinformatics. GmbH Rome, Italy: Springer; 2002. September 17–21, 2002, Vol. 2452, pp. 185–200. [Google Scholar]
- 22.Wolfson HJ, Rigoutsos I. Geometric hashing: an overview. IEEE Comput. Sci. Eng. 1997;11:263–278. [Google Scholar]
- 23.Nussinov R, Wolfson HJ. Efficient detection of three - dimensional motifs in biological macromolecules by computer vision techniques. Proc. Natl Acad. Sci., USA. 1991;88:10495–10499. doi: 10.1073/pnas.88.23.10495. [DOI] [PMC free article] [PubMed] [Google Scholar]
- 24.Berg OG, Winter RB, Von Hippel PH. Diffusion-driven mechanisms of protein translocation on nucleic acids. 1. Models Theory Biochem. 1981;20:6929–6948. doi: 10.1021/bi00527a028. [DOI] [PubMed] [Google Scholar]