Abstract
Many genes have several, sometimes divergent functions during development. Therefore, timing of gene knockdown for functional analysis during development has to be done with precise temporal control, as loss of a gene's function at early stages prevents its analysis later in development. RNAi, in combination with the accessibility of chicken embryos, is an effective approach for temporally controlled analysis of gene function during neural development. Here, we describe novel plasmid vectors that contain cell type-specific promoters/enhancers to drive the expression of a fluorescent marker, followed directly by a miR30-RNAi transcript for gene silencing. These vectors allow for direct tracing of cells experiencing gene silencing by the bright fluorescence. The level of knockdown is sufficient to reproduce the expected pathfinding defects upon perturbation of genes with known axon guidance functions. Mixing different vectors prior to electroporation enables the simultaneous knockdown of multiple genes in independent regions of the spinal cord. This permits complex cellular and molecular interactions to be examined during development, in a fast and precise manner. The advancements of the in ovo RNAi technique that we describe will not only markedly enhance functional gene analysis in the chicken, but also could be adapted to other organisms in developmental studies.
INTRODUCTION
The function of a gene can only be understood in the context of the entire organism, as it is cell type specific and context dependent. The analysis of gene function is particularly demanding during development, as temporal control of gene expression adds additional complexity to the experimental approach. While functional gene analysis in vertebrates is most commonly performed by gain-of-function and loss-of-function experiments in the mouse, many genes involved in the development of the nervous system cannot be studied. Since many genes play additional roles in early developmental processes, classical gene knockouts may cause early embryonic lethality that precludes their analysis in later stages of development. In such circumstances, perturbation of gene function in a spatially and temporally defined manner is required. To some extent, this can be achieved by sophisticated gene knockout techniques (1). However, the high cost and the large amount of time required for the production of multiple transgenic mice is rate limiting in the quest to gain insight into the functional role of a gene of interest.
Because of its easy accessibility in the egg, the chicken embryo has been the model of choice for developmental in vivo studies. In recent years, our lab and others have used RNA interference (RNAi) and electroporation as a powerful method to perturb gene expression during development. In the chicken, spatiotemporal control of gene knockdown can be achieved by electroporation of long double-stranded RNA (dsRNA) (2–7), DNA plasmids encoding short hairpin RNAs (shRNAs) (8) or artificial microRNAs (miRNAs) (9). These approaches harness the naturally occurring miRNA biogenesis pathway, a post-transcriptional gene regulatory mechanism that activates the RNA-induced silencing complex to evoke gene silencing in response to dsRNA [reviewed in (10)]. We have previously used long dsRNA to identify new roles for multiple genes during neural development (2–7). Alternatively, Das and colleagues (9) described a plasmid in which a ubiquitously active chicken U6 promoter was used to drive the expression of an RNA transcript that mimicked the stem–loop and flanking structure of microRNA30, to ensure its successful processing by Drosha and Dicer. Following electroporation, the authors reported the silencing of various target genes in the chicken neural tube. However, the lack of cell type specificity of these current methods can be problematic since (i) targeting of distinct subpopulations of cells located in the same area is not possible using manual targeting techniques; (ii) it is difficult to downregulate different genes in independent subpopulations of cells; and (iii) identification of cells experiencing gene knockdown is often indirect (for example, by the co-electroporation of a fluorescent reporter). Here, we describe an improvement on current techniques to markedly enhance the precision and combinatorial possibilities of in ovo RNAi.
Several recent studies have reported successful gene knockdown by RNAi in a cell type-specific manner, either in vitro [for example (11–13)] or in adult mice using viral vectors or by crossing transgenic lines [for example, (11,14,15)]. In these studies, a cell type-specific RNA polymerase II promoter/enhancer is used to drive the transcription of shRNA. However, many of the approaches described to date do not allow the transfected cells to be directly identified within the target tissues. While this feature may not be necessary for in vitro studies or in therapeutic settings (in which the specific cells experiencing gene knockdown may not need to be identified in the context of the whole tissue or organ), it is crucial for developmental studies. Electroporation of the neural tube results in a transfection efficiency of ∼60% of the cells in the electroporated area (2). Therefore, accurate analysis of novel gene function in vivo is only possible when the genetically perturbed cells are identifiable in their environment.
Recent in vitro studies have reported that it is possible for miRNA targeting specific genes to be expressed simultaneously with protein-coding genes (16–18). Thus, we decided to directly couple an artificial miRNA to a fluorescent indicator that would enable the faithful identification of the transfected cells in vivo. We made plasmids driven by RNA polymerase II promoters/enhancers that are specifically active in different subpopulations of cells in the neural tube. These enhancers drive the expression of a single transcript encoding both a fluorescent protein and up to two different artificial miRNAs. The placement of hairpin RNAs within the context of an artificial miRNA has been shown to reduce shRNA-mediated toxicity in vivo (19,20). Electroporation of these constructs in the developing neural tube of chicken embryos allows for effective knockdown of target genes in different cell types that can be traced directly by the expression of fluorescent markers. In principle, any promoter/enhancer could be used, potentially making the technique widely applicable for in vivo studies of gene function during development.
MATERIALS AND METHODS
Plasmids
pRFPRNAiC
pRFPRNAiC (9) was obtained from ARK Genomics and used for many of the initial assessments of miRNA activity in the chicken spinal cord. Artificial miRNAs targeting firefly Luciferase and Shh were previously published (9,21). For each of our other genes of interest, we used the online GenScript siRNA Target Finder to generate at least three new miRNA target sequences (21–22 bp). Novel miRNAs were amplified by PCR using Pfu DNA polymerase and cloned into the first or second hairpin insertion sites in pRFPRNAiC, following the protocol provided with the vector. The target sites for the miRNAs used in subsequent experiments are shown in Table 1.
Table 1.
Target sequences and vector insertion sites for miRNAs used in this study
| Name | Gene | Target sequence | Vector insertion site |
|---|---|---|---|
| miShh (9) | Sonic hedgehog | ACAAGAAACTCCGAGAGATTTA | Second |
| miLuc (9) | Firefly luciferase | TGCTGCTGGTGCCAACCCTATT | First |
| mi2Luc (21) | Firefly luciferase | CGTGGATTACGTCGCCAGTCAA | First or Second |
| mi1AX1 | Axonin1 | AAGTACCACGTCTCAGTGAGA | First |
| mi2AX1 | Axonin1 | AAGTGACGCTGACGTGTCGAG | First |
| mi3AX1 | Axonin1 | AAGGCACTTATGAGTGCGAGG | First |
| mi4AX1 | Axonin1 | AAGGAGGCCACCAGGCAACATC | First |
| mi5AX1 | Axonin1 | AAGCAGATGCGCACCAATCCTG | First |
| mi6AX1 | Axonin1 | AACCTCTACATTGCCAAGACAG | First |
| miGPC1 | Glypican1 | AAGCCTGTATGGAGAATTGTAC | First |
| miWnt7a | Wnt7a | AAGCAGTTCAAGTCGAACCAGT | Second |
Backbone fluorescent constructs
Vector components were synthesized in a stepwise manner and inserted into a pBluescript SK+ backbone (pBSK+; Stratagene). An SV40 polyA sequence flanked by KpnI and XhoI sites was amplified from pIRES (Clontech) using the following primers: 5′-AACTCGAGGACATGATAAGATACATTGATG and 5′-AAGGTACCTCGGATTTTACCACATTTGTAG. The PCR product was digested and inserted into pBSK+, creating pA/pBSK+. EGFP was amplified from pIRES using primers that incorporated SpeI and EcoRI flanking sites and a β-globin basal promoter (22) upstream of a Kozak start site. The primers used were: 5′- AAACTAGTGGGCTGGGCATAAAAGTCAGGGCAGAGCCATCTATTGCTTACATTGCTTCTACCATGGTGAGCAAGGGCGAG and 5′-AAGAATTCTTACTTGTACAGCTCGTCCATGCC. The PCR product was cloned upstream of polyA in pA/pBSK+, creating EGFP-pA/pBSK+. Enhanced blue fluorescent protein 2 (EBFP2) (23) was excised from pBad-EBFP2 (Addgene plasmid 14891) using XhoI (blunted) and EcoRI, and cloned into the SmaI and EcoRI sites of pA/BSK+, creating EBFP2-pA/pBSK+. Humanized Renilla GFP (hrGFPII; Stratagene) was cloned into pA/pBSK+ on a BamHI/EcoRV fragment, creating hrGFPII-pA/pBSK+. To enable visualization of axon projections, we used a membrane-targeted (farnesylated) EGFP (EGFPf; Clontech). Where relevant, the miRNA cassette containing flanking regions and two miRNA insertion sites was excised from pRFPRNAiC using KpnI (blunted) and HindIII, and inserted into the EcoRV and HindIII sites of the fluorescent backbone vectors. These were then used in combination with cell type-specific enhancers/promoters (see below) to drive expression of fluorescent protein, with or without miRNA, in the chicken spinal cord.
Promoters/enhancers
A 1.6 kb chicken βactin promoter was excised from pMES (provided by C. Krull) using BamHI and SpeI. βactin-mRFP1 was excised from pRFPRNAiC using SalI and EcoRI. Constructs were electroporated at 0.2–0.5 µg/µl.
We obtained the Hoxa1enIII-TATA-Cre-IRESAP-pA construct from A. Klar. The 0.85 kb Hoxa-1 enhancer element III (containing retinoic acid response elements) and TATA box were excised using NotI and SpeI. Constructs were bilaterally electroporated at 0.5–1.0 µg/µl.
The 1.5 kb Math1 enhancer (24) (mouse Atonal homolog; Genbank accession AF218258) was provided in pMath1-Gal4/AD by S. Arber, and was subsequently cloned upstream of the β-globin basal promoter, the EGFPf-coding region and SV40 polyadenylation sequences (in EGFPf-pA/pBSK+). Constructs were electroporated unilaterally at 0.7 µg/µl.
In ovo electroporation
Fertilized eggs obtained from a local supplier were incubated at 38.5°C for 3 days prior to windowing. Embryos were staged according to Hamburger and Hamilton (25). Extra-embryonic membranes were carefully removed at HH17-18.5, and the central canal of the spinal cord was injected with a mix of plasmid DNA and Trypan blue to enable visualization of the injection solution. Unilateral transfection was achieved by electroporation (five pulses of 25 V, 50 ms duration) as described previously (2) using a BTX ECM830 square wave electroporator (Harvard Instruments). Bilateral electroporation was performed using five pulses of 18 V, 50 ms duration and then switching the polarity of the electrodes, repositioning and repeating the electroporation. Efficiency and accuracy of electroporation was assessed by the expression of the relevant fluorescent protein/s.
Immunohistochemistry
Staining of 25-µm-thick cryostat sections was carried out as described previously (26). Primary antibodies used in this study were as follows: mouse anti-Shh (5E1), mouse anti-myc (9E10), mouse anti-Nkx2.2 (74.5A5), mouse anti-Pax7, mouse anti-Islet1 (40.2D6), mouse anti-HNF3β (4C7), rabbit anti-Axonin1, goat anti-NgCAM, rabbit anti-cleaved caspase-3 (Asp175; Cell Signaling Technology) and goat anti-GFP-FITC (Rockland). All monoclonal antibodies were obtained from Developmental Studies Hybridoma Bank. Fluorophore-conjugated secondary antibodies were purchased from Jackson ImmunoResearch Laboratories (donkey anti-mouse IgG-Cy3, goat anti-mouse IgG-Cy3, donkey anti-rabbit IgG-Cy3 and goat anti-rabbit IgG-Alexa488) or Invitrogen (donkey anti-mouse IgG-Alexa488, donkey anti-goat IgG-Alexa488 and goat anti-mouse IgG-Alexa488).
Fluorescence intensity recordings
Electroporated embryos were processed in parallel and immunolabelled for Shh as described. Digital images of red and green fluorescent channels were captured using the same camera settings for all sections within the same experiment. Only those sections where the floor-plate region was successfully targeted (as evident by the expression of RFP or EGFP as appropriate) were used. We analyzed 7–12 sections per condition, taken from at least four different embryos. Fluorescent intensity was calculated using the Gray Value (Mean) function within Adobe Photoshop CS3 software. The area to be sampled was defined by drawing a triangle, starting at the midline just dorsal to the floor plate and extending out to the motor nerve exit points and along the ventral border of the spinal cord. A background recording for each image was taken from the region adjacent to the dorsal root entry zone, where Shh is not expressed. The background recording was subtracted, to give a final fluorescence intensity value for each section. The data were subjected to statistical analysis (see below).
Efficiency of bilateral in ovo electroporation
The efficiency of bilateral electroporation was assessed on the basis of expression of hrGFPII. Embryos were bilaterally electroporated with βactin-hrGFPII (0.25 µg/µl) at HH17-18 and sacrificed at HH26. The electroporated area of the spinal cord was removed and dissociated into a single-cell suspension, and the percentage of green cells was determined in a Neubauer chamber. The percentage of hrGFPII-expressing cells was calculated from an average of four embryos ± SEM.
Quantification of axon guidance phenotypes
Embryos were sacrificed at HH25-26 and the trajectory of commissural axons was analyzed in an open-book configuration (Figure 4F). In the embryos electroporated with Math1-EGFPf constructs, the pathfinding behavior of commissural axons was directly visualized by the expression of membrane-bound EGFP. The scoring of phenotypes was performed by analysis of the caudal part of each open book. The open books were classified as abnormal if a bundle of more than five green axons was present along the ipsilateral floor-plate border. At least six embryos were examined in each condition. Alternatively, Fast-DiI (5 mg/ml; Molecular Probes) was applied by focal injection of DiI into dorsal commissural neurons, as previously described (27). Labeled axons at the midline were documented by confocal microscopy (Leica SP2, or Olympus DSU coupled to BX61 microscope). Only DiI injections sites that were in the appropriate location in the dorsal-most part of the spinal cord, and within the region expressing fluorescent protein, were included in the analysis. As it was impossible to count axons at individual injection sites, the percentage of axons displaying abnormalities was estimated, and the injection site was classified as showing an ‘ipsilateral’ phenotype if >10% of the labeled axons made ipsilateral errors, a ‘floor-plate stalling’ phenotype if >50% of axons stalled within the floor plate, or a ‘no turning’ phenotype if >50% of axons failed to make a turning decision on the contralateral side of the floor plate. In a single abnormal DiI injection site, it was possible that more than one class of phenotypic error was observed (for example, both ‘ipsilateral’ errors and ‘floor-plate stalling’ errors). The total number of DiI sites in each condition was pooled and an overall percentage of each phenotype was calculated and subjected to statistical analysis (see below).
Figure 4.
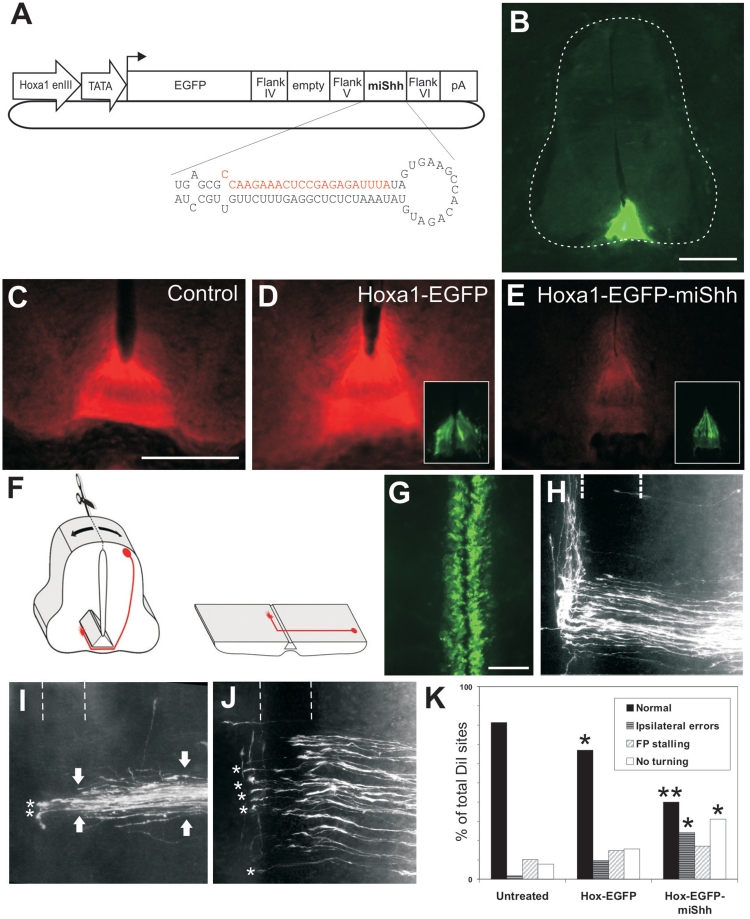
A floor-plate-specific miRNA construct driven by Hoxa-1 enhancer III effectively knocks down Shh in vivo. (A) Schematic of the construct. (B) Expression of EGFP in the floor plate after bilateral electroporation of Hoxa1-EGFP. (C–E) Expression of Shh in the floor plate of an untreated control embryo (C), and following bilateral electroporation with Hoxa1-EGFP (D) or Hoxa1-EGFP-miShh (E). Insets in D and E show EGFP expression in the floor plate. (F) Schematic [adapted from (6)] of the open-book preparation used to analyze commissural axon trajectories (red). (G) Top view of an open book from an embryo bilaterally electroporated with Hoxa1-EGFP-miShh showing EGFP expression in the floor plate along the longitudinal axis. (H) Visualization of commissural axons with DiI reveals that at HH26 the axons have crossed the floor plate (dashed lines) and extend rostrally along the contralateral floor-plate border in untreated (data not shown) and Hoxa1-EGFP embryos. (I and J) Phenotypes observed in embryos bilaterally electroporated with Hoxa1-EGFP-miShh. Many axons made ipsilateral pathfinding errors and were unable to reach the floor plate. Compare the thickness of the axon bundle distal and proximal to the floor plate (arrows in I). Those axons that did manage to cross the floor plate often lingered at the exit site and failed to extend rostrally (asterisks). Rostral is to the top in H–J. (K) Quantification of the effects obtained. *P < 0.05, **P < 0.001. Scale bar: 100 µm in B and C (applies also to D and E); 50 µm in G (applies also to H–J).
In situ hybridization
The specific downregulation of the target genes was verified by performing in situ hybridization using probes produced from chicken cDNAs that were previously generated in the lab, or ESTs obtained from Geneservice. The sequences used corresponded to a 1.5-kb fragment from the 5′-UTR and ORF of Axonin1 (Genbank accession NM_001004395), a 1.4-kb fragment of the 3′-UTR of Glypican1 (similar to ChEST 986o8; Genbank accession CR389412.1), 0.7-kb fragment of Glypican4 (ChEST 335n21), a 0.9-kb fragment of Wnt4 (ChEST 179l4) and a 0.7-kb fragment from the ORF and 3′-UTR of Wnt7a (ChEST 543m22; bp 491–1228 of Genbank accession NM_204292). In situ hybridization was carried out essentially as described (28), using digoxigenin-labeled in situ probes.
In vitro screening of candidate miRNAs
We used a multiple transfection protocol, modified from that of Yamamoto and colleagues (29), to maximize the number of cultured cells expressing each miRNA, and then assessed the ability of each miRNA to suppress the expression of its target gene. This approach approximated the production of a ‘stable cell line’ expressing each miRNA, allowing different miRNAs to be rapidly tested side by side. Since the cell machinery required for miRNA biogenesis is highly conserved in eukaryotes (10), we reasoned that COS-7 cells should provide a relevant readout of our chicken sequences. Confluent COS-7 cells were diluted 1:10 in DMEM (Gibco) with 10% fetal calf serum and plated into eight-well Labtek dishes (300 µl/well). Cells were grown at 37°C with 5% CO2 for 60 h before the first transfection. Lipofectamine reagent (0.6 µl/well in 25 µl of OptiMEM) was mixed with each pRFPRNAi vector (125 ng/well in 25 µl of OptiMEM), incubated for 30–45 min, and then added to the cells in 200 µl of DMEM + 10% FCS. Transfected cells were incubated for 6 h, and then transfected again. The following morning, the transfection process was repeated a third time, but this time we also co-transfected a ‘reporter’ pAX1-myc/his construct (50 ng/well), in which a CMV promoter drives the expression of myc/his-tagged chicken Axonin1. Cells were incubated for another 24 h before fixation in 4% PFA and immunolabeling for myc. Briefly, fixed cells were washed in PBS, treated for 20 min with 0.1% Triton-X in PBS, blocked in 2% BSA and incubated for 2 h with 9E10 antibody against myc. Cells were washed in PBS, and then incubated for 1 h with goat anti-mouse IgG, conjugated to Alexa488, before washing and mounting in Mowiol reagent.
We used the expression of RFP in each well to assess the relative transfection rates of the miRNA-expressing vectors and found that ∼70% of the cells in each well were transfected. We observed no differences in the transfection rates between different wells within the same experiment. The level of myc staining was used as an indicator of the efficiency of each miRNA to knockdown Axonin1, using the ‘empty vector’ condition (pRFPRNAi without a miRNA) as a reference. In addition to the six specific miRNAs targeted against Axonin1, we used a miRNA against Glypican1 (an unrelated gene) as a negative control. Myc staining in each well was visually scored as ‘no knockdown’, ‘weak knockdown’ or ‘strong knockdown’. miRNAs eliciting ‘weak’ or ‘strong’ knockdown were tested further in vivo. All experiments were batch processed in parallel to minimize variability between wells and repeated three times to confirm the results.
Statistical analysis
For the Shh immunofluorescence intensity recordings, we analyzed 7–12 sections, from at least four embryos per condition. The average fluorescence intensity of Shh was calculated for each condition and the data were subjected to ANOVA analysis and the Tukey's HSD test. Average percentage values provided in the text were normalized to the untreated control condition (100%), and are expressed ±SEM.
For analysis of axon guidance phenotypes observed in DiI injection sites, raw data were subjected to a one-tailed Fisher's exact test and chi-square test of association. At least 6 embryos and 50 DiI injection sites were analyzed for each condition.
We used the VassarStats Website for Statistical Computation (Vassar College; ©Richard Lowry 1998–2011; http://faculty.vassar.edu/lowry/VassarStats.html).
RESULTS
RNA polymerase II promoters can drive effective, traceable gene knockdown in vivo
In chicken, previous studies have introduced synthetic shRNAs via plasmids driven ubiquitously by RNA polymerase III (9,30,31). While the effective gene silencing reported in these studies is encouraging, the use of RNAi vectors described to date do not allow for directly identifiable, cell type-specific expression of shRNAs. Thus, we tested whether an RNA pol II promoter could be used to drive the effective expression of a single transcript encoding both a fluorescent protein (to directly mark transfected cells) and artificial miRNA (Figure 1A).
Figure 1.
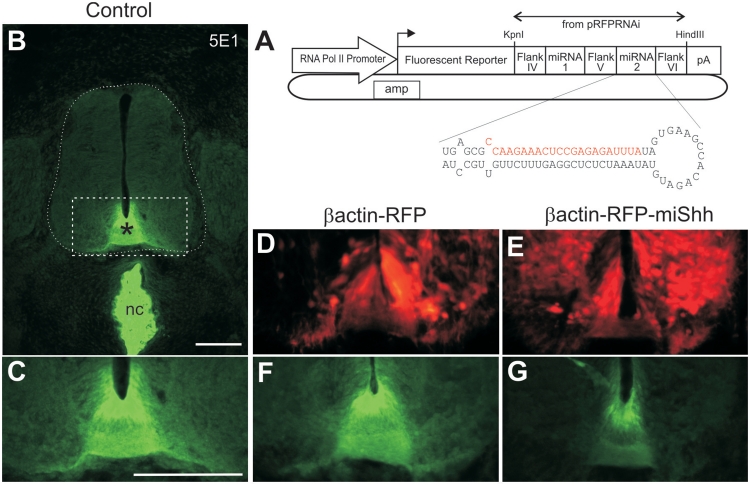
RNA polymerase II-driven plasmids can be used to express a single transcript encoding both a fluorescent protein and an effective artificial miRNA in chicken embryos. (A) Schematic of the plasmid constructs used in this study. The stem–loop structure of the miRNA30-like cassette is shown for an artificial miRNA against Shh (miShh). The target (sense) sequence of Shh is indicated in red. (B) Immunolabeling of cryosections of untreated chicken spinal cords at HH26 with the 5E1 antibody shows normal distribution of Shh in the notochord (nc), floor plate (asterisks) and adjacent ventral spinal cord. The boxed area is shown in higher power in (C), and equivalent regions are shown in (D–G). (D and F) RFP-positive cells in the floor plate and ventral spinal cord of embryos bilaterally electroporated with the control βactin-RFP construct (D) or βactin-RFP-miShh (E). The corresponding images showing Shh expression in each condition are shown in (F) and (G) (compare to C). Scale bar: 100 µm.
We first tested this idea using a ubiquitously active (RNA pol II-driven) βactin promoter, and a previously published miRNA against Sonic Hedgehog (9) (miShh; Figure 1A). The miShh and flanking regions were placed within the context of a miRNA30-based sequence (9) and cloned within the 3′-UTR of red fluorescent protein (RFP). Shh is a secreted protein that is produced and released by floor-plate cells, thus forming a gradient in the ventral spinal cord (Figure 1B and C). When a control βactin-RFP plasmid was injected into the central canal of Hamburger–Hamilton (HH) stage 18 chicken embryos followed by bilateral electroporation, we saw no significant change in the average intensity of Shh immunofluorescence at HH26 compared to untreated embryos (Figure 1E; higher by 7 ± 10.8% SEM). However, when βactin-RFP-miShh was electroporated, we saw a 42 ± 12.5 % reduction in Shh (Figure 1G; P = 0.0015). Electroporation with either the βactin-RFP or βactin-RFP-miShh plasmid produced strong red fluorescence making it easy to identify transfected cells in the spinal cord (Figure 1D and F). We calculated that the transfection efficiency of our bilateral electroporations is 51.8% ± 1.3%. Therefore, an average knockdown of 42% at the protein level represents ∼80% of the theoretical maximum that could be achieved. Since any Shh expressed prior to electroporation would be unaffected, the results suggest that our miRNA approach very effectively downregulates Shh in the targeted cells.
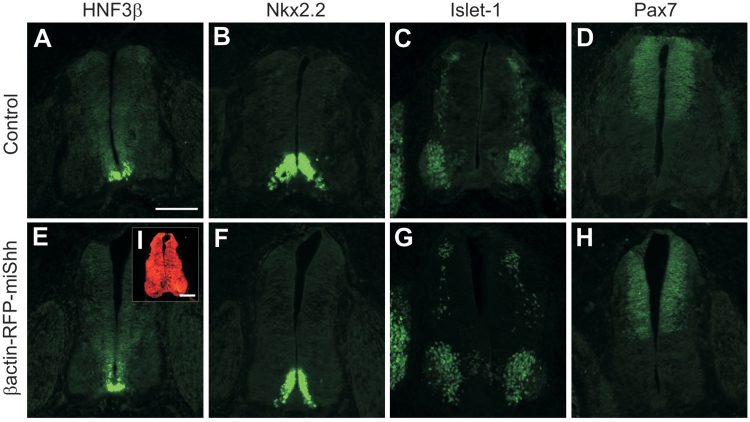
To test whether the knockdown of Shh was due to the specific activity of the miRNA rather than global gene downregulation, we immunolabeled sections with antibodies against an array of spinal cord markers, including HNF3β, Nkx2.2, Islet1 and Pax 7 (32,33). Although Shh is a morphogen that specifies cellular differentiation during early neural tube development, perturbation of Shh signaling after HH18 no longer affects spinal-cord patterning (3). Indeed, we found that the expression patterns and staining intensities of the markers that we used were indistinguishable between the different groups (Figure 2). Our results showed that the forced, widespread expression of miShh after HH18 did not cause gross developmental abnormalities, and that miShh downregulates its target gene specifically.
Figure 2.
Widespread misexpression of miRNA construct does not affect spinal cord patterning. The normal distributions of (A) HNF3β in the floor plate, (B) Nkx2.2 in p3 precursor cells, (C) Islet-1 in motor neurons and dI3 dorsal interneurons and (D) Pax7 in precursors of dI1-6 interneurons are shown in cross-sections of spinal cords from untreated control embryos at HH26. There was no change in the expression of these markers in embryos that were bilaterally electroporated with βactin-RFP-miShh at HH18 (E–H, respectively). The widespread expression of the RFP-miShh transcript was verified by strong expression of RFP throughout the neural tube (I). Scale bar: 100 µm.
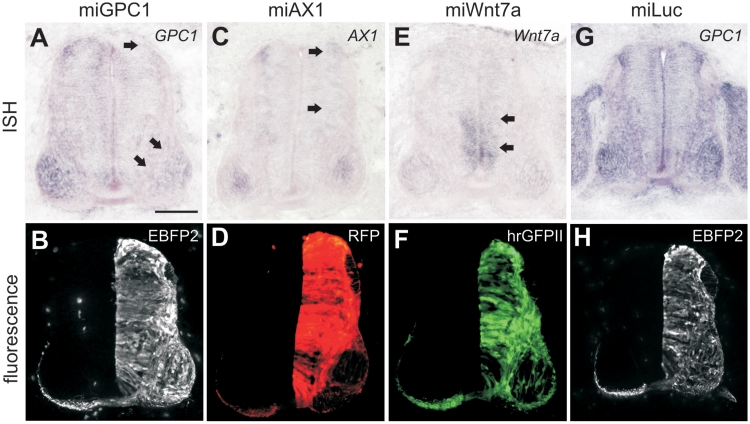
We further assessed the versatility of our plasmid design by expressing different fluorescent proteins [EBFP2, hrGFPII and EGFP (data not shown)] and novel miRNAs against a variety of endogenous target genes (Figure 3). In each case, the plasmids expressed strong fluorescence and elicited knockdown of their targets. The expression of a miRNA against firefly luciferase (9) had no effect on the levels of the endogenous genes that we tested (Figure 3G and H), indicating that our harnessing of the cellular miRNA processing pathway did not in itself elicit broad physiological toxicity. In support of this, immunolabeling for activated caspase-3 showed no differences in cell death between control and miRNA-treated tissues (data not shown). Thus, our plasmids elicit traceable, effective gene knockdown in vivo.
Figure 3.
Constructs drive the expression of various fluorescent proteins and efficiently knock down endogenous target genes. We tested miRNAs against Glypican1 (miGPC1), Axonin1 (miAX1) and Wnt7a (miWnt7a). Chicken embryos were unilaterally electroporated at HH18 with βactin-EBFP2-miGPC1 (A and B), βactin-RFP-miAX1 (C and D), βactin-hrGFPII-miWnt7a (E and F) or βactin-EBFP2-miLuc and examined for target gene expression at HH25-26. In each case strong fluorescence was detectable on the electroporated side (B, D, F and H). ISH showed downregulation of the appropriate target gene on the electroporated side of the neural tube compared to the control side (arrows in A, C and E). Expression of miLuc did not affect the expression of any of the endogenous genes that we tested (G; GPC1 shown as an example). Scale bar: 100 µm.
Cell type-specific, traceable gene knockdown in the floor plate
We next tested whether a cell type-specific RNA Pol II promoter/enhancer could be used to drive traceable gene knockdown. We used the floor-plate-specific Hoxa-1 enhancer element III (34) to drive the expression of EGFP ± miShh (Figure 4A). Following bilateral electroporation, both Hoxa1-EGFP and Hoxa1-EGFP-miShh embryos displayed green fluorescence specifically in the floor plate (Figure 4B and insets). Relative to untreated embryos (Figure 4C), we found no significant change in the average Shh immunofluorescence intensity in the Hoxa1-EGFP group (Figure 4D; higher by 10 ± 5.6%), whereas the average Shh intensity was reduced by 40% ± 19.1% following Hoxa1-EGFP-miShh treatment (Figure 4E; P = 0.0006). Immunolabeling for other spinal cord markers showed no differences between the three groups (data not shown). Taken together, these results suggest that the Hoxa-1 enhancer III can drive both bright fluorescence and active miRNA to elicit traceable gene knockdown in the chicken floor plate.
In order to assess their effectiveness in developmental studies, we next asked whether this level of knockdown was sufficient to perturb biological function. After its function in neural tube patterning, Shh plays two roles during the guidance of spinal commissural axons: first, it collaborates with Netrin1 to attract axons toward the floor plate (35) and second, it repels post-crossing axons along the rostrocaudal axis (3). We examined the guidance of commissural axons using open-book preparations (Figure 4F and G) from embryos electroporated with Hoxa1-EGFP ± miShh. In untreated control embryos, 81.3% of all DiI injection sites (n = 166, from 17 embryos) displayed the normal phenotype in which commissural axons crossed the floor plate before turning sharply at the contralateral floor-plate border and extending rostrally (Figure 4H). This normal phenotype was also seen in the majority of DiI sites from Hoxa1-EGFP embryos (67.0%; n = 115, from 20 embryos). However, the normal phenotype was observed in only 39.7% of DiI sites from Hoxa1-EGFP-miShh embryos (n = 58, from 13 embryos; P = 0.0005 compared to Hoxa1-EGFP). The specific phenotypic abnormalities that we saw in the miShh group were consistent with the loss of Shh during commissural axon guidance: 24.1% of injection sites showed ipsilateral pathfinding errors (compared to 9.6% in Hoxa1-EGFP embryos; P = 0.0109; Figure 4I and K), and post-crossing axons failed to make a turning decision into the longitudinal axis in 31.1% of injection sites (compared to 15.7% in Hoxa1-EGFP controls, P = 0.0169; Figure 4I–K). In contrast to these results, the bilateral electroporation of Hoxa1-EGFP-miLuc did not cause axon pathfinding abnormalities compared to controls electroporated with Hoxa1-EGFP alone (65.9% normal phenotype; n = 141 DiI sites from 24 embryos; P = 0.4865), demonstrating that the phenotypes were not due to non-specific toxicity. Thus, the cell type specific, targeted knockdown that is elicited by the plasmids is sufficiently potent to perturb physiological gene function.
Commissural neuron-specific gene knockdown
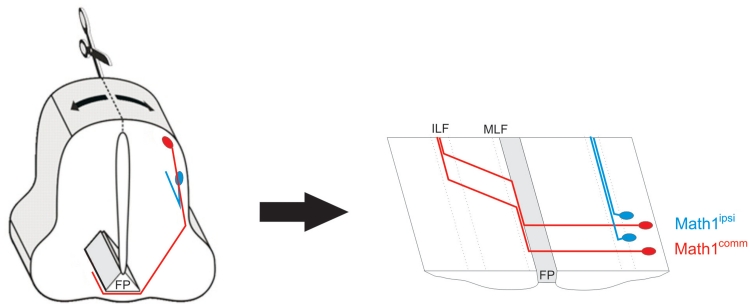
To establish the efficiency of the miRNA-expressing vectors on other gene targets and in other cell types, we used an enhancer of the Math1 (mouse Atonal homolog) gene to drive expression of a membrane-targeted EGFP, followed by a miRNA against Axonin1 (AX1; also known as TAG-1 and Contactin2). The 1.5 kb Math1 enhancer drives specific expression in the commissural dI1 interneurons of the spinal cord (24,36). The majority of Math1-labeled axons (∼85%; Math1comm) cross the floor plate (24) and project rostrally within the medial longitudinal fascicle (MLF), before being deflected diagonally and eventually re-converging within the intermediate longitudinal fascicle (ILF). Another later-born class of Math1-labeled neurons (∼15%; Math1ipsi) occupies a more ventral position. Their axons project ipsilaterally, turning rostrally in the intermediate spinal cord without contacting the floor plate (36,37) (Figure 5).
Figure 5.
An enhancer of the transcription factor Math-1 labels precursors of dI1 interneurons in the dorsal spinal cord. The vast majority of these neurons (Math1comm; red) extend axons that cross the floor plate (FP), the ventral midline of the spinal cord. Only a small subset of Math1-positive neurons, which are born later and are positioned more ventrally, extend ipsilateral projections (Math1ipsi; blue). MLF, medial longitudinal fascicle; ILF, intermediate longitudinal fascicle.
We have previously demonstrated that commissural axons require Axonin1/TAG-1 (AX1) for correct pathfinding (2,38). Axonally expressed AX1 interacts with midline-derived NrCAM to enable axons to enter the floor plate. When AX1 function is perturbed by dsRNA-induced downregulation or by the addition of function-blocking antibodies, >20% of commissural axons stall or turn at the ipsilateral floor-plate border (2,38). Thus, we used this well-characterized phenotype as an indicator of efficient downregulation of AX1 specifically in commissural axons using miRNAs driven by the Math1 enhancer.
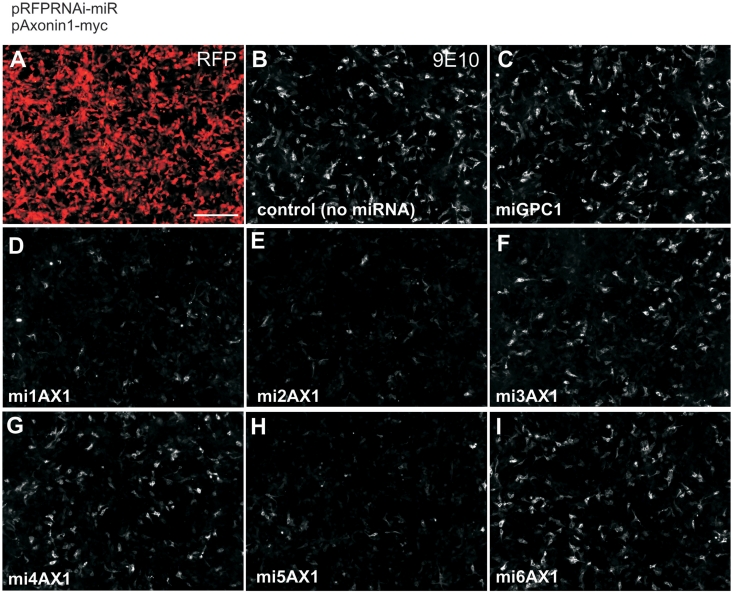
We first identified miRNAs that successfully targeted AX1. We designed six miRNAs (mi1AX1-mi6AX1) against the ORF of AX1, using an online algorithm. These were cloned into pRFPRNAi (9) and first screened in vitro to rapidly identify effective candidates (Figure 6). We used a multiple transfection protocol (29) to approximate a ‘stable cell line’ of cultured cells expressing each miRNA. Based on the expression of an RFP reporter, we estimated that 70% of cells were transfected and we saw similar transfection rates in all wells. Next, a myc-tagged AX1 construct was introduced. Cells were incubated for 24 h before immunolabeling for myc and comparing the expression levels to that observed in the control ‘empty’ pRFPRNAi condition. Of the six miRNAs that we tested, three showed strong suppression of AX1 (mi1AX1, mi2AX1 and mi5AX1), two showed weak knockdown (mi3AX1 and mi4AX1) and one was ineffective in vitro (mi6AX1). A miRNA against an unrelated gene (miGPC1) did not affect AX1 expression.
Figure 6.
An in vitro protocol rapidly tests the efficiency of multiple candidate miRNAs against Axonin1. COS-7 cells were repeatedly transfected with pRFPRNAi vectors expressing different miRNAs (as indicated). In each case, the expression of RFP showed that the majority of cells were transfected (A, representative image). Cells were then co-transfected with a construct driving the expression of myc-tagged Axonin1. Immunolabeling for myc 24 h later using the 9E10 antibody (B–I) revealed the ability of the different miRNAs to suppress Axonin1 expression relative to control conditions. The images are from one representative repeat of this experiment. Scale bar: 200 µm.
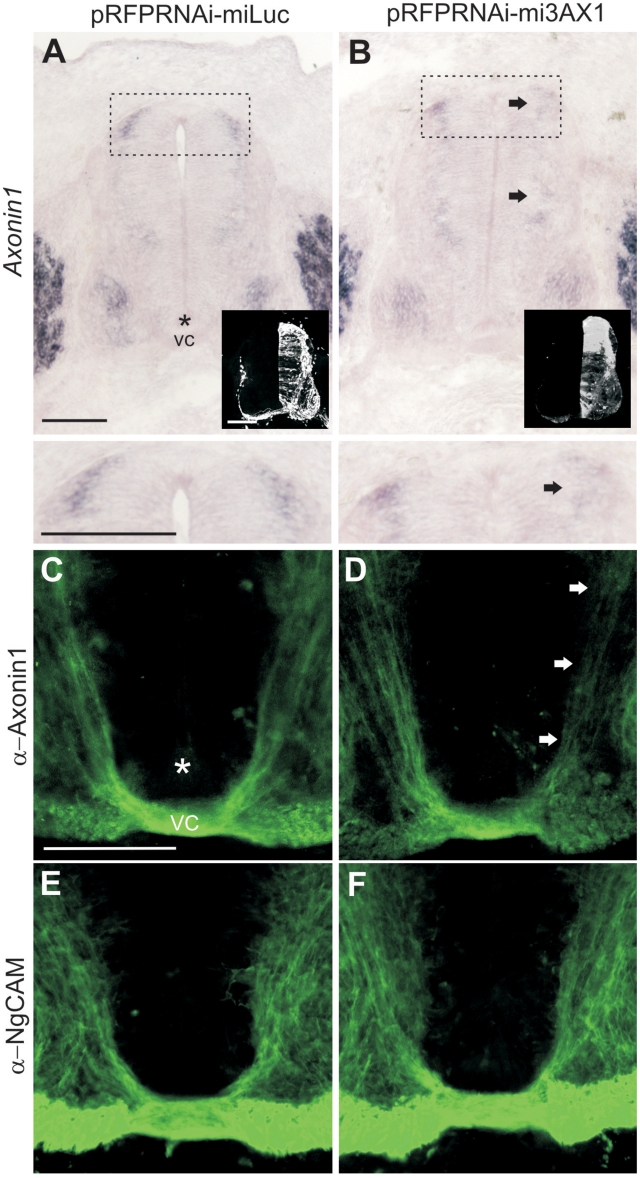
For in vivo testing, we unilaterally electroporated pRFPRNAi-AX1 vectors, or pRFPRNAi-miLuc as a control. By ISH (Figure 7A and B), we found that mi3AX1 elicited the most significant knockdown of AX1, while mi1AX1, mi2AX1 and mi4AX1 were moderately effective (data not shown). Surprisingly, mi5AX1, which strongly suppressed AX1 in vitro, appeared to be ineffective in vivo. The expression of miLuc had no impact on AX1 levels. Immunolabeling for AX1 yielded the same results (Figure 7C and D), suggesting that mi3AX1 was an effective miRNA to knockdown AX1 in vivo. The expression of NgCAM (another immunoglobulin superfamily protein expressed by commissural axons) was unaffected by either miLuc or mi3AX1, demonstrating the specificity of knockdown (Figure 7E and F).
Figure 7.
miRNAs against Axonin1 (AX1) effectively and specifically knockdown Axonin-1 in vivo. Embryos were electroporated at HH17-18 with pRFPRNAi vectors driving the expression of miLuc (A, C and E) or mi3AX1 (B, D and F) and processed at HH26 for Axonin1 in situ hybridization (A and B), Axonin1 immunolabeling (C and D) or NgCAM immunolabeling (E and F). The right half of the spinal cord was targeted by electroporation, as shown by RFP expression (insets). Axonin1 is expressed by dI1 commissural axons whose cell bodies reside in the dorsal spinal cord (A, boxed region and detail). Arrows show the reduction of Axonin1 levels on the electroporated side in the presence of mi3AX1 (compare to control side). The floor-plate (asterisks) and ventral commissure (VC) are indicated. Scale bar: 100 µm.
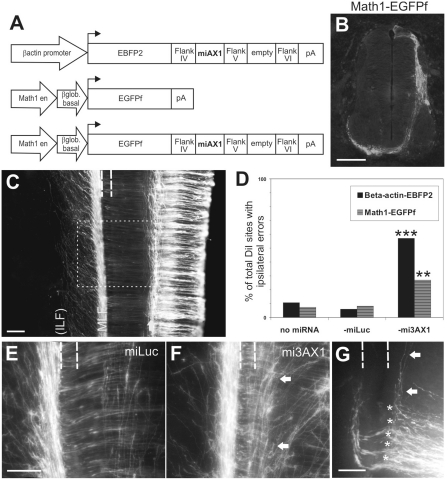
We next tested whether the knockdown of AX1 by mi3AX1 was adequate to elicit axon guidance effects in vivo, and further, whether the specific population of commissural axons labeled by the Math1 enhancer requires AX1 for floor-plate crossing (Figure 8). We cloned mi3AX1 or miLuc into the 3′-UTR of EBFP2, in a βactin-driven plasmid. This was co-electroporated with a plasmid containing the Math1 enhancer driving a membrane-bound EGFP (EGFPf), to genetically label dI1 axons (Figure 8A). In the control conditions in which Math1-EGFPf was co-electroporated with βactin-EBFP2 or with βactin-EBFP2-miLuc, the majority of embryos displayed Math1-labeled (green) axons that grew normally across the floor plate before turning longitudinally (6/7 and 12/13 embryos, respectively; data not shown). In contrast, we found that the co-electroporation of Math1-EGFPf with βactin-EBFP2-mi3AX1 caused many Math1-labeled axons to stall or turn before crossing the floor plate, creating a fascicle of green axons at the ipsilateral floor-plate border (6/6 embryos). The position of this aberrant longitudinal fascicle was distinct from (and in addition to) that of the Math1ipsi axons that normally extend within the intermediate spinal cord. The result phenocopied the axon guidance defects that we previously reported as a result of perturbations in AX1 activity (2,38). Assessment of individual DiI injection sites in open-book preparations showed ipsilateral errors in 56% of DiI sites (n = 99 from six embryos) in the βact-EBFP2-mi3AX1 group (Figure 8D), compared to 4% of the DiI sites (n = 51 from six embryos) in the βact-EBFP2 group or 7.5% of DiI sites (n = 53 from six embryos) in the βact-EBFP2-miLuc group (P < 0.0001). Taken together, the results show that mi3AX1 efficiently downregulates AX1 in vivo and confirm that a subpopulation of the Math1comm axons requires AX1 for correct guidance.
Figure 8.
A dI1-specific miRNA construct driven by the Math1 enhancer effectively knocks down Axonin1 in vivo. (A) Schematics of the constructs. (B) Specific expression of EGFPf in dI1 axons after unilateral electroporation of Math1-EGFPf. (C) Top view of an open book taken from a HH26 embryo electroporated with Math1-EGFPf showing the trajectories of dI1 axons. A subset of dI1 axons turns ipsilaterally in the intermediate spinal cord (arrow). The majority of axons grow across the floor plate (indicated by dashed lines) before turning rostrally along the contralateral floor-plate border and extending within the MLF. The axons are later deflected diagonally and then re-converge to form the ILF (by HH27-28). The boxed area indicates the equivalent regions shown in (E and F). (D) Quantification of the phenotypes observed by DiI injection. **P < 0.001, ***P < 0.0001. (E) Visualization of fluorescent dI1 axons in embryos electroporated with Math1-EGFPf-miLuc reveals that at HH26 the majority of axons have crossed the floor plate (dashed lines) and extend rostrally along the contralateral floor-plate border. (F) Embryos electroporated with Math1-EGFPf-mi3AX1 displayed aberrant navigation of dI1 axons. Many axons were unable to enter the floor plate, instead growing longitudinally along the ipsilateral floor-plate border (arrows). (G) Visualization of commissural axons with DiI following electroporation with Math1-EGFPf-mi3AX1 confirms that the axons make ipsilateral turning (arrows) and stalling (asterisks) errors. Compare the phenotype to Figure 4H. Rostral is to the top in C, E–G. Scale bar: 100 µm in B, C, E (applies to F); 50 µm in G.
We next tested whether the Math1 enhancer itself could drive sufficient expression of fluorescent protein and mi3AX1, specifically in the dI1 neurons, to recapitulate these guidance defects. We cloned mi3AX1 or miLuc into the 3′-UTR of Math1-EGFPf and electroporated these constructs (Figure 8A). In the control conditions electroporated with Math1-EGFPf alone or with Math1-EGFPf-miLuc, the majority of embryos [66.7% (n = nine embryos) and 69.2% (n = 13), respectively] displayed green fluorescent axons with the normal pathfinding phenotype (Figure 8C and E). In contrast, 68.2% of Math1-EGFPf-mi3AX1 embryos (n = 22) displayed green axons that turned aberrantly along the ipsilateral floor-plate border, as described above, thus recapitulating the expected axon guidance defects arising from perturbation of AX1 function (Figure 8F; P = 0.0455 compared to miLuc group).
Interestingly, we observed that the severity of the axon pathfinding defects in the Math1-EGFPf-mi3AX1 embryos was dependent on the age at electroporation: 87% of all moderate/severe phenotypes were observed in embryos electroporated at <HH17.5, while 67% of all normal phenotypes were found in embryos electroporated at >HH18. Within each embryo, we also found that the caudal segment of the open book was more severely affected than the rostral end, reflecting the decreasing ‘maturity’ of the nervous system in the rostral–caudal axis.
Analysis of individual DiI sites in open-book preparations (Figure 8D) revealed that ipsilateral stalling or turning errors (Figure 8G) were observed in <9% of DiI sites following electroporation with Math-EGFPf (n = 142 from 16 embryos) or Math1-EGFPf-miLuc (n = 61 from nine embryos). In contrast, 26.9% of DiI sites (n = 182 from 20 embryos) in the Math1-EGFPf-mi3AX1 group displayed ipsilateral errors (P = 0.0011 compared to the miLuc group). Of note here is that we inject DiI into the cell bodies of the Math1comm, but not the Math1ipsi, subpopulation of dI1 neurons (Figure 5). Additionally, we routinely label only commissural axons that project within the MLF, in contact with the contralateral floor-plate border, and not those that project in the ILF. Thus, our DiI injection sites label only a subpopulation of the Math1comm axons, which may explain the lower percentage of ipsilateral errors that we observed in the DiI analysis of Math1-EGFPf-mi3AX1 embryos compared to the βact-EBFP2-mi3AX1 group.
Dual activity of vectors in vivo
The plasmids contain insertion sites for two different miRNAs. Previous reports demonstrate that both miRNA insertion sites in the parent pRFPRNAi vectors are active against exogenous gene targets in vitro (9,39). In the single knockdown experiments described above, we used either the first miRNA insertion site (for mi3AX1) or the second (for miShh), demonstrating that, individually, both sites can yield miRNAs that are active against endogenous gene targets. To test whether the insertion sites are simultaneously active in vivo, we used a single construct encoding two miRNAs against different target genes (Figure 9). The miRNA cassette was located in the 3′-UTR of hrGFPII, in a βactin-driven construct.
Figure 9.
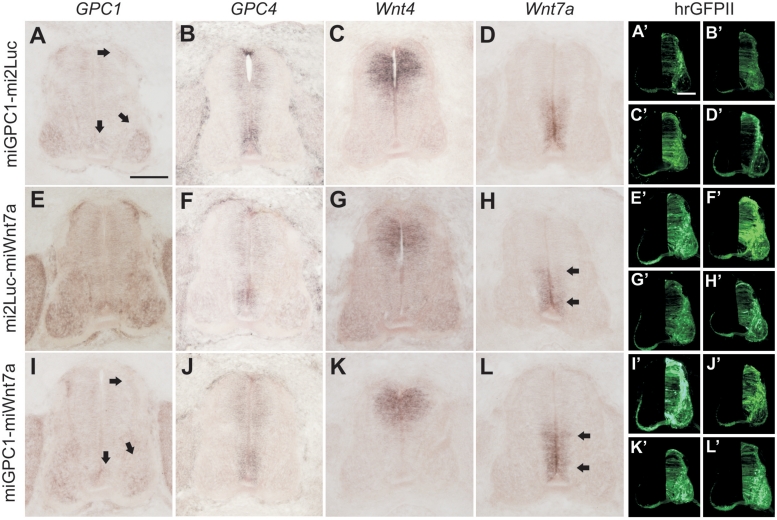
Dual silencing of endogenous target genes in the neural tube. Embryos were electroporated at HH17-18 with βactin-hrGFPII vectors driving the dual expression of miGPC1-miLuc (A–D), miLuc-miWnt7a (E–H) or miGPC1-miWnt7a (I–L) and processed at HH26 for in situ hybridization against GPC1, GPC4, Wnt4 and Wnt7a. The right half of the spinal cord was targeted by electroporation, as shown by the corresponding images of hrGFPII fluorescence (A′–L′). The appropriate target genes were downregulated (arrows; compare to non-electroporated side), without discernible off-target effects. Scale bar: 100 µm.
We arbitrarily chose target genes whose expression patterns partially overlapped in the developing neural tube. The first insertion site contained a miRNA against the heparan sulfate proteoglycan glypican1 (GPC1), while the second contained a miRNA against Wnt7a, yielding βactin-hrGFPII-miGPC1-miWnt7a. To control for saturation of the miRNA processing pathway, we made dual expression constructs containing a miRNA against luciferase (mi2Luc), rather than an endogenous gene target, in the first or second insertion sites (yielding βactin-hrGFPII-miGPC1-mi2Luc and βactin-hrGFPII-mi2Luc-miWnt7a). The constructs were electroporated, and the expression of GPC1, Wnt7a and two closely related members of the target gene families (GPC4 and Wnt4) was assessed 2 days later. In each case, we found that the appropriate target gene/s was/were knocked down without any discernible effect on the expression of non-targeted genes. The level of silencing for each gene was comparable to that produced by vectors encoding only a single miRNA (Figure 3). Thus, both miRNA insertion sites are simultaneously active in vivo and their concurrent activity can drive effective, specific downregulation of distinct target genes.
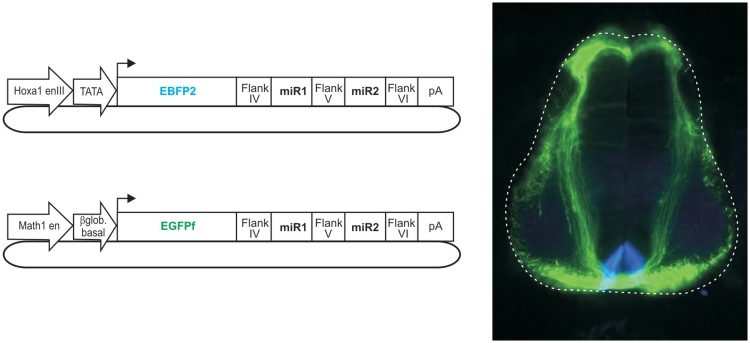
Mixing two plasmids before electroporation can additionally be used to knockdown genes in different cell types. Due to the expression of fluorescent markers from the plasmids encoding the different miRNAs, the cells experiencing knockdown of the specific target genes can easily be identified (Figure 10).
Figure 10.
Combinatorial use of vectors in vivo. Embryos were bilaterally co-electroporated at HH18 with a mixture of vectors, as indicated, and assessed at HH26. The combined electroporation of plasmids drove the distinct expression of fluorescent proteins and several different miRNAs in independent cell types: dI1 commissural neurons express a Math1-driven construct (green) and the floor-plate cells express a Hoxa1-driven construct (blue).
DISCUSSION
We have designed a simple, vector-based artificial miRNA expression strategy that can be used to knockdown endogenous gene expression in a cell type-specific, traceable manner in vivo. All constructs that we tested strongly express a fluorescent protein marker and can efficiently silence target gene expression in vivo. While RNA pol II-driven shRNAs have previously been shown to elicit cell type-specific knockdown (11,13,15), the current study is the first to demonstrate in vivo that an artificial miRNA directly coupled to a fluorescent protein marker performs effectively during development. These functional tools offer multiple gene silencing, temporal control and cell type specificity, to facilitate the elucidation of complex developmental pathways.
We tested three different RNA polymerase II promoters/enhancers to drive expression either ubiquitously (βactin promoter) or in a cell type-specific manner (Math1 enhancer, Hoxa-1 enhancer element III). The success of the cell type-specific approach offers a number of benefits over current techniques. First, enhancer-mediated control of gene knockdown provides an increased precision of cell type-specific targeting compared to manual techniques. Since the artificial miRNA is expressed only in the cell type of interest (and not in surrounding tissues), there is a decreased chance of abnormal phenotypes arising secondarily as a result of local morphological and/or cell fate changes. Second, the use of RNA pol II promoters, which are generally weaker than those driven by RNA pol III, decreases the chance of non-specific toxicity arising from saturation of the miRNA-processing pathway (11). Finally, the combined used of constructs driven by different promoters enables the simultaneous knockdown of different genes in independent regions of the neural tube from a single electroporation event, thus enhancing the combinatorial possibilities of in vivo RNAi (Figure 10). In the neural tube, several other enhancers/promoters have been shown to drive cell type-specific expression, for example, in motor neurons [HB9; (40)], primary sensory neurons [CREST3; (41)], subpopulations of dorsal interneurons (37) and other cell types (42). Thus, the plasmid design may facilitate many developmental studies of diverse subsets of neurons and their targets.
Several different fluorescent reporters were all strongly expressed and can be easily exchanged in each construct. This feature facilitates the concurrent use of two or more different constructs in vivo since their simultaneous activity in independent cell types can be identified with different fluorescent markers. This is of critical relevance to developmental studies examining highly intricate cellular and molecular pathways. The ability to simultaneously knockdown multiple different genes in independent cells types, combined with the ability to directly identify the cells experiencing knockdown of particular gene/s, offers a significant advantage over current techniques. The direct coupling of the fluorescent marker with the artificial miRNA within a single transcript also allows more accurate assessment of targeted cells, compared to commonly used designs where the miRNA and marker are encoded by different transcripts that are derived from independent plasmids or promoters. The ability to easily exchange the fluorescent protein that is expressed also enhances the flexibility of the plasmid application in conjunction with other fluorescent labeling methods (e.g. DiI labeling and fluorescent immunohistochemistry). Previous studies have shown that a miRNA precursor located in the 3′-UTR only moderately inhibits expression of a linked, protein-coding ORF (due to processing of the primary transcript by Drosha) (16,17). Consistent with these findings, we had no problems detecting fluorescence in any of our experiments.
A crucial factor in the use of miRNA-based plasmids as functional tools in developmental biology is the selection of effective, specific miRNAs (43). This process should incorporate the identification of several independent miRNAs to confirm an observed phenotype, negative controls (scrambled and/or unrelated miRNAs) and rescue constructs. To facilitate this process, we have described a quick in vitro protocol as a primary screening method of novel miRNAs. The multiple transfection of a given miRNA-expressing plasmid maximizes the number of cells expressing the miRNA, approximating a ‘stable cell line’ into which other plasmids (providing a readout of knockdown efficiency, off-target effects or cross-reactivity) can be co-transfected. We found that one of our miRNAs against AX1 was effective in vitro but not in vivo. While this finding was unexpected, it is consistent with another previous report (44) and underscores that in vitro efficacy does not necessarily apply in vivo. Still, our in vitro protocol provides a platform for further in vivo testing of novel miRNAs.
In our AX1 knockdown experiments, we observed decreasing phenotypic effects with increasing age at electroporation. Importantly, these effects are entirely consistent with the onset of AX1 expression [HH19 in the lumbar spinal cord (38)] and its long half-life [>100 h in DRG neurons (45)]. The findings support the idea that any AX1 protein that is expressed prior to the introduction of the miRNA is sufficient and persistent enough to allow correct axon pathfinding. They also illustrate an important consideration for the timing of application of the plasmids in vivo: following transfection, the transcription and processing of ‘active’ miRNAs capable of eliciting gene knockdown may take several hours.
Our results show that two endogenous genes can be targeted from a single vector. This provides a number of advantages for functional analyses in vivo; for example, by addressing redundancy in gene families, or enabling combinatorial gene knockdowns to identify genetic interactions. The simultaneous use of multiple cell type-specific vectors would enable many different genes to be knocked down in independent regions of the spinal cord, to investigate complex cellular and molecular interactions in a manner that is rapid, precise and inexpensive.
Finally, the possibility to fluorescently label a few genetically modified cells in a ‘wild-type’ environment will also provide a basis for time-lapse imaging of navigating axons or migrating cells in organotypic cultures. The combination of the novel tools with ex ovo RNAi (5) will allow for analysis of cell migration, axon guidance and synapse formation in the brain (in particular in the cerebellum) in a temporally controlled and cell type-specific manner. In contrast to such approaches in mice, where cell type-specific promoters driving Cre expression must be used, spatial and temporal control of gene silencing is facilitated in the chicken using these novel tools. Additionally, since our results suggest that, in principle, any RNA pol II promoter could be used, the applicability of the construct design may extend beyond that of the chicken neural tube.
FUNDING
The Swiss National Science Foundation (to E.S.). Funding for open access charge: Institute of Molecular Life Sciences, University of Zurich.
Conflict of interest statement. None declared.
ACKNOWLEDGEMENTS
We thank C. Krull for providing the chicken βactin promoter, A. Klar for providing the Hoxa1 enhancer III and TATA box elements and S. Arber for providing the Math1 enhancer. We are grateful to I. Andermatt for critical reading of the manuscript.
REFERENCES
- 1.Müller U. Ten years of gene targeting: targeted mouse mutants, from vector design to phenotype analysis. Mech. Dev. 1999;82:3–21. doi: 10.1016/s0925-4773(99)00021-0. [DOI] [PubMed] [Google Scholar]
- 2.Pekarik V, Bourikas D, Miglino N, Joset P, Preiswerk S, Stoeckli ET. Screening for gene function in chicken embryo using RNAi and electroporation. Nat. Biotechnol. 2003;21:93–96. doi: 10.1038/nbt770. [DOI] [PubMed] [Google Scholar]
- 3.Bourikas D, Pekarik V, Baeriswyl T, Grunditz A, Sadhu R, Nardó M, Stoeckli ET. Sonic hedgehog guides commissural axons along the longitudinal axis of the spinal cord. Nat. Neurosci. 2005;8:297–304. doi: 10.1038/nn1396. [DOI] [PubMed] [Google Scholar]
- 4.Mauti O, Domanitskaya E, Andermatt I, Sadhu R, Stoeckli ET. Semaphorin6A acts as a gate keeper between the central and the peripheral nervous system. Neural Dev. 2007;2:28. doi: 10.1186/1749-8104-2-28. [DOI] [PMC free article] [PubMed] [Google Scholar]
- 5.Baeriswyl T, Stoeckli ET. Axonin-1/TAG-1 is required for pathfinding of granule cell axons in the developing cerebellum. Neural Dev. 2008;3:7. doi: 10.1186/1749-8104-3-7. [DOI] [PMC free article] [PubMed] [Google Scholar]
- 6.Niederkofler V, Baeriswyl T, Ott R, Stoeckli ET. Nectin-like molecules/SynCAMs are required for post-crossing commissural axon guidance. Development. 2010;137:427–435. doi: 10.1242/dev.042515. [DOI] [PubMed] [Google Scholar]
- 7.Domanitskaya E, Wacker A, Mauti O, Baeriswyl T, Esteve P, Bovolenta P, Stoeckli ET. Sonic hedgehog guides post-crossing commissural axons both directly and indirectly by regulating Wnt activity. J. Neurosci. 2010;30:11167–11176. doi: 10.1523/JNEUROSCI.1488-10.2010. [DOI] [PMC free article] [PubMed] [Google Scholar]
- 8.Katahira T, Nakamura H. Gene silencing in chick embryos with a vector-based small interfering RNA system. Dev. Growth Differ. 2003;45:361–367. doi: 10.1046/j.1440-169x.2003.00705.x. [DOI] [PubMed] [Google Scholar]
- 9.Das RM, van Hateren NJ, Howell GR, Farrell ER, Bangs FK, Porteous VC, Manning EM, McGrew MJ, Ohyama K, Sacco MA, et al. A robust system for RNA interference in the chicken using a modified microRNA operon. Dev. Biol. 2006;294:554–563. doi: 10.1016/j.ydbio.2006.02.020. [DOI] [PubMed] [Google Scholar]
- 10.Kurreck J. RNA interference: from basic research to therapeutic applications. Angew. Chem. Int. Ed. Engl. 2009;48:1378–1398. doi: 10.1002/anie.200802092. [DOI] [PMC free article] [PubMed] [Google Scholar]
- 11.Giering JC, Grimm D, Storm TA, Kay MA. Expression of shRNA from a tissue-specific pol II promoter is an effective and safe RNAi therapeutic. Mol. Ther. 2008;16:1630–1636. doi: 10.1038/mt.2008.144. [DOI] [PubMed] [Google Scholar]
- 12.Xing Y, Liu M, Du Y, Qu F, Li Y, Zhang Q, Xiao Y, Zhao J, Zeng F, Xiao C. Tumor cell-specific blockade of CXCR4/SDF-1 interactions in prostate cancer cells by hTERT promoter induced CXCR4 knockdown: a possible metastasis preventing and minimizing approach. Cancer Biol. Ther. 2008;7:1839–1848. doi: 10.4161/cbt.7.11.6862. [DOI] [PubMed] [Google Scholar]
- 13.Zhao W, Xu Y, Kong D, Liu R, Zhang Z, Jin C, Zhang Z, Xiu Y. Tissue-selective RNA interference in prostate cancer cell using prostate specific membrane antigen promoter/enhancer. Urol. Oncol. 2009;27:539–547. doi: 10.1016/j.urolonc.2008.05.003. [DOI] [PubMed] [Google Scholar]
- 14.Gou D, Narasaraju T, Chintagari NR, Jin N, Wang P, Liu L. Gene silencing in alveolar type II cells using cell-specific promoter in vitro and in vivo. Nucleic Acids Res. 2004;32:e134. doi: 10.1093/nar/gnh129. [DOI] [PMC free article] [PubMed] [Google Scholar]
- 15.Rao MK, Wilkinson MF. Tissue-specific and cell type-specific RNA interference in vivo. Nat. Protoc. 2006;1:1494–1501. doi: 10.1038/nprot.2006.260. [DOI] [PubMed] [Google Scholar]
- 16.Cai X, Hagedorn CH, Cullen BR. Human microRNAs are processed from capped, polyadenylated transcripts that can also function as mRNAs. RNA. 2004;10:1957–1966. doi: 10.1261/rna.7135204. [DOI] [PMC free article] [PubMed] [Google Scholar]
- 17.Qiu L, Wang H, Xia X, Zhou H, Xu Z. A construct with fluorescent indicators for conditional expression of miRNA. BMC Biotechnol. 2008;8:77. doi: 10.1186/1472-6750-8-77. [DOI] [PMC free article] [PubMed] [Google Scholar]
- 18.Stegmeier F, Hu G, Rickles RJ, Hannon GJ, Elledge SJ. A lentiviral microRNA-based system for single-copy polymerase II-regulated RNA interference in mammalian cells. Proc. Natl Acad. Sci. USA. 2005;102:13212–13217. doi: 10.1073/pnas.0506306102. [DOI] [PMC free article] [PubMed] [Google Scholar]
- 19.McBride JL, Boudreau RL, Harper SQ, Staber PD, Monteys AM, Martins I, Gilmore BL, Burstein H, Peluso RW, Polisky B, et al. Artificial miRNAs mitigate shRNA-mediated toxicity in the brain: implications for the therapeutic development of RNAi. Proc. Natl Acad. Sci. USA. 2008;105:5868–5873. doi: 10.1073/pnas.0801775105. [DOI] [PMC free article] [PubMed] [Google Scholar]
- 20.Boudreau RL, Martins I, Davidson BL. Artificial microRNAs as siRNA shuttles: improved safety as compared to shRNAs in vitro and in vivo. Mol. Ther. 2009;17:169–175. doi: 10.1038/mt.2008.231. [DOI] [PMC free article] [PubMed] [Google Scholar]
- 21.Khvorova A, Reynolds A, Jayasena SD. Functional siRNAs and miRNAs exhibit strand bias. Cell. 2003;115:209–216. doi: 10.1016/s0092-8674(03)00801-8. [DOI] [PubMed] [Google Scholar]
- 22.Yee SP, Rigby PW. The regulation of myogenin gene expression during the embryonic development of the mouse. Genes Dev. 1993;7:1277–1289. doi: 10.1101/gad.7.7a.1277. [DOI] [PubMed] [Google Scholar]
- 23.Ai H-w, Shaner NC, Cheng Z, Tsien RY, Campbell RE. Exploration of new chromophore structures leads to the identification of improved blue fluorescent proteins. Biochemistry. 2007;46:5904–5910. doi: 10.1021/bi700199g. [DOI] [PubMed] [Google Scholar]
- 24.Helms AW, Abney AL, Ben-Arie N, Zoghbi HY, Johnson JE. Autoregulation and multiple enhancers control Math1 expression in the developing nervous system. Development. 2000;127:1185–1196. doi: 10.1242/dev.127.6.1185. [DOI] [PubMed] [Google Scholar]
- 25.Hamburger V, Hamilton HL. A series of normal stages in the development of the chick embryo. J. Morph. 1951;88:49–92. [PubMed] [Google Scholar]
- 26.Perrin FE, Rathjen FG, Stoeckli ET. Distinct subpopulations of sensory afferents require F11 or axonin-1 for growth to their target layers within the spinal cord of the chick. Neuron. 2001;30:707–723. doi: 10.1016/s0896-6273(01)00315-4. [DOI] [PubMed] [Google Scholar]
- 27.Perrin FE, Stoeckli ET. Use of lipophilic dyes in studies of axonal pathfinding in vivo. Microsc. Res. Tech. 2000;48:25–31. doi: 10.1002/(SICI)1097-0029(20000101)48:1<25::AID-JEMT4>3.0.CO;2-F. [DOI] [PubMed] [Google Scholar]
- 28.Mauti O, Sadhu R, Gemayel J, Gesemann M, Stoeckli ET. Expression patterns of plexins and neuropilins are consistent with cooperative and separate functions during neural development. BMC Dev. Biol. 2006;6:32. doi: 10.1186/1471-213X-6-32. [DOI] [PMC free article] [PubMed] [Google Scholar]
- 29.Yamamoto M, Okumura S, Schwencke C, Sadoshima J, Ishikawa Y. High efficiency gene transfer by multiple transfection protocol. Histochem. J. 1999;31:241–243. doi: 10.1023/a:1003598614323. [DOI] [PubMed] [Google Scholar]
- 30.Chesnutt C, Niswander L. Plasmid-based short-hairpin RNA interference in the chicken embryo. Genesis. 2004;39:73–78. doi: 10.1002/gene.20028. [DOI] [PubMed] [Google Scholar]
- 31.Dai F, Yusuf F, Farjah GH, Brand-Saberi B. RNAi-induced targeted silencing of developmental control genes during chicken embryogenesis. Dev. Biol. 2005;285:80–90. doi: 10.1016/j.ydbio.2005.06.005. [DOI] [PubMed] [Google Scholar]
- 32.Helms AW, Johnson JE. Specification of dorsal spinal cord interneurons. Curr. Opin. Neurobiol. 2003;13:42–49. doi: 10.1016/s0959-4388(03)00010-2. [DOI] [PubMed] [Google Scholar]
- 33.Lewis KE. How do genes regulate simple behaviours? Understanding how different neurons in the vertebrate spinal cord are genetically specified. Philos. Trans. R. Soc. Lond., B, Biol. Sci. 2006;361:45–66. doi: 10.1098/rstb.2005.1778. [DOI] [PMC free article] [PubMed] [Google Scholar]
- 34.Li X, Lufkin T. Cre recombinase expression in the floorplate, notochord and gut epithelium in transgenic embryos driven by the Hoxa-1 enhancer III. Genesis. 2000;26:121–122. [PubMed] [Google Scholar]
- 35.Charron F, Stein E, Jeong J, McMahon AP, Tessier-Lavigne M. The morphogen sonic hedgehog is an axonal chemoattractant that collaborates with netrin-1 in midline axon guidance. Cell. 2003;113:11–23. doi: 10.1016/s0092-8674(03)00199-5. [DOI] [PubMed] [Google Scholar]
- 36.Phan KD, Hazen VM, Frendo M, Jia Z, Butler SJ. The bone morphogenetic protein roof plate chemorepellent regulates the rate of commissural axonal growth. J. Neurosci. 2010;30:15430–15440. doi: 10.1523/JNEUROSCI.4117-10.2010. [DOI] [PMC free article] [PubMed] [Google Scholar]
- 37.Avraham O, Hadas Y, Vald L, Zisman S, Schejter A, Visel A, Klar A. Transcriptional control of axonal guidance and sorting in dorsal interneurons by the Lim-HD proteins Lhx9 and Lhx1. Neural Dev. 2009;4:21. doi: 10.1186/1749-8104-4-21. [DOI] [PMC free article] [PubMed] [Google Scholar]
- 38.Stoeckli ET, Landmesser LT. Axonin-1, Nr-CAM, and Ng-CAM play different roles in the in vivo guidance of chick commissural neurons. Neuron. 1995;14:1165–1179. doi: 10.1016/0896-6273(95)90264-3. [DOI] [PubMed] [Google Scholar]
- 39.Lambeth LS, van Hateren NJ, Wilson SA, Nair V. A direct comparison of strategies for combinatorial RNA interference. BMC Mol. Biol. 2010;11:77. doi: 10.1186/1471-2199-11-77. [DOI] [PMC free article] [PubMed] [Google Scholar]
- 40.Lee S-K, Jurata LW, Funahashi J, Ruiz EC, Pfaff SL. Analysis of embryonic motoneuron gene regulation: derepression of general activators function in concert with enhancer factors. Development. 2004;131:3295–3306. doi: 10.1242/dev.01179. [DOI] [PubMed] [Google Scholar]
- 41.Uemura O, Okada Y, Ando H, Guedj M, Higashijima S-I, Shimazaki T, Chino N, Okano H, Okamoto H. Comparative functional genomics revealed conservation and diversification of three enhancers of the isl1 gene for motor and sensory neuron-specific expression. Dev. Biol. 2005;278:587–606. doi: 10.1016/j.ydbio.2004.11.031. [DOI] [PubMed] [Google Scholar]
- 42.Timmer J, Johnson J, Niswander L. The use of in ovo electroporation for the rapid analysis of neural-specific murine enhancers. Genesis. 2001;29:123–132. doi: 10.1002/gene.1015. [DOI] [PubMed] [Google Scholar]
- 43.Cullen BR. Enhancing and confirming the specificity of RNAi experiments. Nat. Methods. 2006;3:677–681. doi: 10.1038/nmeth913. [DOI] [PubMed] [Google Scholar]
- 44.Ehlert EM, Eggers R, Niclou SP, Verhaagen J. Cellular toxicity following application of adeno-associated viral vector-mediated RNA interference in the nervous system. BMC Neurosci. 2010;11:20. doi: 10.1186/1471-2202-11-20. [DOI] [PMC free article] [PubMed] [Google Scholar]
- 45.Ruegg MA, Stoeckli ET, Lanz RB, Streit P, Sonderegger P. A homologue of the axonally secreted protein axonin-1 is an integral membrane protein of nerve fiber tracts involved in neurite fasciculation. J. Cell Biol. 1989;109:2363–2378. doi: 10.1083/jcb.109.5.2363. [DOI] [PMC free article] [PubMed] [Google Scholar]


