

Abstract
We present a compact and flexible endoscope (3-mm outer diameter, 4-cm rigid length) that utilizes a miniaturized resonant/nonresonant fiber raster scanner and a multielement gradient-index lens assembly for two-photon excited intrinsic fluorescence and second-harmonic generation imaging of biological tissues. The miniaturized raster scanner is fabricated by mounting a commercial double-clad optical fiber (DCF) onto two piezo bimorphs that are aligned such that their bending axes are perpendicular to each other. Fast lateral scanning of the laser illumination at 4.1 frames/s (512 lines per frame) is achieved by simultaneously driving the DCF cantilever at its resonant frequency in one dimension and nonresonantly in the orthogonal axis. The implementation of a DCF into the scanner enables simultaneous delivery of the femtosecond pulsed 800-nm excitation source and epi-collection of the signal. Our device is able to achieve a field-of-view (FOVxy) of 110 μm by 110 μm with a highly uniform pixel dwell time. The lateral and axial resolutions for two-photon imaging are 0.8 and 10 μm, respectively. The endoscope’s imaging capabilities were demonstrated by imaging ex vivo mouse tissue through the collection of intrinsic fluorescence and second-harmonic signal without the need for staining. The results presented here indicate that our device can be applied in the future to perform minimally invasive in vivo optical biopsies for medical diagnostics.
Keywords: nonlinear optical endoscopy, real-time optical diagnosis, scanning fiber endoscopy, microendoscopy, endogenous fluorescence
Multiphoton imaging techniques such as two-photon fluorescence (TPF) and second-harmonic generation (SHG) microscopy hold great promise for the future of medical diagnosis because of their potential to replace surgical biopsies with minimally invasive optical diagnosis of tissue health (1–7). In a clinical setting, these diagnostic techniques will be capable of acquiring real-time, high-resolution, in vivo images without the need for contrast agents. However, a challenge in translating these beneficial imaging technologies into the clinic lies in successfully miniaturizing bulky tabletop microscope components into a compact probe without degrading the overall imaging performance of the system. These microendoscopes would not only have the potential to be used as diagnostic tools capable of early cancer detection, but could also be used for such applications as photodynamic therapy and microsurgery (8, 9).
A number of groups have demonstrated miniaturized instruments capable of confocal, optical coherence tomography (OCT), TPF, and SHG imaging (10–25). The primary constituents of these devices are typically a miniaturized scanning mechanism and lens assembly that is encapsulated in a protective housing with dimensions suitable for minimally invasive procedures (i.e., a probe outer diameter on the order of a few millimeters with a rigid length of several centimeters). Within these microendoscopes, various distal miniaturized scanners have been demonstrated, including resonant-based [e.g., Lissajous (10, 11) or spiral (12–16) scan pattern] and non-resonant-based cantilever fiber scanners (16–19) as well as microelectromechanical systems (MEMS) scanning mirrors (20–25). Of these scanners, the resonant-based spiral scanners are the most successful in terms of their miniaturized dimensions (e.g., o.d. ≈ 1 mm) and fast image acquisition speeds [e.g., 8 frames/s with 512 × 512 pixels per frame, approximately 200-μm diameter field-of-view (FOVxy)] (14); however, these resonant devices are fundamentally limited by nonuniform spatial coverage and sampling time in comparison to current miniaturized raster scanners. Current miniaturized raster scanners are, however, limited in terms of their physical dimensions and/or scan speeds. Le Harzic et al. previously demonstrated a piezo-driven X-Y scanner (length = 34 mm, width = 1.9 mm) capable of a uniformly sampled FOVxy up to 420 μm by 420 μm, but this device is limited by its frame rate (i.e., 0.1 frames/s with 512 × 512 pixels per frame) (19). Slow image acquisition speeds are not ideal because of the motion artifacts typically faced in real-time in vivo clinical imaging environments. Additionally, although 2D MEMS scanning mirrors with miniature dimensions (e.g., 750 μm × 750 μm mirror size) have recently demonstrated fast line acquisition rates on the order of 1–3 kHz, the overall miniaturization of these MEMS scanners (i.e., their probe o.d.s) is limited by the die size of the actuator, which is typically 3 mm × 3 mm (24, 25).
Here, we present an endoscope that utilizes a miniaturized resonant/nonresonant cantilever fiber raster scanner design that is compact (width/thickness ≤ 1 mm, total length ≈ 2.6 cm), achieves ≥650 μm fiber-tip deflection for both the resonant and nonresonant axes, and allows for imaging at approximately 4.1 frames/s (512 × 512 pixels). The fiber scanner’s small dimensions enable it to be packaged along with a miniaturized high N.A. gradient-index (GRIN) assembly to form a compact and flexible TPF/SHG endoscope, with an outside diameter of 3 mm and a rigid length of 4 cm. The temporal pulse widths at different endoscope output powers were characterized as well as the imaging resolution of the device. Finally, we demonstrate that our multiphoton endoscope prototype is able to obtain ex vivo tissue images solely based on intrinsic fluorescence and SHG signal. These results show the potential for our endoscope prototype to be used as a real-time in vivo diagnostic tool for medical diagnostics.
Results and Discussion
Miniaturized Raster Scanner.
The miniaturized fiber raster scanner is driven by high-performance two-layer piezoelectric actuators or bimorphs (T215-A4CL, Piezo Systems, Inc.). These bimorphs are suitable for the fabrication of a miniaturized scanning mechanism because of their small dimensions (e.g., width = 0.5–1 mm, thickness = 380 μm) and ability to achieve deflection on the order of hundreds to thousands of microns. In our device, two bimorphs are aligned such that their bending axes are perpendicular to each other and serve as the resonant and nonresonant drivers for the lateral X-Y scanning. A commercial double-clad optical fiber (DCF SM-9/105/125-20A, NuFern) is mounted as a cantilever onto these axes and is driven resonantly in one dimension and nonresonantly in the other. The DCF has a core, inner cladding, and an outer cladding with diameters of 9, 105, and 125 μm, respectively. To determine the free hanging length of the DCF that would enable high speed resonant scanning on the order of 1 kHz, we used the following equation (26):
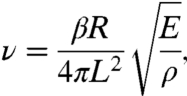 |
where E is the Young’s modulus (silica), ρ is the density (silica), R is fiber radius, L is the fiber overhang length, and β is a constant that is dependent upon the boundary conditions of the cantilever and the vibration mode number. In our calculation, we use the boundary condition of a fixed-free cantilever beam and the zeroth-order vibration mode (β ≈ 3.52). From this calculation, we chose a fiber overhang length of approximately 9 mm for our scanner, which has a measured resonant frequency of 1.05 kHz, in close agreement with the theoretical prediction of 1.1 kHz. A 3-mm length piezo bimorph was sufficient to provide a fiber-tip deflection range of over 1 mm at a peak-to-peak drive voltage (Vpp) of 50 V.
In order to achieve large nonresonant fiber-tip deflection, while minimizing the overall rigid length of the cantilever, we optimized the active length of the nonresonant piezo bimorph using the following equation:
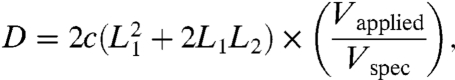 |
where D is the nonresonant fiber-tip deflection (μm), c is a proportionality constant, L1 is the free length of the nonresonant piezo bimorph, and L2 is the total length of the resonant piezo bimorph and the overhang length of the optical fiber (i.e., 12 mm). Using this calculation as a guide, we chose a nonresonant piezo length of 14 mm, which theoretically predicted deflection up to 763 μm at 200 Vpp. Our current scanner is able to achieve approximately 650 μm nonresonant fiber-tip deflection at 200 Vpp. The underperformance in the deflection is attributed to the small lateral dimensions of the scanner, which will slightly reduce the electric field strength in the piezo due to the edge effect. Although the application of relatively high voltage to the piezo bimorphs is necessary for high fiber-tip deflection (i.e., 200 Vpp to achieve nonresonant fiber-tip deflection up to 650 μm), we note that the electrical current within these bimorphs is small, with estimated currents of 30 and 1 μA for the resonant and nonresonant bimorphs, respectively.
It should be noted that in order to generate a purely linear fiber-tip motion in our resonant axis, we incorporated a small stiffening rod into the scanner to break the cylindrical symmetry of the optical fiber. Additionally, we note that our scanner has the ability to arbitrarily position the resonant axis line-scans in a direction orthogonal to the nonresonant axis by applying a dc offset voltage to the nonresonant bimorph. This may be of clinical use for measuring fast, dynamic physiological phenomena.
Three-Millimeter Outer Diameter Multiphoton Endoscope.
The prototype miniaturized raster scanner has a width/thickness ≤ 1 mm, a total length of approximately 2.6 cm, and is capable of fiber-tip deflection of 1.0 mm × 0.65 mm. The small width and thickness of the scanner allow it to be packaged, along with a commercial multielement GRIN lens assembly (GT-MO-080-018-810, GRINTECH), into a waterproof stainless steel housing with an outer diameter of 3 mm and a rigid length of 4 cm. The 0.8-N.A. GRIN assembly has a total length of 7.62 mm and is protected by a 1.4-mm o.d. stainless steel housing. The miniature size of the scanner and lens assembly enable the distal end of the endoscope to have dimensions that are well suited for a minimally invasive probe. Fig. 1A shows a mechanical assembly diagram of the distal end, and Fig. 1B shows a photograph of the external protective housing that encapsulates the miniaturized scanner and lens assembly. Within the protective housing, the double-clad fiber tip is centered laterally and separated approximately 200 μm axially from the 1-mm diameter back aperture of the GRIN assembly (Fig. 1C). For endoscopic imaging, a tabletop setup is used (Fig. 1D); see Materials and Methods for full setup details.
Fig. 1.

Three-millimeter o.d. raster scanning endoscope components and setup. (A) Mechanical assembly of the endoscope components. (B) Photograph of the prototype. (C) Optical path of the internal components of the distal end. (D) Tabletop endoscope imaging setup.
Pulse Characterization.
We precompensate the fiber dispersion by imposing an appropriate quadratic chirp on the input pulses with a rotating cylindrical lens and grating (27), which has the advantage of allowing continuous tuning of the second-order dispersion over a large range without perturbing the spatial alignment. Fig. 2A shows the second-order autocorrelation traces of the initial laser output as well as at 50-mW output from our endoscope. We are able to achieve a 290-fs pulse width at 50-mW output from the core of the DCF. The measured optical spectra are shown in Fig. 2B. The characteristic spectrum narrowing due to the optical nonlinearity and the normal dispersion of the fiber is clearly visible. Fig. 2C shows the measured pulse widths over a range of endoscope power outputs. These results are in close agreement with numerical simulations based on the nonlinear Schrodinger’s equation (28).
Fig. 2.

Pulse characterization. (A) Autocorrelation pulse-width measurements for the Ti:Sapphire output and for 50-mW endoscope output. The measured pulse widths are approximately 100 and 290 fs, respectively. (B) Spectra for the Ti:Sapphire output and for endoscope output at 50 mW. (C) Measured pulse widths of the endoscope output as a function of output power, assuming a deconvolution factor of 1.54 for a Sech2 pulse.
Optical Resolution.
The lateral and axial resolutions of our device are characterized by the transmission image of a high-resolution United States Air Force (USAF) test target and the axial response of the two-photon excited fluorescence signal from a 500-nm thin film of Rhodamine B (RhB) dye, respectively. Fig. 3A shows a transmission image of a high-resolution USAF test target, where the smallest line-width group (group 9) is displayed. The group 9 elements have line widths ranging from 977 nm (group 9, element 1) down to 775 nm (group 9, element 3) and are all discernible in this image. Fig. 3B shows an inverted line-intensity profile across the vertical lines in group 9, element 1. Given the line widths of 977 nm and the measured peak-to-trough ratio of 0.46, we determine a one-photon lateral resolution of approximately 1.1 μm full width at half maximum (FWHM), which corresponds to a two-photon lateral resolution of approximately 0.8 μm (FWHM). Fig. 3C shows the intensity profile produced as a result of stepping a 500-nm RhB thin film axially through the focal plane of the endoscope prototype. The FWHM of the intensity profile is approximately 10 μm. Using the magnification of the endoscopic lenses (M = 1/4.8) and the measured mode field diameter (MFD) of the DCF (MFD ≈ 9.1 μm at 800 nm), the theoretical two-photon lateral and axial resolutions are approximately 0.8 μm (FWHM) and 9.4 μm (FWHM of the thin film response), respectively. The demonstrated lateral and axial resolutions should be sufficient for resolving subcellular details in biological tissues.
Fig. 3.

Lateral and axial resolution. (A) Transmission image of high-resolution USAF test target. Group 9, elements 1–3 are displayed with line widths ranging from 977–775 nm. FOVxy = 10 μm × 30 μm. (B) Intensity line profile across the vertical bars of group 9, element 1. Using the intensity ratios between the peak and trough values, we determine a one-photon lateral resolution of approximately 1.1 μm (FWHM), which corresponds to a two-photon lateral resolution of approximately 0.8 μm (FWHM). (C) A two-photon axial resolution of approximately 10 μm (FWHM of the thin film response) is determined using a RhB thin film scan.
Scan Uniformity Characterization.
A raster scan pattern is superior to a spiral or Lissajous scan pattern because of the uniformity in its spatial scan pattern and pixel dwell time throughout the sample. In order to demonstrate the high uniformity in our raster scanner, Fig. 4A shows a transmission image of a 400 line-pair per mm (LP/mm) Ronchi ruling, without any image processing. The large deflection range in the resonant scan is evident by the appearance of the black regions on the horizontal edges of Fig. 4A, which indicate that the fiber tip is scanning well past the 1-mm back aperture of the GRIN lens. The visible FOVxy that is contained within the GRIN lens is approximately 208 μm × 110 μm. We measured the line widths horizontally across the Ronchi ruling as shown in Fig. 4B. Over a horizontal range of approximately 110 μm, there is a line-width deviation of approximately ± 7.5%. Thus, a uniform pixel dwell time over a reasonably large FOVxy (110 μm × 110 μm) can be achieved (dashed region within Fig. 4A).
Fig. 4.

Raster scan uniformity characterization. (A) Transmission image of a 400 LP/mm Ronchi ruling (line width = 1.25 μm). (B) Plot of the measured line widths of the Ronchi ruling as a function of the horizontal pixel number across the image. A horizontal range of approximately 110 μm corresponds to a line-width deviation of ± 7.5%. (C) Cropped and postprocessed Ronchi ruling image from Fig. 4A (FOVxy≈110 μm × 110 μm). The Ronchi ruling lines in C are corrected to be of uniform width across the image FOVxy. (D) Cropped and postprocessed transmission image of USAF test target group 6, elements 2–3 (line widths: 7.0 to 6.2 μm, FOVxy≈110 μm × 110 μm).
In the Ronchi ruling image (Fig. 4A), it is apparent that the 1.25-μm-width vertical lines do not appear to be perfectly straight throughout the entire image. This imperfection is attributed to a slight variation in our scanner's resonant deflection, which is dependent upon the nonresonant scan position. Although it leads to image distortions if uncorrected, such an imperfection has negligible impact on the sampling uniformity of the scanner. We observe that the variation in the resonant axis deflection is consistent, stable and repeatable between frames for given drive parameters (i.e., drive frequency and applied voltage to the piezos). The repeatability of the scan pattern enables us to develop an image remapping algorithm to correct the original unprocessed Ronchi ruling image (see Fig. 4C for the corrected Ronchi ruling image), which can then be applied to correct subsequently acquired images (e.g., Fig. 4D).
For comparison, the pixel dwell time of a typical spiral scanner is nonuniform with differences as high as 800 times between the center and periphery of the scan (14). It is impractical to compensate for such large scan nonuniformities with power modulation because of the following factors: (i) To achieve equivalent two-photon excitation between the center and periphery of the spiral scan, the power at the periphery must be much higher (> 10×) than that at the center; a single dispersion compensation setup cannot provide optimal compensation over such a large power variation because of the nonlinear pulse broadening effects within the optical fiber (see Fig. 2C). (ii) The high power levels required at the periphery of the spiral scan will add significant cost and complexity to the laser source, and may preclude the use of fiber-based laser sources, which are widely considered to be an ideal source for use in the clinical setting because of their robustness, small footprint, and low cost.
Ex Vivo Intrinsic Fluorescence Imaging.
An ideal optical diagnostic tool will acquire high-quality images with minimal frame averaging and without tissue staining or processing. The use of tissue staining, although common for ex vivo imaging (e.g., in the laboratory setting), is not ideal for many in vivo clinical imaging applications; therefore, we demonstrate the potential of our device to be used as an in vivo imaging instrument by acquiring intrinsic TPF/SHG signal from label-free ex vivo mouse tissue. Because of the raster scanner’s highly uniform pixel dwell time, minimal frame averaging was necessary in order to obtain high-quality images; see Materials and Methods for additional image acquisition details.
Fig. 5A shows unaveraged ex vivo images of SHG from collagen fibers taken from a mouse tail at three representative depths within the tissue; see Movie S1 for full depth scan. In these images, individual strands are discernible. Fig. 5B shows unaveraged intrinsic fluorescence images of ex vivo mouse lung at different depths where anatomical details such as the alveolar walls and lumens are visible; see Movie S2 for full depth scan. Fig. 5C shows five frame-averaged images at three different axial depths of the two-photon excited intrinsic fluorescence from ex vivo mouse colon tissue; see Movie S3 for full depth scan. Mouse colon tissue consists of closely packed tubular glands (crypts) covered by a layer of columnar absorptive cells and mucus secreting goblet cells. The cellular structures in Fig. 5C represent the intrinsic fluorescence emitted from these epithelial cells. The morphological details present in the unstained images displayed in Fig. 5 indicate that our prototype shows potential for future clinical use. No tissue damage was observed during the course of the ex vivo imaging session, and the imaging conditions were comparable to those shown by other investigators to have negligible tissue mutagenicity (29).
Fig. 5.

TPF/SHG images of ex vivo mouse tissue. (A) Unaveraged SHG images of mouse tail tendon at 10, 20, and 30 μm from the surface. (B) Unaveraged intrinsic fluorescence images of mouse lung at 50, 60, and 70 μm from the tissue surface. In B1, alveolar walls (w) and lumens (a) are clearly visible; in B2, a bronchiole (b) is distinguishable. (C) Five frames averaged intrinsic fluorescence images of mouse colon at 35, 45, and 55 μm from the surface. In C1, enterocytes (e) are visible; in C2, crypts (c) and goblet cells (g) are present. Scale bars, 10 μm. All images were acquired at 4.1 frames/second, 800-nm excitation, and the uniformly sampled FOVxy of approximately 110 μm × 110 μm is displayed. For the images in A, the power at the sample is approximately 30 mW; for the images in B and C, the power at the sample is 75 mW.
For comparison, we imaged two-photon excited intrinsic fluorescence from ex vivo mouse tissue using a commercial multiphoton microscope (Fluoview FV1000D, Olympus). Fig. 6 shows unstained images acquired from both systems at comparable depths within the tissue. This figure was obtained with comparable amounts of two-photon excited fluorescence at the sample per frame in each system. These images demonstrate that the multiphoton endoscope is capable of acquiring images of anatomical features that are similar in appearance to those obtained from a conventional multiphoton microscope.
Fig. 6.

Imaging comparison between the multiphoton endoscope and a commercial multiphoton microscope. (A) Unaveraged intrinsic fluorescence images of ex vivo mouse lung. A1 shows the image acquired from the multiphoton endoscope, and A2 shows the image acquired from the Olympus multiphoton microscope. (B) Five frames averaged intrinsic fluorescence images of ex vivo mouse colon. B1 shows the image acquired from the multiphoton endoscope, and B2 shows the image acquired from the Olympus multiphoton microscope. Scale bars, 10 μm. Comparable amounts of two-photon excited fluorescence at the sample per frame were maintained in each system. The displayed images were acquired with 800-nm excitation and a FOVxy of approximately 110 μm × 110 μm.
Conclusions and Outlook.
In summary, we have demonstrated a compact and flexible raster scanning microendoscope capable of acquiring TPF and SHG images at 4.1 frames/s with a FOVxy of 110 μm × 110 μm. The uniform pixel dwell time across this field of view enables our prototype to obtain ex vivo tissue images solely from intrinsic fluorescence and SHG signal with minimal frame averaging. Though further experimentation is necessary to confirm the probe’s effectiveness as a cancer diagnostic tool, the ability of our device to acquire subcellular resolution, label-free images at fast image acquisition rates shows great potential for translating our endoscope into a minimally invasive probe capable of real-time in vivo imaging in the clinical setting.
Materials and Methods
Endoscopic Imaging Setup.
In this setup (Fig. 1D), a mode-locked Ti:Sapphire laser (MaiTai, Newport) is used as the excitation source. The femtosecond excitation pulses at 800-nm wavelength are precompensated for fiber dispersion by using a rotating cylindrical lens and grating (28) prior to being coupled into the core of the 1-m-long double-clad optical fiber. The distal end of the DCF is mounted onto our resonant/nonresonant scanner, which sweeps the fiber tip in a raster pattern across the back aperture of the multielement GRIN lens assembly. The resonant axis is scanned at a frequency of 1.05 kHz, and the nonresonant axis is scanned at 4.1 frames/s, enabling fast 2D lateral scanning. The GRIN assembly functions as a 0.8-N.A. water immersion objective with a measured 135-μm working distance and provides a 4.8× demagnification (Fig. 1C), see SI Text for additional details of the GRIN assembly working distance characterization. For TPF and SHG imaging, the excited signal is epi-collected through the GRIN assembly to the core and inner cladding of the DCF. Signal transmitted through the DCF is then reflected by a 705-nm dichroic beam splitter (FF705-Di01-25 × 36, Semrock) and delivered to a two-channel detection system composed of two ultra bi-alkali (R7600U-200, Hamamatsu) photomultiplier tubes (PMTs). A 405-nm dichroic beam splitter (Di01-R405-25 × 36, Semrock) is positioned in the emission path at 45° between the two PMTs to separate the SHG and autofluorescence imaging channels. The ex vivo images were acquired by rigidly mounting the endoscope, mounting tissue samples on a microscope stage, and manipulating the stage position at 5 μm to acquire images at different axial depths within the tissue. Image acquisition is done with the multiphoton microscope software MPScan (30) and stored as MPView files. MPView files are then exported to Matlab and the public domain program Image J for data analysis and image processing.
Mouse Sample Processing.
Adult CD-1 mice were obtained from Charles River Laboratories (Charles River Laboratories International, Inc.) and euthanized by carbon dioxide asphyxiation. The organs of interest (a lung lobe and a segment of the colon) were dissected, visually inspected for abnormalities, and kept in chilled PBS until imaging. A normal-appearing deflated lung lobe was selected from a mouse and imaged at various depths, sampling the respiratory zone of the lung tissue (intact alveoli, see Fig. 5B). A short (approximately 0.5–1 cm) segment of the mouse colon was obtained and cut open to allow direct imaging of the inner (epithelial) lining of the colon (see Fig. 5C). In addition, collagen fibers were removed from a mouse tail (see Fig. 5A). Each imaging sample was embedded in agarose gel, plated on a standard glass microscope slide, kept immersed in PBS, and imaged within 1 h of euthanasia. All animal housing and experimentation was performed in accordance with the animal welfare guidelines of the Institutional Animal Care and Use Committee.
Supplementary Material
Acknowledgments.
We thank members of the Xu and Webb research groups for discussions and technical suggestions. We thank Dr. Douglas Scherr and Dr. Sushmita Mukherjee of Weill Cornell Medical College for valuable discussions and suggestions. We also thank Charlotte E. Egan, PhD, Research Associate, Cornell University, Department of Microbiology and Immunology for helping identify anatomical structures in the ex vivo tissue images. Our project was supported by National Institutes of Health/National Cancer Institute Grant R01-CA133148 and National Institutes of Health/National Institute of Biomedical Imaging and Bioengineering Grant R01-EB006736, “Development of Medical Multiphoton Microscopic Endoscopy.”
Footnotes
The authors declare no conflict of interest.
This article contains supporting information online at www.pnas.org/lookup/suppl/doi:10.1073/pnas.1114746108/-/DCSupplemental.
References
- 1.Zipfel WR, et al. Live tissue intrinsic emission microscopy using multiphoton-excited native fluorescence and second harmonic generation. Proc Natl Acad Sci USA. 2003;100:7075–7080. doi: 10.1073/pnas.0832308100. [DOI] [PMC free article] [PubMed] [Google Scholar]
- 2.Mukherjee S, et al. Human bladder cancer diagnosis using Multiphoton microscopy. Proc Soc Photo Opt Instrum Eng. 2009;7161:716117-1–716117-10. doi: 10.1117/12.808314. [DOI] [PMC free article] [PubMed] [Google Scholar]
- 3.Pavlova I, et al. Multiphoton microscopy as a diagnostic imaging modality for lung cancer. Proc Soc Photo Opt Instrum Eng. 2010;7569:756918-1–756918-7. doi: 10.1117/12.841017. [DOI] [PMC free article] [PubMed] [Google Scholar]
- 4.Wang CC, et al. Differentiation of normal and cancerous lung tissues by multiphoton imaging. J Biomed Opt. 2009;14:044034-1–044034-4. doi: 10.1117/1.3210768. [DOI] [PubMed] [Google Scholar]
- 5.Wilder-Smith P, et al. In vivo multiphoton fluorescence imaging: A novel approach to oral malignancy. Lasers Surg Med. 2004;35:96–103. doi: 10.1002/lsm.20079. [DOI] [PubMed] [Google Scholar]
- 6.Skala MC, et al. Multiphoton microscopy of endogenous fluorescence differentiates normal, precancerous, and cancerous squamous epithelial tissues. Cancer Res. 2005;65:1180–1186. doi: 10.1158/0008-5472.CAN-04-3031. [DOI] [PMC free article] [PubMed] [Google Scholar]
- 7.Lin SJ, et al. Discrimination of basal cell carcinoma from normal dermal stroma by quantitative multiphoton imaging. Opt Lett. 2006;31:2756–2758. doi: 10.1364/ol.31.002756. [DOI] [PubMed] [Google Scholar]
- 8.Gu M, Bao HC, Li JL. Cancer-cell microsurgery using nonlinear optical endomicroscopy. J Biomed Opt. 2010;15:050502-1–050502-3. doi: 10.1117/1.3502566. [DOI] [PubMed] [Google Scholar]
- 9.Huang X, El-Sayed IH, Qian W, El-Sayed MA. Cancer cell imaging and photothermal therapy in the near-infrared region by using gold nanorods. J Am Chem Soc. 2006;128:2115–2120. doi: 10.1021/ja057254a. [DOI] [PubMed] [Google Scholar]
- 10.Helmchen F, Fee MS, Tank DW, Denk W. A miniature head-mounted neurotechnique two-photon microscope: High-resolution brain imaging in freely moving animals. Neuron. 2001;31:903–912. doi: 10.1016/s0896-6273(01)00421-4. [DOI] [PubMed] [Google Scholar]
- 11.Wu T, Ding Z, Wang K, Chen M, Wang C. Two-dimensional scanning realized by an asymmetry fiber canilever driven by single piezo bender actuator for optical coherence tomography. Opt Express. 2009;17:13819–13829. doi: 10.1364/oe.17.013819. [DOI] [PubMed] [Google Scholar]
- 12.Seibel EJ, Smithwick QYJ. Unique features of optical scanning, single fiber endoscopy. Lasers Surg Med. 2002;30:177–183. doi: 10.1002/lsm.10029. [DOI] [PubMed] [Google Scholar]
- 13.Myaing MT, MacDonald DJ, Li X. Fiber-optic scanning two-photon fluorescence endoscope. Opt Lett. 2006;31:1076–1078. doi: 10.1364/ol.31.001076. [DOI] [PubMed] [Google Scholar]
- 14.Engelbrecht CJ, Johnston RS, Seibel EJ, Helmchen F. Ultra-compact fiber-optic two-photon microscope for functional fluorescence imaging in vivo. Opt Express. 2008;16:5556–5564. doi: 10.1364/oe.16.005556. [DOI] [PubMed] [Google Scholar]
- 15.Wu Y, Leng Y, Xi J, Li X. Scanning all-fiber-optic endomicroscopy system for 3D nonlinear optical imaging of biological tissues. Opt Express. 2009;17:7907–7915. doi: 10.1364/oe.17.007907. [DOI] [PMC free article] [PubMed] [Google Scholar]
- 16.Hendriks BHW, et al. High-resolution resonant and nonresonant fiber-scanning confocal microscope. J Biomed Opt. 2011;16:026007-1–026007-8. doi: 10.1117/1.3534781. [DOI] [PubMed] [Google Scholar]
- 17.Sawinski J, Denk W. Miniature random-access fiber scanner for in vivo multiphoton imaging. J Appl Phys. 2007;102:034701-1–034701-8. [Google Scholar]
- 18.Goetz M, et al. In-vivo confocal real-time mini-microscopy in animal models of human inflammatory and neoplastic diseases. Endoscopy. 2007;39:350–356. doi: 10.1055/s-2007-966262. [DOI] [PubMed] [Google Scholar]
- 19.Le Harzic R, Weinigel M, Riemann I, Konig K, Messerschmidt B. Nonlinear optical endoscope based on a compact two axes piezo scanner and a miniature objective lens. Opt Express. 2008;16:20588–20596. doi: 10.1364/oe.16.020588. [DOI] [PubMed] [Google Scholar]
- 20.Dickensheets D, Kino GS. Micromachined scanning confocal optical microscope. Opt Lett. 1996;21:764–766. doi: 10.1364/ol.21.000764. [DOI] [PubMed] [Google Scholar]
- 21.Hofmann U, et al. Electrostatically driven micromirrors for a miniaturized confocal laser scanning microscope. Proc Soc Photo Opt Instrum Eng. 1999;3878:29–38. [Google Scholar]
- 22.Piyawattanametha W, et al. In vivo brain imaging using a portable 2.9 g two-photon microscope based on a microelectromechanical systems scanning mirror. Opt Lett. 2009;34:2309–2311. doi: 10.1364/ol.34.002309. [DOI] [PMC free article] [PubMed] [Google Scholar]
- 23.Fu L, Jain A, Cranfield C, Xie H, Gu M. Three-dimensional nonlinear optical endoscopy. J Biomed Opt. 2007;12:040501-1–040501-3. doi: 10.1117/1.2756102. [DOI] [PubMed] [Google Scholar]
- 24.Piyawattanametha W, et al. Fast-scanning two-photon fluorescence imaging based on a microelectromechanical systems two-dimensional scanning mirror. Opt Lett. 2006;31:2018–2020. doi: 10.1364/ol.31.002018. [DOI] [PMC free article] [PubMed] [Google Scholar]
- 25.Tang S, et al. Design and implementation of fiber-based multiphoton endoscopy with microelectromechanical systems scanning. J Biomed Opt. 2009;14:034005-1–034005-7. doi: 10.1117/1.3127203. [DOI] [PMC free article] [PubMed] [Google Scholar]
- 26.Kinsler LE, Frey AR, Coppens AB, Sanders JV. Fundamentals of Acoustics. 3rd Ed. New York: Wiley; 1982. [Google Scholar]
- 27.Durst ME, Kobat D, Xu C. Tunable dispersion compensation by a rotating cylindrical lens. Opt Lett. 2009;34:1195–1197. doi: 10.1364/ol.34.001195. [DOI] [PubMed] [Google Scholar]
- 28.Boyd RW. Nonlinear Optics. San Diego: Academic; 1992. pp. 274–280. [Google Scholar]
- 29.Dela Cruz JM, McMullen JD, Williams RM, Zipfel WR. Feasibility of using multiphoton excited tissue autofluorescence for in vivo human histopathology. Biomed Opt Express. 2010;1:1320–1330. doi: 10.1364/BOE.1.001320. [DOI] [PMC free article] [PubMed] [Google Scholar]
- 30.Nguyen QT, Tsai PS, Kleinfeld D. MPScope: A versatile software suite for multiphoton microscopy. J Neurosci Methods. 2006;156:351–9. doi: 10.1016/j.jneumeth.2006.03.001. [DOI] [PubMed] [Google Scholar]
Associated Data
This section collects any data citations, data availability statements, or supplementary materials included in this article.