

Abstract
Obesity may be viewed as a state of chronic low-grade inflammation that participates in the development of the metabolic syndrome. Nonalcoholic steatohepatitis (NASH) is considered a hepatic phenotype of the metabolic syndrome and a high risk for progression to cirrhosis and hepatocellular carcinoma. Although the “two hit” hypothesis suggests involvement of excessive hepatic lipid accumulation and chronic inflammation, the molecular mechanisms underlying the development of NASH remain unclear, in part because of lack of appropriate animal models. Herein we report that melanocortin 4 receptor–deficient mice (MC4R-KO) develop steatohepatitis when fed a high-fat diet, which is associated with obesity, insulin resistance, and dyslipidemia. Histologic analysis reveals inflammatory cell infiltration, hepatocyte ballooning, and pericellular fibrosis in the liver in MC4R-KO mice. Of note, all of the MC4R-KO mice examined developed well-differentiated hepatocellular carcinoma after being fed a high-fat diet for 1 year. They also demonstrated enhanced adipose tissue inflammation, ie, increased macrophage infiltration and fibrotic changes, which may contribute to excessive lipid accumulation and enhanced fibrosis in the liver. Thus, MC4R-KO mice provide a novel mouse model of NASH with which to investigate the sequence of events that make up diet-induced hepatic steatosis, liver fibrosis, and hepatocellular carcinoma and to aid in understanding the pathogenesis of NASH, pursuing specific biomarkers, and evaluating potential therapeutic strategies.
Nonalcoholic fatty liver disease (NAFLD) is characterized by increased accumulation of lipids in the liver without a history of excessive alcohol consumption or known liver disease.1 NAFLD often occurs with the metabolic syndrome, a constellation of visceral fat obesity, impaired glucose metabolism, atherogenic dyslipidemia, and elevated blood pressure, and is considered the hepatic manifestation of the metabolic syndrome.2 Patients with nonalcoholic steatohepatitis (NASH), a subset of NAFLD, are at high risk for progression to cirrhosis and hepatocellular carcinoma (HCC). However, the molecular mechanisms involved in disease progression from simple steatosis to NASH to HCC are currently unclear. This is in part because there are no appropriate animal models that reflect a liver condition of human NASH, although many attempts have been made to generate animal NASH models via genetic, dietary, and pharmacologic approaches.3
The pathogenesis of NASH is thought to involve a multistep process in which the first step is excessive accumulation of lipids in the liver. According to the “two hit” hypothesis, the development of NASH requires the presence of additional pathogenic factors such as oxidative stress, endotoxins, cytokines, chemokines, and lipotoxicity.4, 5, 6 Because NASH is often associated with visceral fat obesity, there should be a mechanistic link between the adipose tissue and the liver.7 Adipose tissue secretes a large number of bioactive substances or adipocytokines such as leptin and adiponectin. Unbalanced production of pro-inflammatory and anti-inflammatory adipocytokines in obesity has been implicated in the pathogenesis of obesity-related complications including NAFLD.7, 8 Indeed, deficiency of leptin signaling protects against hepatic fibrosis in several rodent models of chronic liver injury,9, 10, 11 which suggests that leptin may accelerate development of liver fibrosis. In contrast, studies in adiponectin-deficient mice have revealed that adiponectin is protective against development of hepatic fibrosis and inflammation.12
The melanocortin 4 receptor (MC4R) is a seven-transmembrane G protein–coupled receptor that is expressed in the hypothalamic nuclei and is implicated in regulation of food intake and body weight.13 Previous studies have identified many pathogenic mutations of the MC4R gene at a relatively high frequency in severe early-onset obesity, which suggests that MC4R mutations are the most common known monogenic cause of obesity in humans.14 Some leptin biological actions are mediated, at least in part, via the central melanocortin system.15 Indeed, mice with targeted disruption of MC4R have developed late-onset obesity associated with hyperphagia, hyperinsulinemia, and hyperglycemia.16, 17 MC4R-deficient mice (MC4R-KO mice) fed a high-fat diet (HFD) exhibit massive hepatic steatosis and altered gene expression related to lipid metabolism.18, 19 The role of MC4R in the pathogenesis of NASH, however, has not been elucidated.
Herein we report for the first time that MC4R-KO mice develop a liver condition similar to human NASH when fed an HFD, which is associated with obesity, insulin resistance, and dyslipidemia. Of note, they also demonstrate enhanced adipose tissue inflammation, which may contribute to excessive lipid accumulation and enhanced fibrosis in the liver. Moreover, they develop well-differentiated HCC when fed the HFD for a prolonged time. Our data suggest that MC4R-KO mice would provide a novel rodent model of NASH with which to investigate the sequence of events that make up diet-induced hepatic steatosis, liver fibrosis, and HCC.
Materials and Methods
Animals
MC4R-KO mice on the C57BL/6J background were a gift from Dr. Joel K. Elmquist (University of Texas Southwestern Medical Center, Dallas, TX).13 Male C57BL/6J wild-type (WT) mice were purchased from CLEA Japan, Inc. (Tokyo, Japan). The animals were housed in individual cages in a temperature-, humidity-, and light-controlled room (12-hour light and 12-hour dark cycle) and allowed free access to water and standard diet (CE-2; 343.1 kcal/100 g, 12.6% energy as fat; CLEA Japan, Inc.), unless otherwise noted. In the HFD feeding experiments, 8-week-old male mice were given free access to water and either standard diet or HFD (D12492; 524 kcal/100 g, 60% energy as fat; Research Diets, Inc., New Brunswick, NJ) for 8 or 20 weeks. Detailed dietary composition of the standard diet and HFD is given in Supplemental Table S1 (available on http://ajp.amjpathol.org). At the end of the experiments, the animals fed ad libitum were sacrificed after administration of 30 mg/kg i.p. pentobarbital anesthesia. All animal experiments were conducted in accordance with the guidelines of the Tokyo Medical and Dental University Committee on Animal Research (No. 100098).
Blood Analysis
Blood glucose concentration was measured using the blood glucose test meter (Glutest PRO R; Sanwa Kagaku Kenkyusho Co., Ltd., Nagoya, Japan). Serum alanine aminotransferase, triglyceride (TG), free fatty acid (FFA), and total cholesterol concentrations were measured using the respective standard enzymatic assays. Serum concentrations of insulin and adipocytokines were determined using the respective enzyme-linked immunosorbent assay kits (insulin, Morinaga Co. Ltd., Tokyo, Japan; adiponectin, Otsuka Pharmaceutical Co., Ltd., Tokyo, Japan; and leptin and IL-6, R&D Systems, Inc., Minneapolis, MN). The homeostasis model assessment insulin resistance index was calculated as [fasting glucose (mg/dL) × fasting insulin (μU/mL)]/405.
Hepatic TG Content
Total lipids in the liver were extracted using ice-cold chloroform and methanol, 2:1 (v/v). TG concentrations were measured using an enzymatic assay kit (Wako Pure Chemical Industries, Ltd., Osaka, Japan).20
Histologic Analysis
The liver and epididymal white adipose tissue were fixed with neutral-buffered formalin and embedded in paraffin. Two-micrometer-thick sections of liver were stained using H&E, Masson's trichrome, and Sirius red.20, 21 The presence of α-smooth muscle actin (α-SMA) and α-fetoprotein was detected at immunohistochemistry using mouse monoclonal anti-human α-SMA antibody (Dako A/S, Glostrup, Denmark) and polyclonal goat anti-human α-fetoprotein antibody (Santa Cruz Biotechnology, Inc., Santa Cruz, CA), respectively.20 Areas positive for Sirius red and α-SMA were measured using WinROOF software (Mitani Corp., Tokyo, Japan). Five-micrometer-thick sections of the epididymal white adipose tissue were stained using anti-mouse F4/80 antibody.22, 23 The number of nuclei surrounded by F4/80-positive cells was counted in a 10 mm2 area of each section and expressed as the mean per millimeter squared for quantification of F4/80-positive macrophages. Liver histologic features were assessed by two investigators (S.T. and I.S.) who had no knowledge of the origin of the slides according to the NASH clinical research network scoring system.24 In brief, an NAFLD activity score higher than 5 was considered “definite NASH.”24 The liver fibrosis score was determined semiquantitatively as follows: stage 0, no fibrosis; stage 1, periportal or perisinusoidal fibrosis; stage 2, periportal plus perisinusoidal fibrosis; and stage 3, bridging fibrosis.24
Quantitative RT-PCR
Total RNA was extracted from the liver and epididymal white adipose tissue using Sepasol reagent (Nacalai Tesque, Inc., Kyoto, Japan). Quantitative RT-PCR was performed using the ABI Prism 7000 Sequence Detection System with PCR Master Mix Reagent (Applied Biosystems, Inc., Foster City, CA) as described previously.23 Primers used are given in Table 1. mRNA levels were normalized to those of 36B4 mRNA.
Table 1.
Primers Used in the Present Study
| Genes | Primers |
|---|---|
| ACC1 | |
| Forward | 5′-TGAGATTGGCATGGTAGCCTG-3′ |
| Reverse | 5′-CTCGGCCATCTGGATATTCAG-3′ |
| Catalase | |
| Forward | 5′-GGAGGCAGAAACTTTCCCATT-3′ |
| Reverse | 5′-GGCCAAACCTTGGTCAGATC-3′ |
| COL1A1 | |
| Forward | 5′-CCTCAGGGTATTGCTGGACAAC-3′ |
| Reverse | 5′-ACCACTTGATCCAGAAGGACCTT-3′ |
| CPT1A | |
| Forward | 5′-CCTGCATTCCTTCCCATTTG-3′ |
| Reverse | 5′-TGCCCATGTCCTTGTAATGTG-3′ |
| F4/80 | |
| Forward | 5′-CTTTGGCTATGGGCTTCCAGT-3′ |
| Reverse | 5′-GCAAGGAGGACAGAGTTTATCGTG-3′ |
| FAS | |
| Forward | 5′-CCTGGATAGCATTCCGAACCT-3′ |
| Reverse | 5′-AGCACATCTCGAAGGCTACACA-3′ |
| gp91phox | |
| Forward | 5′-CCAGTGCGTGTTGCTCGA-3′ |
| Reverse | 5′-AGTGAGGTTCCTGTCCAGTTGTCT-3′ |
| MMP-2 | |
| Forward | 5′-CCCCATGAAGCCTTGTTTACC-3′ |
| Reverse | 5′-TTGTAGGAGGTGCCCTGGAA-3′ |
| MTP | |
| Forward | 5′-ACAGGTCCTCGAGCGTGTCT-3′ |
| Reverse | 5′-CAGTGCTCCGCCAGAGAAG-3′ |
| p22phox | |
| Forward | 5′-CATGGAGCGATGTGGACAGA-3′ |
| Reverse | 5′-CCCGAAAAGCTTCACCACAG-3′ |
| p40phox | |
| Forward | 5′-CAGCCAACATCGCTGACATC-3′ |
| Reverse | 5′-CAAAGTGGCTGGTGAAGCCC-3′ |
| p47phox | |
| Forward | 5′-ACTCTCACTGAATACTTCAACG-3′ |
| Reverse | 5′-TCATCAGGCCGCACTTT-3′ |
| p67phox | |
| Forward | 5′-AAGCAAAAAGAGCCCAAGGAA-3′ |
| Reverse | 5′-CATGTAAGGCATAGGCACGCT-3′ |
| PPARα | |
| Forward | 5′-AGGAAGCCGTTCTGTGACAT-3′ |
| Reverse | 5′-AATCCCCTCCTGCAACTTCT-3′ |
| SOD1 | |
| Forward | 5′-GCAGGACCTCATTTTAATCCTCACT-3′ |
| Reverse | 5′-AGGTCTCCAACATGCCTCTCTTC-3′ |
| SREBP1c | |
| Forward | 5′-GGCACTAAGTGCCCTCAACCT-3′ |
| Reverse | 5′-GCCACATAGATCTCTGCCAGTGT-3′ |
| TGFβ1 | |
| Forward | 5′-CCTGAGTGGCTGTCTTTTGACG-3′ |
| Reverse | 5′-AGTGAGCGCTGAATCGAAAGC-3′ |
| TIMP1 | |
| Forward | 5′-CATCACGGGCCGCCTA-3′ |
| Reverse | 5′-AAGCTGCAGGCACTGATGTG-3′ |
| TNFα | |
| Forward | 5′-ACCCTCACACTCAGATCATCTTC-3′ |
| Reverse | 5′-TGGTGGTTTGCTACGACGT-3′ |
| 36B4 | |
| Forward | 5′-GGCCCTGCACTCTCGCTTTC-3′ |
| Reverse | 5′-TGCCAGGACGCGCTTGT-3′ |
Measurement of Serum Hydroperoxides
The total amount of organic hydroperoxides in the serum was measured at spectrophotometry using the derivatives of reactive oxygen metabolites test (FREE Carpe Diem; Diacron International SAS, Grosseto, Italy). Hydroperoxides are intermediate oxidative products of lipids, peptides, and amino acids, and their concentrations represent an index of oxidative injury. This method is described in detail elsewhere.25 In brief, 20-μL serum samples were added to 1 mL assay mixture, gently mixed, and incubated for 3 minutes at 37°C. The absorbance increase at 505 nm was monitored for 2 minutes. The concentrations were expressed in conventional units [Carratelli units (U.CARR)], where 1 U.CARR corresponds to 0.8 mg/L H2O2.
TG Secretion Rate
The TG secretion rate was measured as previously described.26 In brief, 500 mg/kg body weight tyloxapol (Triton WR-1339; Sigma-Aldrich Corp., St. Louis, MO) was injected via the tail vein into mice that had been fasted for 5 hours. Serum TG concentrations were measured at 60 minutes after injection. The TG secretion rate was calculated from the increment in TG concentration per minute multiplied by the serum volume of mice (estimated as 3.5% of body weight in grams) and expressed in milligrams per minute per 100 g body weight.
Statistical Analysis
Data are given as mean ± SE. P < 0.05 was considered statistically significant. Statistical analysis was performed using analysis of variance followed by Scheffé's test.
Results
Metabolic Phenotypes of MC4R-KO Mice
Throughout the experimental period, MC4R-KO mice demonstrated accelerated body weight gain relative to WT mice fed either the standard diet or the HFD (Figure 1A). Both the WT mice fed the HFD and the MC4R-KO mice fed the standard diet exhibited increased adiposity relative to the WT mice fed the standard diet (Figure 1B). Although increased adiposity was observed in MC4R-KO mice at 8 weeks of HFD feeding, there was no further increase or decrease in adipose tissue weight thereafter (Figure 1B). In contrast, MC4R-KO mice exhibited a time-dependent increase in liver weight and hepatic TG content relative to WT mice fed either diet (Figure 1, C and D; and data not shown). Both genotypes fed the HFD exhibited insulin resistance, and MC4R-KO mice fed the HFD exhibited a significant increase in serum FFA concentrations relative to WT mice (Table 2). Dysregulation of adipocytokines was also marked in MC4R-KO mice fed the HFD relative to WT mice (Table 2, and Supplemental Table S2 at http://ajp.amjpathol.org). Serum alanine aminotransferase concentrations were significantly increased in MC4R-KO mice fed the HFD relative to any other groups (Table 2). In essence, these observations are consistent with previous reports that described the metabolic phenotypes in the liver in MC4R-KO mice, which were generated using different strategies.18, 19 Collectively, our data indicate that MC4R-KO mice fed the HFD exhibit metabolic characteristics similar to those in obese humans.
Figure 1.
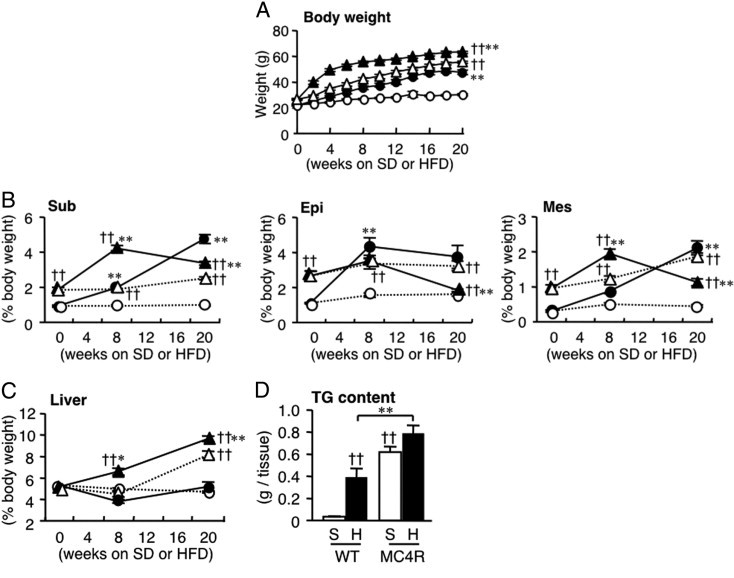
Body and tissue weights in MC4R-KO mice during HFD feeding for 20 weeks. Growth curve (A) and weights of the subcutaneous (Sub), epididymal (Epi), and mesenteric (Mes) white adipose tissue (B) and liver (C) in male MC4R-KO (MC4R) and wild-type (WT) mice fed either the standard diet (SD or S) or the high-fat diet (HFD or H). Open circle, WT-S; closed circle, WT-H; open triangle, MC4R-S; closed triangle, MC4R-H. ††P < 0.01 versus diet-matched control; *P < 0.05; **P < 0.01 versus genotype-matched control. D: Liver TG content at 20 weeks. ††P < 0.01 versus WT-S; **P < 0.01. WT and MC4R, n = 8 at 0 week; WT-S and WT-H, n = 5; MC4R-S, n = 5; MC4R-H, n = 6 at 8 weeks; WT-S, n = 8; WT-H, n = 7; MC4R-S, n = 8; MC4R-H, n = 10 at 20 weeks.
Table 2.
Serologic Parameters of MC4R-KO and WT Mice Fed the HFD for 20 Weeks
| WT mice |
MC4R-KO mice |
|||
|---|---|---|---|---|
| Variable | SD | HFD | SD | HFD |
| Blood glucose (ad lib, mg/dL) | 117.3 ± 5.8 | 133.0 ± 8.3 | 167.4 ± 10.3⁎ | 170.1 ± 12.4 |
| HOMA-IR | 0.8 ± 0.3 | 15.5 ± 3.7⁎ | 17.0 ± 4.0† | 21.8 ± 3.7 |
| TG (mg/dL) | 84.6 ± 9.8 | 46.3 ± 1.2⁎ | 135.8 ± 18.4⁎ | 92.7 ± 8.1 |
| FFA (mEq/L) | 0.27 ± 0.02 | 0.26 ± 0.01 | 0.34 ± 0.02 | 0.51 ± 0.06‡§ |
| TC (mg/dL) | 51.6 ± 2.8 | 189.7 ± 6.4† | 143.0 ± 9.5⁎ | 294.5 ± 9.2‡¶ |
| Adiponectin (μg/mL) | 15.4 ± 1.7 | 19.8 ± 1.7 | 13.5 ± 1.0 | 8.2 ± 0.9‡§ |
| Leptin (ng/mL) | 1.7 ± 0.3 | 97.2 ± 8.3† | 57.7 ± 6.0† | 112.6 ± 9.2¶ |
| IL-6 (pg/mL) | 0.84 ± 0.64 | 2.21 ± 1.68 | 3.25 ± 0.75 | 6.80 ± 0.71‡¶ |
| ALT (IU/L) | 36.9 ± 1.1 | 129.9 ± 19.6 | 191.9 ± 29.2⁎ | 623.9 ± 50.8‡¶ |
n = 7–10. Data are expressed as mean ± SE.
ALT, alanine aminotransferase; FFA, free fatty acid; HFD, high-fat diet; HOMA-IR, homeostasis model assessment–insulin resistance; IL-6, interleukin-6; SD, standard diet; TC, total cholesterol; TG, triglyceride; WT, wild-type.
P < 0.05,
P < 0.01 versus WT-SD;
P < 0.01 versus WT-HFD;
P < 0.05;
P < 0.01 versus MC4R-SD.
Lipid Metabolism and Oxidative Stress in Liver from MC4R-KO Mice
Next examined was lipid metabolism and oxidative stress in liver from MC4R-KO mice fed the HFD. Although histologic examinations revealed minimal lipid accumulation in liver from WT mice fed the HFD for 8 weeks, liver from MC4R-KO mice exhibited massive microvesicular steatosis in the centrilobular and portal areas (Figure 2A). Expression of mRNAs for de novo lipogenesis (fatty acid synthase and acetyl-CoA carboxylase 1) was markedly increased in liver from MC4R-KO mice relative to WT mice at 8 weeks (Figure 2B), as previously reported.18, 19 In addition, expression of mRNAs for fatty acid oxidation (peroxisome proliferator–activated receptor-α and carnitine palmitoyltransferase 1A), and TG secretion (microsomal triglyceride transport protein) and TG secretion rate were increased in liver from MC4R-KO mice (Figure 2, C–E). These observations are consistent with lipid metabolism in human NASH.27 In contrast to the changes in hepatic expression of lipogenic genes in MC4R-KO mice (Figure 2B), WT mice exhibited up-regulation of lipogenic genes only after 20 weeks of HFD feeding (data not shown), which suggests that hepatic steatosis develops much faster in MC4R-KO mice than in WT mice. There was a marked increase in mRNA expression of the NADPH oxidase components (p40phox, p47phox, p67phox, gp91phox, and p22phox), and a slight increase in mRNA expression of antioxidant enzymes (superoxide dismutase 1 and catalase) in the HFD-fed MC4R-KO mice relative to any other groups (see Supplemental Figure S1, A and B, at http://ajp.amjpathol.org). Serum concentrations of derivatives of reactive oxidative metabolite were significantly increased in MC4R-KO mice fed the HFD (P < 0.01; see also Supplemental Figure S1C at http://ajp.amjpathol.org).
Figure 2.
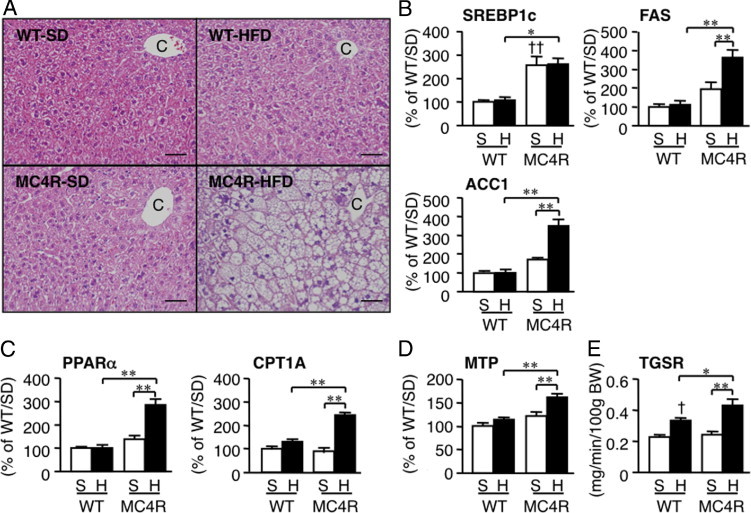
Hepatic histologic features and mRNA expression of genes related to lipid metabolism in MC4R-KO and WT mice fed the HFD for 8 weeks. A: H&E staining of the liver. C, central vein. Original magnification, × 200. Scale bar = 50 μm. Hepatic mRNA expression of genes for de novo lipogenesis (sterol regulatory element binding protein 1c, fatty acid synthase, and acetyl-CoA carboxylase 1) (B), oxidative metabolism (peroxisome proliferator-activated receptor-α and carnitine palmitoyltransferase 1A) (C), and TG secretion (microsomal TG transport protein) (D). E: Triglyceride secretion rate from the liver at 2 weeks of HFD feeding. *P < 0.05; **P < 0.01; †P < 0.05; ††P < 0.01 versus WT-S. WT-S and WT-H, n = 5; MC4R-S, n = 5; MC4R-H, n = 6.
Lipid Accumulation and Fibrosis in Liver from MC4R-KO Mice
After HFD feeding for 20 weeks, microvesicular steatosis was observed uniformly, and moderate inflammatory cell infiltration in liver from WT mice (Figure 3A), whereas liver fibrosis was rarely observed at this time point (Figure 3, B–D). In contrast, liver from MC4R-KO mice fed the HFD exhibited microvesicular and macrovesicular steatosis, ballooning degeneration, and massive infiltration of inflammatory cells (Figure 3A). Masson's trichrome and Sirius red staining revealed marked pericellular fibrosis in liver from MC4R-KO mice fed the HFD (Figure 3, B–D). In addition, the area positive for α-SMA was markedly increased in MC4R-KO mice relative to WT mice fed the HFD for 8 and 20 weeks (P < 0.05 and P < 0.01, respectively; Figure 3, E and F). Histologic analysis demonstrated a significant increase in the NAFLD activity and fibrosis scores in MC4R-KO mice at 8 and 20 weeks of HFD feeding (Figure 3, G and H). Expression of mRNAs for fibrogenic genes (transforming growth factor-β1; collagen, type 1, α1; metalloproteinase-2; and tissue inhibitor of metalloproteinase 1), and inflammatory genes (macrophage marker F4/80 and tumor necrosis factor-α) was increased in liver from MC4R-KO mice relative to WT mice after 20 weeks of HFD feeding (Figure 4). Together, these observations suggest that MC4R-KO mice fed the HFD develop liver fibrosis accompanied by histologic pathognomonic features of human NASH: inflammatory cell infiltration, hepatocyte ballooning, and pericellular fibrosis.1, 24
Figure 3.
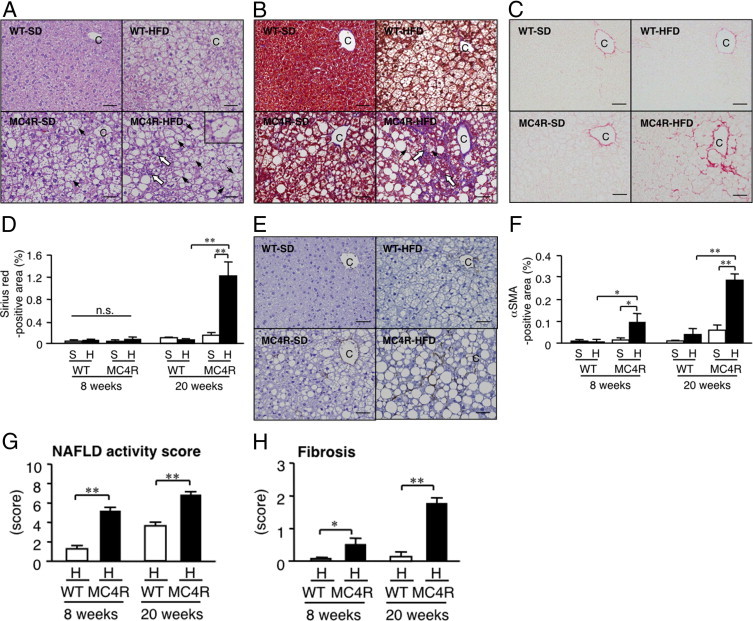
Histologic analysis of liver from MC4R-KO mice fed the HFD for 20 weeks. A: H&E staining of liver sections from MC4R-KO and WT mice after 20 weeks of HFD feeding. Inset: Representative image of hepatocyte ballooning (arrowhead). Fibrillar collagen deposition evaluated using Masson's trichrome staining (B) and Sirius red staining (C) at 20 weeks. D: Quantification of area positive for Sirius red at 8 and 20 weeks. E: Activated hepatic stellate cells determined at α-SMA immunostaining at 20 weeks. F: Quantification of area positive for α-SMA area at 8 and 20 weeks. NAFLD activity (G) and fibrosis (H) scores. Original magnification, × 200. Scale bar = 50 μm. C, central vein; P, portal vein; white arrow, infiltrated inflammatory cells. *P < 0.05; **P < 0.01; n.s., not significant. WT-S and WT-H, n = 5; MC4R-S, n = 5; MC4R-H, n = 6 at 8 weeks. WT-S, n = 8; WT-H, n = 7; MC4R-S, n = 8; and MC4R-H, n = 10 at 20 weeks.
Figure 4.
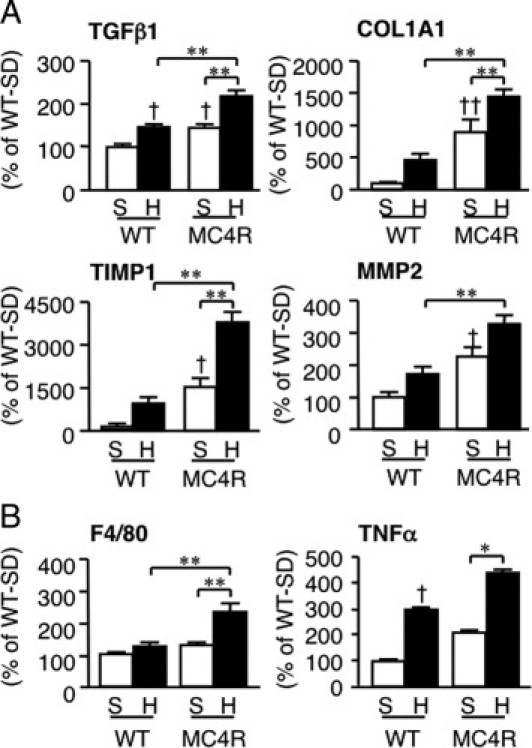
Hepatic mRNA expression in MC4R-KO mice fed the HFD for 20 weeks. Hepatic mRNA expression levels were measured using quantitative PCR after 20 weeks of HFD feeding. mRNA expression of fibrogenic factors (transforming growth factor-β1; collagen, type 1, α1; tissue inhibitor of metalloproteinase 1;, and metalloproteinase 2) (A) and inflammatory markers (F4/80 and tumor necrosis factor-α) (B). *P < 0.05; **P < 0.01; †P < 0.05; ††P < 0.01 versus WT-S. WT-S, n = 8; WT-H, n = 7; MC4R-S, n = 8; and MC4R-H, n = 10.
Development of HCC in MC4R-KO Mice
After feeding the HFD for 1 year, mild fibrosis was observed in WT mice, which was much more accelerated in MC4R-KO mice (see Supplemental Figure S2 at http://ajp.amjpathol.org). Moreover, multiple liver tumors were observed in all of the MC4R-KO mice examined (n = 5) (Figure 5A). Microscopic analysis revealed that the tumors form discrete nodules surrounded by non-tumor liver tissue (Figure 5B). Normal liver architecture was lost, and irregular and thick trabeculae were observed in the tumors (Figure 5C). The tumor cells exhibited severe dysplasia, with an increased nuclear-cytoplasmic ratio, enlarged and hyperchromatic nuclei, and fat deposition in the cytoplasm (Figure 5C). Immunohistochemical analysis revealed that the tumors express α-fetoprotein, a widely recognized marker of HCC (Figure 5D). In contrast, at 20 weeks and even at 1 year, there was no appreciable collagen deposition and tumor development in liver from MC4R-KO mice fed the standard diet (Figures 3; see also Supplemental Figure S2 at http://ajp.amjpathol.org). To elucidate the involvement of the inherent dysregulation of inflammation and fibrogenesis in MC4R-KO mice, we examined the liver and adipose tissue phenotypes in 8 week-old MC4R-KO and WT mice. There was no significant difference in mRNA expression of pro-fibrotic and inflammatory genes between the genotypes at this time point (see Supplemental Figure S3 at http://ajp.amjpathol.org). These observations suggest that in addition to liver fibrosis, MC4R-KO mice fed the HFD develop multiple liver tumors with histologic characteristics of well-differentiated HCC.
Figure 5.
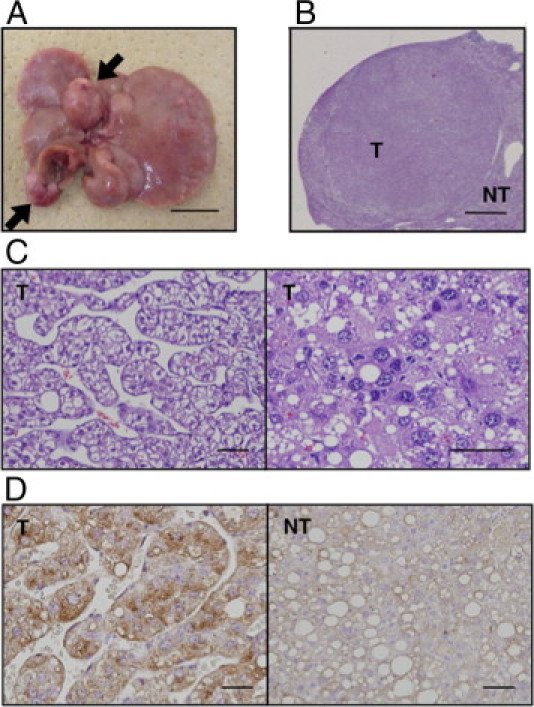
Development of hepatocellular carcinoma in liver from MC4R-KO mice after 1 year of HFD feeding. All MC4R-KO mice (n = 5) developed multiple liver tumors (arrows). A: Representative macroscopic image of liver from MC4R-KO mice. H&E staining (B and C) and α-fetoprotein immunostaining (D) of the tumor. NT, non-tumor liver; T, tumors. Scale bars: 1 cm (A); 1 mm (B); 50 μm (C and D).
Inflammatory and Fibrotic Changes in Adipose Tissue from MC4R-KO Mice
Recent evidence has suggested that obese adipose tissue exhibits chronic inflammatory changes characterized by macrophage infiltration and fibrosis, which may contribute to ectopic lipid accumulation and systemic insulin resistance.28, 29 In the present study, macrophage infiltration and pro-inflammatory cytokine expression were markedly increased in the epididymal white adipose tissue from MC4R-KO mice relative to WT mice after 8 weeks of HFD feeding, although the epididymal white adipose tissue weight was almost comparable between the genotypes (Figure 1B and Figure 6, A and B). Moreover, a marked increase was observed in collagen deposition and in transforming growth factor β1 and in collagen, type 1, α1 mRNA expression in the epididymal white adipose tissue from MC4R-KO mice relative to WT mice (Figure 6, C and D). These observations suggest that adipose tissue inflammation is markedly enhanced in MC4R-KO mice relative to WT mice during HFD feeding, along with dysregulation of adipocytokine production in MC4R-KO mice (see Supplemental Table S2 at http://ajp.amjpathol.org).
Figure 6.
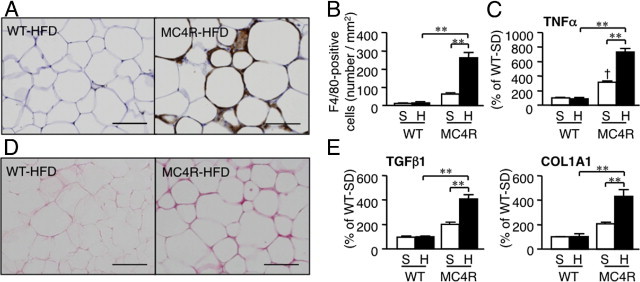
Inflammatory changes in epididymal white adipose tissue from MC4R-KO mice fed the HFD. Representative F4/80 immunostaining (A) and quantification of F4/80-positive cells (B) of the epididymal white adipose tissue from MC4R-KO and WT mice fed the HFD for 8 weeks. Original magnification, ×200. Scale bar = 100 μm. C: Tumor necrosis factor-α mRNA expression in the epididymal white adipose tissue. Sirius red staining of epididymal white adipose tissue (D) and mRNA expression of fibrogenic genes (transforming growth factor-β1; and collagen, type 1, α1) (E). **P < 0.01; †P < 0.05 versus WT-S. WT-S and WT-H, n = 5; and MC4R-S, n = 5, MC4R-H, n = 6.
Discussion
According to the two-hit hypothesis, the pathogenesis of NASH may involve at least two processes: excessive accumulation of lipids in the liver and enhanced liver fibrosis. To understand the molecular mechanism underlying the development of NASH, many animal models of hepatic steatosis and liver fibrosis have been described. Herein we demonstrate that MC4R-KO mice fed an HFD for a relatively short time (20 weeks) exhibit a liver condition similar to human NASH, in addition to obesity and insulin resistance. As a model of hyperphagic obesity, ob/ob mice exhibit severe hepatic steatosis, although they are resistant to liver fibrosis.3 Moreover, animals with diet-induced obesity exhibit hepatic steatosis and develop mild liver fibrosis only after long-term (usually longer than 1 year) HFD feeding,30, 31 as was observed in the present study. In contrast, chemically induced liver fibrosis is not accompanied by obesity, insulin resistance, and hepatic steatosis.3 Dietary deficiency of methionine and choline also contribute to development of steatosis and mild fibrosis, without obesity and insulin resistance.3 In this regard, Larter et al32 recently reported that foz/foz mice, carrying truncating mutation in Alms1, demonstrated both obesity and NASH-like liver histologic features during long-term feeding of an HFD. This study has established MC4R-KO mice fed the HFD for a relatively short time as a novel rodent model of NASH with obesity, insulin resistance, and excessive accumulation of lipids and enhanced fibrosis in the liver.
NASH is a severe form of NAFLD, and can progress to cirrhosis and HCC. However, there have been no appropriate animal models in which NASH progressed to HCC during the course of obesity. Indeed, there are a few genetic models of liver fibrosis and HCC: mice with liver-specific disruption of phosphatase and tensin homolog deleted from chromosome 10 and those lacking methionine adenosyltransferase 1A, although they do not exhibit obesity and insulin resistance.33, 34 In the present study, we have demonstrated that MC4R-KO mice, when fed the HFD over the long term, develop multiple liver tumors with histologic characteristics of well-differentiated HCC. In MC4R-KO mice fed the HFD, enhanced pro-inflammatory cytokine production and fibrotic changes preceded development of multiple liver tumors, which is consistent with a recent report by Park et al35 that increased production of tumor necrosis factor-α and IL-6 in obesity is involved in promotion of carcinogen-induced hepatic tumorigenesis. Collectively, MC4R-KO mice would provide a novel mouse model of NASH with which to investigate the sequence of events that make up diet-induced hepatic steatosis, liver fibrosis, and HCC or how overnutrition leads to hepatic steatosis and liver fibrosis and eventually to HCC.
During the course of obesity, there might be complex interactions between the adipose tissue and the liver (the adipohepatic axis) in the pathogenesis of NASH.6, 7 In the present study, enhanced adipose tissue inflammation, ie, increased macrophage infiltration and fibrotic changes, was observed in MC4R-KO mice relative to WT mice during the HFD feeding. We previously have demonstrated that cross-talk between adipocytes and macrophages in obese adipose tissue results in marked up-regulation of pro-inflammatory adipocytokines such as tumor necrosis factor-α and significant down-regulation of anti-inflammatory adiponectin.36 Of note, saturated fatty acids, which are released in large quantities from hypertrophied adipocytes via macrophage-induced lipolysis, may act as an endogenous ligand for the Toll-like receptor 4 complex.37 Moreover, FFAs, when overproduced in the visceral fat depots through the cross-talk between adipocytes and macrophages, may enter the liver via the portal vein. Indeed, MC4R-KO mice demonstrated increased serum concentrations of FFA relative to WT mice during the HFD feeding. It is, therefore, likely that enhanced adipose tissue inflammation in MC4R-KO mice causes dysregulation of adipocytokine production and FFA release, thereby contributing to the NASH-like hepatic phenotype. Also observed was a marked increase in collagen deposition in white adipose tissue from MC4R-KO mice. Khan et al38 recently reported that in collagen VI–deficient mice extracellular matrix components, when increased in obese adipose tissue, inhibited adipose tissue expansion. This is consistent with a recent clinical study that demonstrated that adipose tissue fibrosis is negatively correlated with adipocyte diameter in obese humans.39 Moreover, McQuaid et al40 reported that the lipid storage function in adipose tissue is negatively associated with ectopic lipid accumulation in obese humans. It is, therefore, conceivable that both adipose tissue macrophage infiltration and fibrotic changes increase the release of FFAs, thereby contributing to excessive fat accumulation in the liver in MC4R-KO mice. Together, these observations suggest that enhanced adipose tissue inflammation has a role in development of NASH as both the first and second hits in MC4R-KO mice. These data suggest that MC4R-KO mice are useful for investigation of the role of the adipohepatic axis in the development of NASH.
Because MC4R mRNA expression is restricted to the hypothalamus and other brain regions41 and is undetectable in liver from WT mice fed the HFD (Itoh et al, unpublished data, 2010), it is likely that the hepatic phenotype in MC4R-KO mice results from loss of function of MC4R in the brain. In the present study, MC4R-KO mice demonstrated increased expression of mRNAs for de novo lipogenesis, fatty acid oxidation, and TG secretion relative to WT mice fed the HFD. This is consistent with a recent report by Nogueiras et al42 that short-term pharmacologic blockade of the central melanocortin system in WT mice results in increased expression of de novo lipogenic genes and microsomal TG transport protein in the liver. Evidence has accumulated suggesting that the brain and liver interact via neuronal pathways, central insulin signaling regulates glucose metabolism in the liver, and peroxisome proliferator-activated receptor-γ activation in the liver modulates energy expenditure and systemic insulin sensitivity via the sympathetic nervous system.43, 44 In this regard, we previously reported that the central melanocortin system is involved in renal macrophage infiltration in a mouse model of renal fibrosis.21 This discussion also supports the concept that MC4R signaling in the brain is involved in excessive accumulation of lipids and fibrosis in the liver in MC4R-KO mice.
Because MC4R-KO mice exhibited hyperleptinemia, leptin signaling may have a role in the pathogenesis of the hepatic liver phenotype in MC4R-KO mice. Indeed, deficiency of leptin signaling protects against hepatic fibrosis in several rodent models of chronic liver injury.9, 10, 11 Exogenous leptin administration also accelerates carbon tetrachloride–induced liver fibrosis in WT mice.45 These findings led us to speculate that leptin acts as a pro-inflammatory and pro-fibrotic cytokine in liver fibrosis. However, obesity is associated with the reduced ability of circulating leptin to regulate energy homeostasis or central leptin resistance.46 Inasmuch as leptin receptors are widely expressed in peripheral tissues including the liver,47 leptin may act directly on the liver to induce inflammation and fibrosis. If so, it would be important to know whether leptin is effective in the peripheral tissues in obesity. Further studies will be required to elucidate how hyperleptinemia is involved in development of the hepatic phenotype in MC4R-KO mice. It would be interesting to generate tissue-specific leptin receptor–deficient mice and/or MC4R-KO mice crossed with ob/ob mice for the next phase of study.
In conclusion, the present study is the first to demonstrate that MC4R-KO mice develop a liver condition similar to human NASH when fed an HFD, which is associated with obesity, insulin resistance, and dyslipidemia. Of note, they develop well-differentiated HCC after long-term HFD feeding. Our data support the concept that NASH develops from a combination of excessive lipid accumulation in the liver and systemic and/or local chronic inflammation. Thus, MC4R-KO mice would provide a novel mouse model of NASH with which to investigate the sequence of events that make up diet-induced hepatic steatosis, liver fibrosis, and HCC, and thus aid in understanding its pathophysiologic features, pursuing specific biomarkers, and evaluating potential therapeutic strategies.
Acknowledgments
We thank Dr. Joel K. Elmquist (University of Texas Southwestern Medical Center, Dallas, TX) for the gift of MC4R-KO mice, Dr. Snorri Thorgeirsson (National Institutes of Health, Bethesda, MD) for helpful comments, Ai Togo for secretarial assistance, Takahiro Fukaishi for technical assistance, and the members of the Ogawa Laboratory for helpful discussions.
Footnotes
Supported in part by grants-in-aid for scientific research from the Ministry of Education, Culture, Sports, Science, and Technology of Japan, the Ministry of Health, Labour and Welfare of Japan, Japan Science and Technology Agency, and research grants from Takeda Science Foundation, Ono Medical Research Foundation, The Naito Foundation, Yamaguchi Endocrine Research Foundation, and Usage/Research Program of Medical Research Institute, Tokyo Medical and Dental University.
Supplemental material for this article can be found on http://ajp.amjpathol.org or at doi: 10.1016/j.ajpath.2011.07.014.
Contributor Information
Takayoshi Suganami, Email: suganami.mmm@mri.tmd.ac.jp.
Yoshihiro Ogawa, Email: ogawa.mmm@mri.tmd.ac.jp.
Supplementary data
Hepatic mRNA expression and a serum marker related to oxidative stress in MC4R-KO and WT mice fed the HFD for 8 weeks. Hepatic mRNA expression of NADPH oxidase components (p40phox, p47phox, p67phox, gp91phox, and p22phox) (A) and antioxidant enzymes (superoxide dismutase 1 and catalase) (B). C: Serum concentrations of derivatives of reactive oxidative metabolite. S, standard diet; H, high-fat diet. ††P < 0.01 versus WT-S; **P < 0.01. WT-S and WT-H, n = 5; MC4R-S, n = 5; MC4R-H, n = 6.
Histologic analysis of liver from MC4R-KO and WT mice fed the HFD for 1 year. Fibrillar collagen deposition evaluated using Sirius red staining (A) and quantification of the area positive for Sirius red (B) after 1 year of HFD feeding. Original magnification, ×200. Scale bar = 50 μm. C, central vein. **P < 0.01, n = 5.
Comparison of MC4R-KO and WT mice before the HFD feeding. Body weight (A) and tissue weights (B) of 8-week-old MC4R-KO and WT mice. mRNA expression of tumor necrosis factor-α in the epididymal fat (C) and genes related to fibrogenesis (transforming growth factor-β1; and collagen, type 1, α1) and inflammation (tumor necrosis factor-α and F4/80) in the liver (D). n.s., not significant. *P < 0.05; **P < 0.01; n = 8.
References
- 1.Neuschwander-Tetri B.A., Caldwell S.H. Nonalcoholic steatohepatitis: summary of an AASLD single topic conference. Hepatology. 2003;37:1202–1219. doi: 10.1053/jhep.2003.50193. [DOI] [PubMed] [Google Scholar]
- 2.Marchesini G., Bugianesi E., Forlani G., Cerrelli F., Lenzi M., Manini R., Natale S., Vanni E., Villanova N., Melchionda N., Rizzetto M. Nonalcoholic fatty liver, steatohepatitis, and the metabolic syndrome. Hepatology. 2003;37:917–923. doi: 10.1053/jhep.2003.50161. [DOI] [PubMed] [Google Scholar]
- 3.Varela-Rey M., Embade N., Ariz U., Lu S.C., Mato J.M., Martinez-Chantar M.L. Non-alcoholic steatohepatitis and animal models: understanding the human disease. Int J Biochem Cell Biol. 2009;41:969–976. doi: 10.1016/j.biocel.2008.10.027. [DOI] [PubMed] [Google Scholar]
- 4.Day C.P., James O.F. Steatohepatitis: a tale of two “hits”? Gastroenterology. 1998;114:842–845. doi: 10.1016/s0016-5085(98)70599-2. [DOI] [PubMed] [Google Scholar]
- 5.Browning J.D., Horton J.D. Molecular mediators of hepatic steatosis and liver injury. J Clin Invest. 2004;114:147–152. doi: 10.1172/JCI22422. [DOI] [PMC free article] [PubMed] [Google Scholar]
- 6.Neuschwander-Tetri B.A. Hepatic lipotoxicity and the pathogenesis of nonalcoholic steatohepatitis: the central role of nontriglyceride fatty acid metabolites. Hepatology. 2010;52:774–788. doi: 10.1002/hep.23719. [DOI] [PubMed] [Google Scholar]
- 7.Day C.P. From fat to inflammation. Gastroenterology. 2006;130:207–210. doi: 10.1053/j.gastro.2005.11.017. [DOI] [PubMed] [Google Scholar]
- 8.Marra F., Bertolani C. Adipokines in liver diseases. Hepatology. 2009;50:957–969. doi: 10.1002/hep.23046. [DOI] [PubMed] [Google Scholar]
- 9.Leclercq I.A., Farrell G.C., Schriemer R., Robertson G.R. Leptin is essential for the hepatic fibrogenic response to chronic liver injury. J Hepatol. 2002;37:206–213. doi: 10.1016/s0168-8278(02)00102-2. [DOI] [PubMed] [Google Scholar]
- 10.Aleffi S., Petrai I., Bertolani C., Parola M., Colombatto S., Novo E., Vizzutti F., Anania F.A., Milani S., Rombouts K., Laffi G., Pinzani M., Marra F. Upregulation of proinflammatory and proangiogenic cytokines by leptin in human hepatic stellate cells. Hepatology. 2005;42:1339–1348. doi: 10.1002/hep.20965. [DOI] [PubMed] [Google Scholar]
- 11.Saxena N.K., Ikeda K., Rockey D.C., Friedman S.L., Anania F.A. Leptin in hepatic fibrosis: evidence for increased collagen production in stellate cells and lean littermates of ob/ob mice. Hepatology. 2002;35:762–771. doi: 10.1053/jhep.2002.32029. [DOI] [PMC free article] [PubMed] [Google Scholar]
- 12.Kamada Y., Matsumoto H., Tamura S., Fukushima J., Kiso S., Fukui K., Igura T., Maeda N., Kihara S., Funahashi T., Matsuzawa Y., Shimomura I., Hayashi N. Hypoadiponectinemia accelerates hepatic tumor formation in a nonalcoholic steatohepatitis mouse model. J Hepatol. 2007;47:556–564. doi: 10.1016/j.jhep.2007.03.020. [DOI] [PubMed] [Google Scholar]
- 13.Balthasar N., Dalgaard L.T., Lee C.E., Yu J., Funahashi H., Williams T., Ferreira M., Tang V., McGovern R.A., Kenny C.D., Christiansen L.M., Edelstein E., Choi B., Boss O., Aschkenasi C., Zhang C.Y., Mountjoy K., Kishi T., Elmquist J.K., Lowell B.B. Divergence of melanocortin pathways in the control of food intake and energy expenditure. Cell. 2005;123:493–505. doi: 10.1016/j.cell.2005.08.035. [DOI] [PubMed] [Google Scholar]
- 14.Vaisse C., Clement K., Durand E., Hercberg S., Guy-Grand B., Froguel P. Melanocortin-4 receptor mutations are a frequent and heterogeneous cause of morbid obesity. J Clin Invest. 2000;106:253–262. doi: 10.1172/JCI9238. [DOI] [PMC free article] [PubMed] [Google Scholar]
- 15.Friedman J.M., Halaas J.L. Leptin and the regulation of body weight in mammals. Nature. 1998;395:763–770. doi: 10.1038/27376. [DOI] [PubMed] [Google Scholar]
- 16.Marsh D.J., Hollopeter G., Huszar D., Laufer R., Yagaloff K.A., Fisher S.L., Burn P., Palmiter R.D. Response of melanocortin-4 receptor–deficient mice to anorectic and orexigenic peptides. Nat Genet. 1999;21:119–122. doi: 10.1038/5070. [DOI] [PubMed] [Google Scholar]
- 17.Huszar D., Lynch C.A., Fairchild-Huntress V., Dunmore J.H., Fang Q., Berkemeier L.R., Gu W., Kesterson R.A., Boston B.A., Cone R.D., Smith F.J., Campfield L.A., Burn P., Lee F. Targeted disruption of the melanocortin-4 receptor results in obesity in mice. Cell. 1997;88:131–141. doi: 10.1016/s0092-8674(00)81865-6. [DOI] [PubMed] [Google Scholar]
- 18.Albarado D.C., McClaine J., Stephens J.M., Mynatt R.L., Ye J., Bannon A.W., Richards W.G., Butler A.A. Impaired coordination of nutrient intake and substrate oxidation in melanocortin-4 receptor knockout mice. Endocrinology. 2004;145:243–252. doi: 10.1210/en.2003-0452. [DOI] [PubMed] [Google Scholar]
- 19.Sutton G.M., Trevaskis J.L., Hulver M.W., McMillan R.P., Markward N.J., Babin M.J., Meyer E.A., Butler A.A. Diet-genotype interactions in the development of the obese, insulin-resistant phenotype of C57BL/6J mice lacking melanocortin-3 or -4 receptors. Endocrinology. 2006;147:2183–2196. doi: 10.1210/en.2005-1209. [DOI] [PMC free article] [PubMed] [Google Scholar]
- 20.Sakaida I., Terai S., Yamamoto N., Aoyama K., Ishikawa T., Nishina H., Okita K. Transplantation of bone marrow cells reduces CCl4-induced liver fibrosis in mice. Hepatology. 2004;40:1304–1311. doi: 10.1002/hep.20452. [DOI] [PubMed] [Google Scholar]
- 21.Tanaka M., Suganami T., Sugita S., Shimoda Y., Kasahara M., Aoe S., Takeya M., Takeda S., Kamei Y., Ogawa Y. Role of central leptin signaling in renal macrophage infiltration. Endocr J. 2010;57:61–72. doi: 10.1507/endocrj.k09e-296. [DOI] [PubMed] [Google Scholar]
- 22.Kitagawa K., Wada T., Furuichi K., Hashimoto H., Ishiwata Y., Asano M., Takeya M., Kuziel W.A., Matsushima K., Mukaida N., Yokoyama H. Blockade of CCR2 ameliorates progressive fibrosis in kidney. Am J Pathol. 2004;165:237–246. doi: 10.1016/S0002-9440(10)63292-0. [DOI] [PMC free article] [PubMed] [Google Scholar]
- 23.Itoh M., Suganami T., Satoh N., Tanimoto-Koyama K., Yuan X., Tanaka M., Kawano H., Yano T., Aoe S., Takeya M., Shimatsu A., Kuzuya H., Kamei Y., Ogawa Y. Increased adiponectin secretion by highly purified eicosapentaenoic acid in rodent models of obesity and human obese subjects. Arterioscler Thromb Vasc Biol. 2007;27:1918–1925. doi: 10.1161/ATVBAHA.106.136853. [DOI] [PubMed] [Google Scholar]
- 24.Juluri R., Vuppalanchi R., Olson J., Unalp A., Van Natta M.L., Cummings O.W., Tonascia J., Chalasani N. Generalizability of the Nonalcoholic Steatohepatitis Clinical Research Network Histologic Scoring System for Nonalcoholic Fatty Liver Disease. J Clin Gastroenterol. 2010;45:55–58. doi: 10.1097/MCG.0b013e3181dd1348. [DOI] [PMC free article] [PubMed] [Google Scholar]
- 25.Kondo K., Shibata R., Unno K., Shimano M., Ishii M., Kito T., Shintani S., Walsh K., Ouchi N., Murohara T. Impact of a single intracoronary administration of adiponectin on myocardial ischemia/reperfusion injury in a pig model. Circ Cardiovasc Interv. 2010;3:166–173. doi: 10.1161/CIRCINTERVENTIONS.109.872044. [DOI] [PMC free article] [PubMed] [Google Scholar]
- 26.Deushi M., Nomura M., Kawakami A., Haraguchi M., Ito M., Okazaki M., Ishii H., Yoshida M. Ezetimibe improves liver steatosis and insulin resistance in obese rat model of metabolic syndrome. FEBS Lett. 2007;581:5664–5670. doi: 10.1016/j.febslet.2007.11.023. [DOI] [PubMed] [Google Scholar]
- 27.Marra F., Gastaldelli A., Svegliati Baroni G., Tell G., Tiribelli C. Molecular basis and mechanisms of progression of non-alcoholic steatohepatitis. Trends Mol Med. 2008;14:72–81. doi: 10.1016/j.molmed.2007.12.003. [DOI] [PubMed] [Google Scholar]
- 28.Weisberg S.P., McCann D., Desai M., Rosenbaum M., Leibel R.L., Ferrante A.W., Jr Obesity is associated with macrophage accumulation in adipose tissue. J Clin Invest. 2003;112:1796–1808. doi: 10.1172/JCI19246. [DOI] [PMC free article] [PubMed] [Google Scholar]
- 29.Unger R.H., Scherer P.E. Gluttony, sloth and the metabolic syndrome: a roadmap to lipotoxicity. Trends Endocrinol Metab. 2010;21:345–352. doi: 10.1016/j.tem.2010.01.009. [DOI] [PMC free article] [PubMed] [Google Scholar]
- 30.DeLeve L.D., Wang X., Kanel G.C., Atkinson R.D., McCuskey R.S. Prevention of hepatic fibrosis in a murine model of metabolic syndrome with nonalcoholic steatohepatitis. Am J Pathol. 2008;173:993–1001. doi: 10.2353/ajpath.2008.070720. [DOI] [PMC free article] [PubMed] [Google Scholar]
- 31.Ito M., Suzuki J., Tsujioka S., Sasaki M., Gomori A., Shirakura T., Hirose H., Ito M., Ishihara A., Iwaasa H., Kanatani A. Longitudinal analysis of murine steatohepatitis model induced by chronic exposure to high-fat diet. Hepatol Res. 2007;37:50–57. doi: 10.1111/j.1872-034X.2007.00008.x. [DOI] [PubMed] [Google Scholar]
- 32.Larter C.Z., Yeh M.M., Van Rooyen D.M., Teoh N.C., Brooling J., Hou J.Y., Williams J., Clyne M., Nolan C.J., Farrell G.C. Roles of adipose restriction and metabolic factors in progression of steatosis to steatohepatitis in obese, diabetic mice. J Gastroenterol Hepatol. 2009;24:1658–1668. doi: 10.1111/j.1440-1746.2009.05996.x. [DOI] [PubMed] [Google Scholar]
- 33.Martinez-Chantar M.L., Corrales F.J., Martinez-Cruz L.A., Garcia-Trevijano E.R., Huang Z.Z., Chen L., Kanel G., Avila M.A., Mato J.M., Lu S.C. Spontaneous oxidative stress and liver tumors in mice lacking methionine adenosyltransferase 1A. FASEB J. 2002;16:1292–1294. doi: 10.1096/fj.02-0078fje. [DOI] [PubMed] [Google Scholar]
- 34.Horie Y., Suzuki A., Kataoka E., Sasaki T., Hamada K., Sasaki J., Mizuno K., Hasegawa G., Kishimoto H., Iizuka M., Naito M., Enomoto K., Watanabe S., Mak T.W., Nakano T. Hepatocyte-specific Pten deficiency results in steatohepatitis and hepatocellular carcinomas. J Clin Invest. 2004;113:1774–1783. doi: 10.1172/JCI20513. [DOI] [PMC free article] [PubMed] [Google Scholar]
- 35.Park E.J., Lee J.H., Yu G.Y., He G., Ali S.R., Holzer R.G., Osterreicher C.H., Takahashi H., Karin M. Dietary and genetic obesity promote liver inflammation and tumorigenesis by enhancing IL-6 and TNF expression. Cell. 2010;140:197–208. doi: 10.1016/j.cell.2009.12.052. [DOI] [PMC free article] [PubMed] [Google Scholar]
- 36.Suganami T., Nishida J., Ogawa Y. A paracrine loop between adipocytes and macrophages aggravates inflammatory changes: role of free fatty acids and tumor necrosis factor α. Arterioscler Thromb Vasc Biol. 2005;25:2062–2068. doi: 10.1161/01.ATV.0000183883.72263.13. [DOI] [PubMed] [Google Scholar]
- 37.Suganami T., Tanimoto-Koyama K., Nishida J., Itoh M., Yuan X., Mizuarai S., Kotani H., Yamaoka S., Miyake K., Aoe S., Kamei Y., Ogawa Y. Role of the Toll-like receptor 4/NF-κB pathway in saturated fatty acid-induced inflammatory changes in the interaction between adipocytes and macrophages. Arterioscler Thromb Vasc Biol. 2007;27:84–91. doi: 10.1161/01.ATV.0000251608.09329.9a. [DOI] [PubMed] [Google Scholar]
- 38.Khan T., Muise E.S., Iyengar P., Wang Z.V., Chandalia M., Abate N., Zhang B.B., Bonaldo P., Chua S., Scherer P.E. Metabolic dysregulation and adipose tissue fibrosis: role of collagen VI. Mol Cell Biol. 2009;29:1575–1591. doi: 10.1128/MCB.01300-08. [DOI] [PMC free article] [PubMed] [Google Scholar]
- 39.Divoux A., Tordjman J., Lacasa D., Veyrie N., Hugol D., Aissat A., Basdevant A., Guerre-Millo M., Poitou C., Zucker J.D., Bedossa P., Clement K. Fibrosis in human adipose tissue: composition, distribution, and link with lipid metabolism and fat mass loss. Diabetes. 2010;59:2817–2825. doi: 10.2337/db10-0585. [DOI] [PMC free article] [PubMed] [Google Scholar]
- 40.McQuaid S.E., Hodson L., Neville M.J., Dennis A.L., Cheeseman J., Humphreys S.M., Ruge T., Gilbert M., Fielding B.A., Frayn K.N., Karpe F. Downregulation of adipose tissue fatty acid trafficking in obesity: a driver for ectopic fat deposition? Diabetes. 2011;60:47–55. doi: 10.2337/db10-0867. [DOI] [PMC free article] [PubMed] [Google Scholar]
- 41.Gautron L., Lee C., Funahashi H., Friedman J., Lee S., Elmquist J. Melanocortin-4 receptor expression in a vago-vagal circuitry involved in postprandial functions. J Comp Neurol. 2010;518:6–24. doi: 10.1002/cne.22221. [DOI] [PMC free article] [PubMed] [Google Scholar]
- 42.Nogueiras R., Wiedmer P., Perez-Tilve D., Veyrat-Durebex C., Keogh J.M., Sutton G.M., Pfluger P.T., Castaneda T.R., Neschen S., Hofmann S.M., Howles P.N., Morgan D.A., Benoit S.C., Szanto I., Schrott B., Schurmann A., Joost H.G., Hammond C., Hui D.Y., Woods S.C., Rahmouni K., Butler A.A., Farooqi I.S., O'Rahilly S., Rohner-Jeanrenaud F., Tschop M.H. The central melanocortin system directly controls peripheral lipid metabolism. J Clin Invest. 2007;117:3475–3488. doi: 10.1172/JCI31743. [DOI] [PMC free article] [PubMed] [Google Scholar]
- 43.Inoue H., Ogawa W., Asakawa A., Okamoto Y., Nishizawa A., Matsumoto M., Teshigawara K., Matsuki Y., Watanabe E., Hiramatsu R., Notohara K., Katayose K., Okamura H., Kahn C.R., Noda T., Takeda K., Akira S., Inui A., Kasuga M. Role of hepatic STAT3 in brain-insulin action on hepatic glucose production. Cell Metab. 2006;3:267–275. doi: 10.1016/j.cmet.2006.02.009. [DOI] [PubMed] [Google Scholar]
- 44.Uno K., Katagiri H., Yamada T., Ishigaki Y., Ogihara T., Imai J., Hasegawa Y., Gao J., Kaneko K., Iwasaki H., Ishihara H., Sasano H., Inukai K., Mizuguchi H., Asano T., Shiota M., Nakazato M., Oka Y. Neuronal pathway from the liver modulates energy expenditure and systemic insulin sensitivity. Science. 2006;312:1656–1659. doi: 10.1126/science.1126010. [DOI] [PubMed] [Google Scholar]
- 45.Ikejima K., Honda H., Yoshikawa M., Hirose M., Kitamura T., Takei Y., Sato N. Leptin augments inflammatory and profibrogenic responses in the murine liver induced by hepatotoxic chemicals. Hepatology. 2001;34:288–297. doi: 10.1053/jhep.2001.26518. [DOI] [PubMed] [Google Scholar]
- 46.Friedman J.M. Modern science versus the stigma of obesity. Nat Med. 2004;10:563–569. doi: 10.1038/nm0604-563. [DOI] [PubMed] [Google Scholar]
- 47.Morris D.L., Rui L. Recent advances in understanding leptin signaling and leptin resistance. Am J Physiol Endocrinol Metab. 2009;297:E1247–E1259. doi: 10.1152/ajpendo.00274.2009. [DOI] [PMC free article] [PubMed] [Google Scholar]
Associated Data
This section collects any data citations, data availability statements, or supplementary materials included in this article.
Supplementary Materials
Hepatic mRNA expression and a serum marker related to oxidative stress in MC4R-KO and WT mice fed the HFD for 8 weeks. Hepatic mRNA expression of NADPH oxidase components (p40phox, p47phox, p67phox, gp91phox, and p22phox) (A) and antioxidant enzymes (superoxide dismutase 1 and catalase) (B). C: Serum concentrations of derivatives of reactive oxidative metabolite. S, standard diet; H, high-fat diet. ††P < 0.01 versus WT-S; **P < 0.01. WT-S and WT-H, n = 5; MC4R-S, n = 5; MC4R-H, n = 6.
Histologic analysis of liver from MC4R-KO and WT mice fed the HFD for 1 year. Fibrillar collagen deposition evaluated using Sirius red staining (A) and quantification of the area positive for Sirius red (B) after 1 year of HFD feeding. Original magnification, ×200. Scale bar = 50 μm. C, central vein. **P < 0.01, n = 5.
Comparison of MC4R-KO and WT mice before the HFD feeding. Body weight (A) and tissue weights (B) of 8-week-old MC4R-KO and WT mice. mRNA expression of tumor necrosis factor-α in the epididymal fat (C) and genes related to fibrogenesis (transforming growth factor-β1; and collagen, type 1, α1) and inflammation (tumor necrosis factor-α and F4/80) in the liver (D). n.s., not significant. *P < 0.05; **P < 0.01; n = 8.