

Abstract
Expansions of noncoding CUG and CCUG repeats in myotonic dystrophies type 1 (DM1) and DM2 cause complex molecular pathology, the features of which include accumulation of RNA aggregates and misregulation of the RNA-binding proteins muscleblind-like 1 (MBNL1) and CUG-binding protein 1 (CUGBP1). CCUG repeats also decrease amounts of the nucleic acid binding protein ZNF9. Using tetracycline (Tet)–regulated monoclonal cell models that express CUG and CCUG repeats, we found that low levels of long CUG and CCUG repeats result in nuclear and cytoplasmic RNA aggregation with a simultaneous increase of CUGBP1 and a reduction of ZNF9. Elevation of CUGBP1 and reduction of ZNF9 were also observed before strong aggregation of the mutant CUG/CCUG repeats. Degradation of CUG and CCUG repeats normalizes ZNF9 and CUGBP1 levels. Comparison of short and long CUG and CCUG RNAs showed that great expression of short repeats form foci and alter CUGBP1 and ZNF9; however, long CUG/CCUG repeats misregulate CUGBP1 and ZNF9 much faster than high levels of the short repeats. These data suggest that correction of DM1 and DM2 might be achieved by complete and efficient degradation of CUG and CCUG repeats or by a simultaneous disruption of CUG/CCUG foci and correction of CUGBP1 and ZNF9.
Myotonic dystrophies type 1 and type 2 (DM1 and DM2) are complex, inherited, neuro-muscular diseases without cure.1, 2 DM1 is caused by an expansion of untranslated CTG repeats within the 3′ untranslated region (UTR) of the dystrophia myotonica-protein kinase (DMPK) gene located on chromosome 19q, whereas DM2 is caused by expansion of CCTG repeats within intron 1 of the CCHC-type zinc finger, nucleic acid binding protein (ZNF9) gene.3, 4, 5, 6, 7, 8, 9 Mutations in DM1 and DM2 produce symptoms of the disease through accumulation of untranslated RNA CUG and CCUG repeats, which disrupt RNA processing (splicing, translation, RNA stability, and transcription) in patients' cells.10, 11, 12, 13, 14, 15, 16, 17, 18, 19, 20, 21, 22, 23, 24, 25, 26, 27, 28 There is evidence that mutant RNA CCUG repeats also reduce ZNF9,29, 30, 31 changing protein turnover at the level of global protein synthesis through the decreased translation of 5′ terminal oligopyrimidine tract (TOP)–containing mRNAs regulated by ZNF9.29, 30 In addition, protein expression is altered in DM2 patients at the level of protein degradation through the inhibition of the proteasome-ubiquitin pathway.32, 33
The expansion of CUG and CCUG repeats changes biological activities of several RNA binding proteins including muscleblind-like 1 (MBNL1) and CUG-binding protein 1 (CUGBP1).11, 12, 13, 14, 16, 18, 19, 20, 21, 22, 23, 24, 25, 26, 32 Whereas some mutant CUG and CCUG repeats form aggregates that sequester MBNL1, other CUG/CCUG repeats remain soluble, stabilizing CUGBP1 and leading to an elevated amounts of CUGBP1.9, 15, 16, 18, 24, 32, 34, 35 CUG and CCUG repeats aggregate in DM1 and DM2 patients; however, it remains unknown whether these foci are formed by long, nondegraded mutant CUG and CCUG RNAs or by short products of degradation of RNA expansions.9, 15, 16, 32, 34, 35 It is also not known whether the formation of these aggregates is responsible for all key molecular abnormalities in DM cells, besides sequestration of MBNL1.16, 21, 35 In fact, several reports indicate the lack of correlation between foci formation and severity of disease. For instance, induced expression of the normal 3′ UTR of DMPK containing five CUG repeats in mice was sufficient to cause myotonia, muscular dystrophy, and cardiac abnormalities in the absence of foci formation.24 Formation of CUG foci in two lines of Drosophila models of DM1 caused muscle disruption in one line, but had no effect in another line.36 Splicing abnormalities and aggregation of CUG repeats are known to be independent events.37 Taking into account these observations, we aimed to resolve the question of whether aggregation of CUG/CCUG RNAs is a primary event in DM1 and DM2 pathogenic mechanisms. Previous studies from our laboratory and other laboratories showed that CUGBP1 elevation is an early event of CUG toxicity; however, it remains unknown whether CUG foci formation precedes elevation of CUGBP1.38, 39 It is also important to determine whether elevation of CUGBP1 and the decrease of ZNF9 are primary events of CCUG accumulation or are consequences of the aggregation of CCUG repeats. The elucidation of the primary targets of CUG and CCUG repeats is important for the development of therapy in DM1 and DM2.
To determine the primary outcomes of CUG/CCUG toxicity, we have developed several tetracycline (Tet)–regulated monoclonal cell culture systems temporarily expressing short and long CUG and CCUG repeats after induction of their transcription with doxycycline (Dox). Using these Tet-regulated CUG/CCUG cell culture systems, we have determined the kinetics of accumulation of long and short CUG/CCUG repeats, foci formation, and CUGBP1 and ZNF9 levels. We also studied the effects of degradation of CUG/CCUG repeats on reversion of ZNF9 reduction and CUGBP1 elevation.
Materials and Methods
Plasmids
Generation of the TRE-GFP-CUG914 plasmid has been described previously.38 To generate TRE-GFP-CTG25 and TRE-GFP-CCTG36 plasmids, complementary oligonucleotides CTG25, CAG25, CCTG36, and CAGG36 were synthesized at Invitrogen (Carlsbad, CA), annealed, and cloned into the EcoRV site of a pTRE-Tight-Bl-AcGFP vector. The resulting sequence of CTG and CCTG repeats was verified by sequencing of the plasmids from both ends. The long CCTG repeat fragment was synthesized by ligation of CCTG10 and CAGG10 fragments, separation of the products of ligation on a gel, elution of the DNA fragment in the position of 1.0 to 1.5 kb and cloning of this fragment into a pcDNA vector. Sequencing of the insert in the resulting plasmid showed that the plasmid contained the desired insert of 300 CCTG repeats. This insert was cut out from the recombinant plasmid in the pcDNA vector and transferred into a pTRE-Tight-Bl-AcGFP vector at the EcoRV site. The different clones of the resulting plasmid were resequenced, producing a plasmid containing a fragment of 100 CCTG repeats, perhaps due to contraction of repeats during cloning. The plasmids in the pTRE-Tight-Bl-AcGFP vector express GFP and CTG/CCTG repeats without additional sequences and are driven by different CMV promoters.
Generation of Double-Stable Inducible Clones
We initially used normal human myoblasts for generation of double-stable cells expressing regulated CUG and CCUG repeats. Pilot experiments showed that normal human myoblasts are very sensitive to geneticin and die within 7 days of treatment. Therefore, we have performed similar experiments with murine C2C12 myoblasts. In contrast to human myoblasts, murine C2C12 myoblast were very resistant to geneticin. After 2 weeks of selection in the medium containing a high concentration of geneticin (450 μg/mL), nontransfected cells survived and continued to divide. However, the selection of rtTA positive clones on the background of the C2C12 myoblasts resulted in many empty clones resistant to antibiotics. Therefore, we generated CUG- and CCUG-regulated stable clones in Chinest Hamster Ovary (CHO) and HeLa cells. The recombinant TRE-GFP-CUGn/CCUGn plasmids were stably transfected into monoclonal, stable CHO and HeLa cells expressing a rtTA activator protein (Clontech, Mountain View, CA) using FuGene. The recombinant plasmids were co-transfected with a plasmid providing hygromycin resistance. Transfected cells were maintained in the medium containing hygromycin B for 10 days. Dox was added to the selected cells (350 ng/mL) in CHO cells and (1 μg/mL) in HeLa cells. GFP-positive cells were identified by fluorescence and separated by flow cytometry in the BCM flow cytometry laboratory. Individual cells with the moderate efficiency of GFP/CUG/CCUG transcription after Dox addition were selected to avoid toxic effects of CUG/CCUG repeats on cell viability. Selected cells were grown to 80% density, expanded, and retested with Dox to determine the regulation of GFP transcription. Monoclonal double-stable cells lines were monitored during 5 to 6 weeks to determine the efficiency of cell growth. The doubling time was similar in the wild-type, stable, and double-stable cells. Induction of GFP/CUG/CCUG expression did not affect cell growth. Light microscopy analysis showed that noninduced and induced cells appeared healthy without rounded cells. The effect of GFP transcription as a possible toxic factor was assessed previously.38 It was shown that GFP expression did not induce significant changes in ph-eIF2 levels in the selected cells, indicating that the cells were not under stress.38
Northern Blot Assay
CUG/CCUG transcription in stable individual cell lines was induced with Dox and total RNA was collected at different time points. RNA was extracted with TriZol and the integrity of RNA was examined by gel electrophoresis and staining of RNA with ethidium bromide. The RNA (12 μg) was denatured in a buffer containing urea, separated on the native agarose gel and transferred onto a nitrocellulose membrane. The membrane was hybridized with 32P-CAG7 or 32P-CAGG7, as previously described.38
Western Blot Assay
Cytoplasmic and nuclear extracts were prepared from induced and noninduced cells according to the protocol described previously.11, 12 A 20- to 50-μg quantity of protein was separated by polyacrylamide gel electrophoresis (PAGE), transferred onto a membrane and probed with antibodies to CUGBP1 (3B1), C/EBPβ, and p21 (all from Santa Cruz Biotechnology, Santa Cruz, CA), polyclonal antibodies to ZNF929 and monoclonal antibodies to β-actin (Sigma-Aldrich, St. Louis, MO).
Stability of CCUG Repeats
To determine the half-life of short and long CCUG repeats, the TRE-GFP-CCUG constructs were transiently transfected into Tet-Off CHO cells together with a construct expressing β-globin mRNA using FuGene (Invitrogen, Carlsbad, CA). The efficiency of transfection was determined by examination of GFP signal. Plates with similar efficiency of transfection were used. Twenty-four hours after transfection, Dox was added to block transcription of CCUG RNAs, and RNA samples were collected at different time points after Dox addition. Denatured RNA (15 μg) was separated on an agarose gel, transferred onto nitrocellulose and probed with CAGG7 and β-globin probes.
Fluorescence in Situ Hybridization
A single pulse of CUG and CCUG transcription was induced with Dox and cells were fixed with 3.7% formaldehyde in PBS at different time points after the transcription pulse. Fixed cells were prehybridized in a solution of 40% formamide and 2 × SSC for 10 minutes at 37°C, followed by hybridization for 1 hour at 37°C. The hybridization mix contained 40% formamide, 4 × SSC, 1 mg/mL tRNA, salmon sperm DNA (200 μg/mL), 0.2% BSA, 2 mmol/L vanadyl guanoside, and 0.5 μg/mL CAG15 or CAGG12 labeled with Alexa555. The percentage of cells containing CUG/CCUG aggregates was determined based on the microscopic analysis of 200 to 500 cells for each time point, using the same conditions for time of exposure and brightness, based on at least three experiments. Images of foci accumulation in CHO cells were taken at brightness 10 times higher than those in HeLa cells.
To determine the portion of cells with nuclear and cytoplasmic CUG/CCUG foci, randomly selected cells (50 cells for each time point) were analyzed by fluorescent microscopy. Both large and small foci were counted. The analysis was repeated three times to determine the average value. Thus, 150 cells (50 × 3) for each time point and for each cell line (CHO-CUG914, CHO-CUG25, HeLa-CUG25, CHO-CCUG36, CHO-CCUG100, HeLa-CCUG36, and HeLa-CCUG100) were analyzed. Foci-positive cells have been divided in three categories: i) cells containing preferentially nuclear foci, ii) cells containing preferentially cytoplasmic foci, and iii) cells with equal number of foci in nuclei and in cytoplasm. Cells in group 1 included cells with foci only in nuclei and cells containing at least twofold more nuclear than cytoplasmic foci. Cells in group 2 included cells with foci only in cytoplasm and cells containing at least twofold more cytoplasmic foci than nuclear foci. Foci in cells with equal number of foci in nuclei and in cytoplasm were carefully counted three times. Cells with diffused CUG/CCUG signals were excluded from the count.
Real-Time RT–PCR
The first-strand cDNA was synthesized using 100 ng of total RNA with SSIII reverse transcriptase (Invitrogen, Carlsbad, CA). Real-time PCR was performed with SYBR Green PCR Master Mix (ABI) and two sets of primers specific for human ZNF9 in the StepOne Real-Time PCR System (ABI) according to the manufacturer's recommendations. The set #1 of ZNF9 primers includes primers with the following sequences: forward, 5′-GACCATGCAGATGAGCAGAA-3′ (exon 4) and reverse, 5′-TTGCTGCAGTTGATGGCTAC-3′ (exon 5). The sequences of ZNF9 primers in the set #2 (from exon 4) are as follows: forward, 5′-TGCTACAACTGTGGCAAACC-3′ and reverse, 5′-TGTCCGAATTCTCCACAAGA-3′. Assays were performed in duplicate. Each experiment was repeated two to four times. The results of quantitative real-time PCR were analyzed by the comparative threshold cycle (CT) method and normalized by comparison to GAPDH signals used as an internal control. The sequences of human GAPDH primers are as follows: forward primer 5′-CAATGACCCCTTCATTGACC-3′ and reverse primer 5′-TTGATTTTGGAGGGATCTCG-3′.
Results
Analysis of Dox-Dependent Regulation of Transcription of Short and Long CUG Repeats in “Tet-On” Monoclonal Cell Lines
The structure of the construct expressing CUG914 RNA was previously described.38 A similar construct for the regulated expression of short CUG repeats (CUG25) was also generated (Figure 1A). We applied Northern blot analyses to compare the kinetics of CUG25/914 accumulation in CHO double-stable cells after a single pulse of transcription. Our previous work with CUG-inducible CHO cells showed that the levels of CUG914 RNA at 17 to 24 hours after Dox addition are similar to the levels of the mutant DMPK mRNA in human myoblasts from the patient with DM1.38 Comparison of CUG914 and CUG25 expression on the same gel indicated that the efficiency of CUG25 RNA expression was significantly higher than that of CUG914 RNA (Figure 1B). Although the accumulation of CUG914 was barely visible at 7 hours after Dox addition, the signals of CUG25 at this time point were very strong. To examine CUG914 expression during the initial period after Dox addition (0 to 6 hours), fluorescence in situ hybridization (FISH) hybridization with CAG probe was performed. We found that, at 3 and 6 hours after Dox addition, CUG-positive aggregates could be detected in small number of cells (approximately 2% to 4%) after maximal exposure (data not shown). This result suggests that the accumulation of CUG repeats in this cell line during 0 to 6 hours after Dox addition is very low, making it difficult to quantify. The accumulation of CUG914 RNA began at 7 hours after Dox addition (Figure 1B). Therefore, we refer to this time point as the earliest stage of the detectable accumulation of the mutant CUG repeats. A similar result was observed by other groups in Tet-inducible systems.39 The CUG914 signal was increased during 17 to 24 hours after Dox addition and then reduced at 48 hours. Examination of the kinetic of CUG25 RNA expression at the same time points by the Northern blot assay showed that the signals of CUG25 were strong at 7 to 24 hours after Dox addition and then were reduced at 48 hours (Figure 1B). Strong signal of CUG25 at 7 hours after Dox addition prompted us to measure the kinetic of CUG25 accumulation during 0 to 6 hours after Dox addition. We found that CUG25 RNA was already detectable in 1 hour after Dox addition and the signal continued to increase during the next 6 hours (Figure 1C). We suggest that the high efficiency of CUG25 expression in this cell line allowed detection of CUG25 in 1 hour after Dox addition, although significantly weaker expression of CUG914 led to detection of long repeats at 7 hours after induction of transcription. The reason for the differences in the Tet-on expression of CUG25 and CUG914 is unknown. A similar result was described by Mahadevan et al,24 in which the Tet-regulated expression of the 3′ UTR from normal DMPK mRNA containing five CUG repeats resulted in high levels of RNA expression in a murine model, but a DMPK 3′ UTR containing 200 CUG repeats driven by the same promoter showed very weak expression. One possible explanation for these results is that the long repeats might have a negative effect on the efficiency of transcription.
Figure 1.
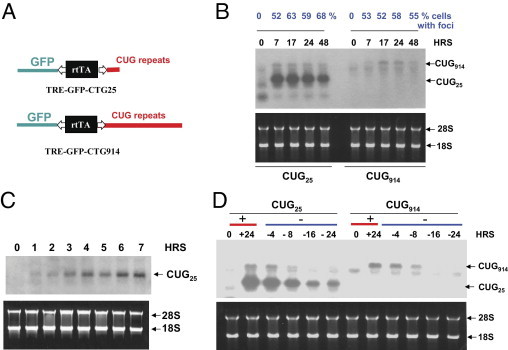
Dox-dependent regulation of transcription and decay of CUG25 and CUG914 transcripts in Tet-On double-stable monoclonal CHO cells. A: Diagram shows the structure of constructs used for generation of CUG25 and CUG914 Tet-regulated monoclonal cells. B: Comparison of kinetics of the accumulation of CUG25 and CUG914 in CHO cells after a single pulse of transcription of CTG25 and CTG914 with Dox. Upper panel shows the results of Northern blotting using CAG7 probe. The time points for the collection of RNA after Dox addition are shown on the top in black. Lower panel shows ethidium bromide staining of the analyzed RNAs. The percentage of cells containing CUG-positive aggregates (Fig. 2) are shown on the top in blue. C: Kinetic of the accumulation of CUG25 at early time points after Dox addition. Upper panel shows the results of the Northern blot analysis. Lower panel shows the ethidium bromide staining of the gel. Positions of CUG25 RNA and ribosomal 28S and 18S RNAs are shown by arrows. D: Kinetics of CUG25 and CUG914 RNA decay after a pulse of transcription during 24 hours determined by Northern blot assay (upper panel) are shown. Lower panel shows ethidium bromide staining of the analyzed RNAs.
To determine whether removal of Dox from the growth medium abolishes transcription of CUG repeats, we examined the levels of CUG25 and CUG914 at 24 hours after a single pulse of transcription and after withdrawal of Dox from the growth medium. Transcription of CUG25 and CUG914 is induced at 24 hours after Dox addition, whereas the removal of Dox after 24 hours after a pulse of transcription reduces the levels of both CUG25 and CUG914 (Figure 1D). The reduction of the levels of short and long CUG repeats is detectable at 4 hours after Dox withdrawal leading to complete disappearance of CUG914 RNA at 16 to 24 hours after Dox removal. Under the same conditions, Dox withdrawal significantly reduced the levels of CUG25 but could not completely eliminate the repeats, most likely due to the higher efficiency of CUG25 transcription compared with that of CUG914 (Figure 1D). These studies demonstrated that transcription of CUG25 and CUG914 RNAs can be manipulated by Dox addition and withdrawal. Importantly, the CUG914 cell model allows the accumulation of repeats after a single pulse of transcription without overexpression of repeats. Thus, these generated inducible cell lines can be used to study the kinetics of the accumulation of CUG RNA, formation of CUG foci, and CUGBP1 levels.
Accumulation of Low Levels of CUG914 RNA Results in Nuclear and Cytoplasmic Foci
In DM1 cells, DMPK mRNA with expanded CUG repeats (more than 50) aggregates and forms nuclear foci.40, 41 Formation of RNA aggregates is one of the hallmarks of CUG toxicity in DM1. Using the generated Tet-regulated cell lines, we examined whether the formation of CUG foci is an early event of the accumulation of CUG RNA. We analyzed the kinetics of foci formation in CUG914-inducible cells after a single pulse of transcription using FISH assay. The cells with CUG aggregates were counted under the same conditions of brightness and time of exposure to ensure quantification of the signal. As is shown in Figure 2A, no aggregation of CUG914 foci was observed before addition of Dox (time 0). At 3 and 6 hours after Dox addition foci were detectable in a few cells at maximal exposure, but they were not visible under conditions used to quantify foci-positive cells at later time points (data not shown). At 7 hours after Dox addition (when CUG914 RNA was barely detectable by the Northern blot assay, Figure 1B), approximately half of the cells (53%) showed CUG signals in the aggregated form in both nuclei and cytoplasm. It should be noted that some cells contained CUG signal in aggregated and diffused forms. The number of cells containing CUG914 aggregates remained at approximately similar levels at 17 to 24 hours after Dox addition.
Figure 2.
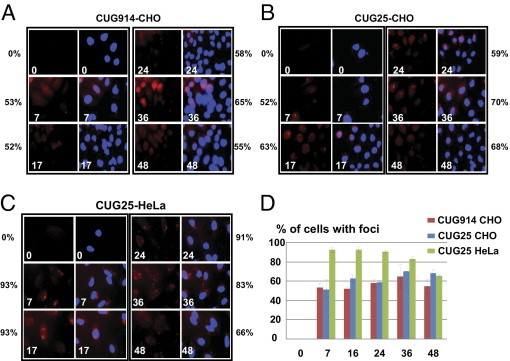
Kinetics of accumulation of foci after transcription pulses of CUG25 and CUG914 RNAs. Kinetics of aggregation of CUG914 (A) and CUG25 (B, C) RNAs after transcriptional pulse in CHO cells (A, B) and in HeLa cells (C) determined by FISH assay are shown. Numbers on images indicate time points (in hours) after Dox addition. Nuclei are stained with DAPI. Percentage of cells containing aggregated CUG914 and CUG25 RNAs at different time points after Dox addition are also shown. P values in A are 0.006077, 0.00077, 0.003842, 0.034503, and 0.17524 for 7, 17, 24, 36 and 46 hours, respectively. P values in B are 0.013575, 0.001341, 0.000608, 0.000272, and 0.001151 for 7, 17, 24, 36 and 48 hours, respectively. P values in C are 0.000243, 0.000477, 9.61, 0.000193, and 0.000175 for 7, 17, 24, 36 and 48 hours, respectively. View is 60×. Images in A and B were taken at brightness 10-fold higher than in C to compensate for a weaker signal in CHO cells. D: Diagram shows the percentages of cells accumulating CUG-positive aggregates in the CUG914 and CUG25-expressing CHO and HeLa cells after a single pulse of transcription. X denotes hours after Dox addition. Y denotes percentage of cells containing CUG-positive aggregates (including nuclear and cytoplasmic foci) based on the analysis of 200 to 500 cells for each time point as an average of three experiments.
The number of cells containing CUG aggregates at 36 and 46 hours was not reduced (65% for 36 hours and 55% for 48 hours) (Figure 2A). This was surprising, because the intensity of CUG914 RNA signal in the Northern blot assay is reduced at 28 to 48 hours after single transcription pulse38 (Figure 1B for 48 hours) due to degradation of CUG914 RNA. This result was reproducible and statistically significant (with P values 0.03 and 0.02 for 36 and 48 hours, respectively). One possible explanation for this result is that long repeats bind to additional proteins during partial decay of CUG914, increasing the number of foci. It is also possible that the products of degradation of CUG914 contributes to CUG aggregation.
Accumulation of High Levels of Short CUG Repeats Leads to Foci Formation
To examine the possibility that high levels of short CUG repeats may also aggregate, we have analyzed foci formation in CUG25-inducible cells. We found that CUG25-expressing cells do indeed contain CUG-positive nuclear and cytoplasmic aggregates similar to CUG914-expressing cells. A pulse of transcription of CUG25 caused foci formation in 52% of cells at 7 hours after Dox addition (Figure 2B). At 17 hours, 63% of cells contained foci and at 24 hours 59% of cells showed foci formation. The number of cells with foci was even higher at 36 and 48 hours after Dox addition (70% and 68% for 36 hours and for 48 hours, respectively). Although we do not know how CUG25 RNA containing normal-sized CUG repeats form aggregates, we speculate that this could arise from high levels of expression of CUG25. The presence of CUG aggregates in CUG25-regulated CHO cells was independent of cell origin. Similar accumulation of foci was observed in HeLa cell lines expressing regulated CUG25 RNA (Figure 2C). As seen in Figure 2C, the percentage of cells with aggregates in HeLa CUG25-induced cells (cell line 13) was 93% at 7 hours after Dox addition and remained high during the course of accumulation of repeats (93% for 17 hours and 91% for 24 hours). The number of cells with foci was reduced at 36 and 48 hours after Dox addition (83% and 66% respectively). It is important to note that the brightness of foci was greater in HeLa cells relative to CHO cells. Note that images of the CHO cells were taken at brightness 10-fold higher than that in Hela cells to compensate for the weak CUG signal in CHO cells. As expression of CUG25 in both CHO and HeLa cells was comparable (data not shown), we suggest that CUG foci might be more stable in human cells than in rodent cells. Because CUG25 RNA was detectable by Northern blot assay within 1 to 6 hours after Dox addition (Figure 1C), we examined possible foci formation by CUG25 RNA at 3 to 6 hours after Dox addition. At these time points, foci were observed after maximal exposure, but they were not visible under conditions used to quantify foci at later time points (data not shown).
The mutant CUG RNA might be completely trapped in nuclei. In CUG914-inducible clones however, we observed CUG-positive aggregates in both nuclei and cytoplasm (Figure 2). The relative number of cells with nuclear and cytoplasmic foci was quantified as described in Materials and Methods. These calculations show that both compartments contain CUG foci (Figure 3). High levels of short CUG repeats also led to the formation of nuclear and cytoplasmic foci (Figure 3).
Figure 3.
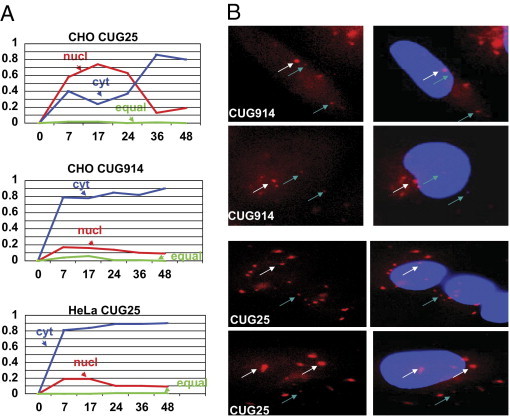
The kinetics of the accumulation of short and long CUG repeats in the nuclei and in cytoplasm. A: Number of cells with the preferentially nuclear and cytoplasmic foci was determined after the single transcription pulse of CUG914 and CUG25 RNAs as described in Materials and Methods. X shows time points (hours) after Dox addition at which cells with the CUG-positive foci in the nuclei and in cytoplasm were counted. Y shows the ratios of the number of cells with nuclear (red), cytoplasmic (blue), or equal number of foci (green) relative to the total number of cells with foci counted as 1. Small and large foci (shown in B by arrows) were counted to determine the portion of the cells with preferentially nuclear and cytoplasmic foci. B: Magnified images (×100) of the CUG914 and CUG25 foci in CHO cells are shown. White arrows point to large foci, whereas blue arrows point to small foci.
Taken together, the analysis of foci in CUG-regulated cell lines showed that low levels of CUG914 RNA are sufficient for aggregation, and that the aggregation of CUG RNA is a primary outcome of the accumulation of CUG repeats. High levels of short repeats also led to aggregation. This result shows that foci could be formed not only after accumulation of the mutant CUG repeats but also by high levels of short repeats. The lack of CUG foci in normal cells relative to DM1 cells could be explained by the short repeat and by the normal level of expression of DMPK transcripts.
CUGBP1 Elevation Is a Primary Event of the Accumulation of the Mutant CUG Repeats
Previous reports have shown that CUGBP1 levels are increased in DM1 patients.18, 20, 24 It has also been shown that long CUG repeats degrade, resulting in the accumulation of short CUG repeats detectable in DM1 cells.42 Because the accumulation of short CUG repeats causes the DM1 phenotype in DM1 murine models,24 we decided to determine whether high levels of short CUG repeats would elevate CUGBP1. Analysis of CUGBP1 expression after a single pulse of transcription of CUG25 showed that CUGBP1 is elevated in cytoplasm at 7 hours after Dox addition (Figure 4A). CUGBP1 levels continued to grow in cytoplasm of CHO cells during 7 to 48 hours after Dox addition. In the nuclei, CUGBP1 was also increased at 7 hours after Dox addition. The levels of nuclear CUGBP1 were increased further at 17 hours, with a slight reduction at 24 to 48 hours.
Figure 4.

Fast increase of CUGBP1 by long CUG repeats occurs simultaneously with early accumulation of foci. A: Western blot. The increase of CUGBP1 in nuclei and cytoplasm is early event of the accumulation of high levels of CUG25. The β-actin signal shows the loading of proteins. B and C: High levels of CUG25 gradually increase cytoplasmic CUGBP1 (B) whereas low levels of CUG914 (C) rapidly elevate CUGBP1 to high levels leading to the strong elevation of expression of CUGBP1 translational target C/EBPβ. CUGBP1 levels were determined by Western blot assay and filters were re-probed with antibodies to C/EBPβ and β-actin as control for loading. The percentage of cells containing aggregated CUG repeats are shown on the top in blue. D: Accumulation of RNA CUG foci and elevation of CUGBP1 are primary events of CUG toxicity. X represents hours after transcription pulse with Dox. Y1 (left) represents percentage of CHO cells with CUG-positive foci determined as described in Figure 2A and B after transcription pulse of CUG914 (red) and CUG25 (red, punctuated). Y2 (right) shows the fold of increase of CUGBP1 calculated as ratio of the intensities of the CUGBP1 signal to the intensities of β-actin signal after transcription pulse of CUG914 (blue) and CUG25 (blue, punctuated). E: Kinetics of the CUGBP1 elevation in the CHO CUG25 and CUG914-expressing cell lines at the early time period (1 to 7 hours) after Dox addition. Numbers on the top show the time points (in hours) for protein collection. After detection of CUGBP1, the membranes were re-probed with antibodies to β-actin as control for the protein loading. Numbers on the bottom show the ratio of the CUGBP1 signal to β-actin. F: Degradation of CUG25 and CUG914 after Dox withdrawal corrects CUGBP1 and the levels of its translation target, C/EBPβ. CUGBP1, C/EBPβ, and β-actin levels were determined by Western blotting after accumulation (for 24 hours) and during decay of CUG25 and CUG914 RNAs. Transcription of CUG25 and CUG914 was induced with Dox as described in Figure 1D, and Dox was withdrawn after 24 hours. Proteins were isolated at different time points of accumulation and degradation of short and long CUG repeats and were analyzed by Western blot assay with antibodies shown on the right. G: Diagrams show kinetics of elevation and normalization of CUGBP1 and C/EBPβ proteins after transcription pulses and degradation of CUG25 (red) and CUG914 (blue). X represents hours after Dox addition (+) and Dox withdrawal (−). Y represents fold of CUGBP1 and LIP+LAP increase after adjustment to β-actin.
We found that both high levels of short and low levels of long CUG repeats increase CUGBP1 at 7 hours after Dox addition; however, the kinetic of CUGBP1 increase by long CUG repeats was faster relative to that mediated by short CUG repeats. Accumulation of CUG25 gradually elevated CUGBP1 during 7 to 48 hours (Figure 4B). In contrast, low levels of CUG914 (7 hours after Dox addition) increased CUGBP1 to a higher level that remained elevated during 7 to 48 hours of CUG914 expression (Figure 4C). Levels of CUGBP1 were higher at later time points in cells expressing CUG25 than in cells expressing CUG914, perhaps because of a significantly higher level of CUG25 expression relative to levels of CUG914 (Figure 1B). Although Figure 4 shows data acquired with CHO clones, the rapid increase of CUGBP1 in response to the accumulation of CUG repeats was independent of cell origin and was identical in HeLa cell stable clones (data not shown). Taken together, these data show that, similar to low levels of long CUG repeats (CUG914), high levels of CUG repeats of normal size (CUG25) led to elevation of CUGBP1. However, long CUG repeats increased CUGBP1 more rapidly than high amounts of short CUG repeats.
To determine whether foci accumulation after transcription pulse of CUG25 and CUG914 RNAs precedes CUGBP1 increase, we compared the kinetics of the elevation of CUGBP1 with the accumulation of CUG-positive aggregates (Figure 4D). A sharp increase of CUGBP1 at 7 hours after transcription pulse of CUG914 occurred simultaneously with accumulation of CUG foci. CUGBP1 was also elevated in the CUG25-expressing cells simultaneously with foci accumulation but was slower than in the CUG914-expressing cells (Figure 4D). Because low-intensity foci could be detected in some CUG25/914-expressing cells after maximal exposure at 3 and 6 hours after Dox addition, we measured CUGBP1 levels during this period by Western blot assay. As one can see in Figure 4E, CUGBP1 was increased at 2 to 6 hours after Dox addition in CUG25-expressing cells; however, the elevation of CUGBP1 in CUG914-expressing cells was observed 1 hour early (1 to 6 hours). Thus, CUGBP1 elevation in CUG25/914-accumulating cells occurs before build-up of CUG aggregates. These data show that the increase of CUGBP1 is a primary event. The lack of delay of the CUGBP1 increase after CUG foci accumulation suggests that these two events are independent.
It is expected that an increase of CUGBP1 by CUG repeats should affect biological functions of CUGBP1. One of the functions of CUGBP1 is regulation of translation. We found that a single pulse of transcription of long CUG repeats was sufficient to elevate CUGBP1 and to strongly increase translation of one of CUGBP1's translational targets, CCAAT/enhancer binding protein β (C/EBPβ).38 C/EBPβ is an intronless gene, but a single C/EBPβ mRNA produces three isoforms: FL (full-length) C/EBPβ, C/EBPβ-LAP (an activating isoform), and C/EBPβ-LIP (an inhibiting isoform).43 Several reports have shown that CUGBP1 bound to the 5′ region of C/EBPβ mRNA and increased translation of C/EBPβ.44, 45 We compared the effects of high levels of short CUG repeats and low levels of long CUG repeats on C/EBPβ expression. Western blotting assay in stable clones with short and long CUG repeats showed that the elevation of CUGBP1 by CUG repeats at 7 hours after Dox addition increased translation of all isoforms of C/EBPβ (Figure 4, B and C). However, the kinetics of the elevation of C/EBPβ by short and long CUG repeats differed. Although the increase of CUGBP1 by the pulse of CUG25 transcription gradually increased the C/EBPβ-FL, C/EBPβ-LIP, and C/EBPβ-LAP isoforms (Figure 4B), CUG914 rapidly elevated the FL, LAP, and LIP isoforms to high levels, correlating with a sharp increase of CUGBP1 in response to the accumulation of CUG914 RNA at 7 hours after Dox addition (Figure 4C). Thus, similar to long CUG repeats, high levels of short CUG repeats elevated CUGBP1 and increased translation of C/EBPβ.
To determine whether CUGBP1 elevation can be corrected by the degradation of CUG repeats, we induced CUG25 and CUG914 with Dox and then allowed CUG25 and CUG914 RNAs to degrade by removing Dox from the growth medium. Examination of CUGBP1 in these cells showed that CUGBP1 was strongly elevated by CUG25 and CUG914 at 24 hours after Dox addition and that its levels were significantly reduced in 4 hours after Dox withdrawal (Figure 4, F and G). In agreement with the normalization of CUGBP1 levels, degradation of long and short CUG repeats resulted in the normalization of the levels of short C/EBPβ isoform, LIP (Figure 4, F and G). The levels of the FL-C/EBPβ and LAP isoform were also normalized by Dox withdrawal in CUG25-expressing cells (Figure 4, F and G). However, in CUG914-expressing cells, Dox withdrawal did not change the levels of the FL-C/EBPβ and LAP isoform, perhaps because of a strong increase of C/EBPβ in the CUG914-inducible cells. In contrast, LIP levels were normalized in these cells but at later time points (16 and 24 hours) after Dox withdrawal (Figure 4F). Thus, degradation of CUG repeats corrected CUGBP1 levels and normalized translation of CUGBP1 targets.
Dox Regulates Expression of CCUG36 and CCUG100 RNA Repeats in Stable Clones
CCUG repeats are expanded in DM2 patients and cause DM2 pathology. To investigate primary targets of CCUG repeats, we generated Tet-regulated CCUG36 and CCUG100 monoclonal cell lines in both CHO and HeLa cells using constructs described in Figure 5A. The regulation of transcription of CCUG repeats in these cells after Dox addition was examined by Northern blot assay. This analysis showed that the expression of CCUG36 and CCUG100 transcripts was comparable (Figure 5B). Because the expression of CCUG36 and CCUG100 RNAs was also comparable to the levels of CUG914, we used the same time points to examine the kinetics of the accumulation of these repeats. CCUG36/100 repeats were detected by Northern blot assay at 7 hours after Dox addition. The levels of CCUG36 transcripts were increased at 17 to 24 hours after Dox addition and were slightly reduced at 48 hours. The levels of CCUG100 transcripts were increased at 17 hours after transcription pulse and were reduced at 24 to 48 hours (Figure 5B). Removal of Dox from the growth medium after a 24-hour pulse of transcription in the CCUG100 cells reduced the CCUG100 signal at 8 hours after Dox removal (Figure 5C). CCUG100 RNA was undetectable at 16 to 24 hours after Dox removal. These data show that our generated stable clones expressing CCUG36 and CCUG100 repeats are appropriate systems for the study of primary targets of expanded RNA CCUG repeats.
Figure 5.
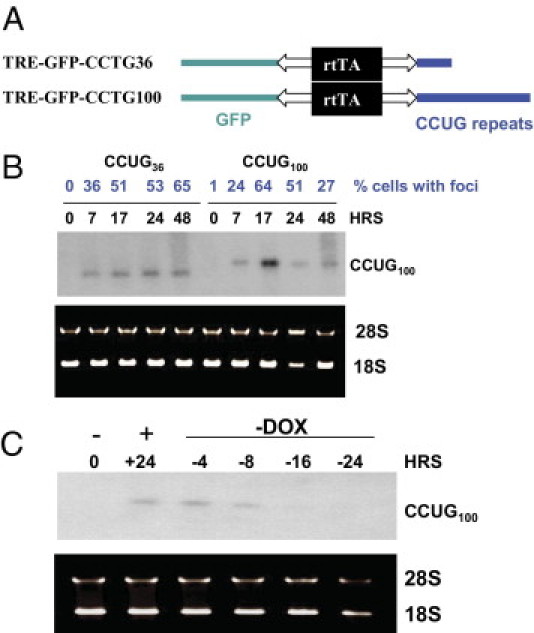
Regulation of transcription of CCUG36 and CCUG100 RNAs in monoclonal Tet-On cell cultures. A: Diagram shows the structure of TRE-GFP CCUG36 and CCUG100 constructs. B: Induction of short and long CCUG repeats after transcription pulse. Total RNA was collected from the double-stable CHO cells at 0, 7, 17, 24, and 48 hours after Dox addition and examined by Northern blot assay with 32P-CAGG10 probe. The number of cells with foci, described in Figure 6, are shown in blue on the top. RNA was stained with EtBr before transfer to nitrocellulose filter to evaluate quantity and quality of RNA. C: CCUG repeats degrade after Dox withdrawal. Northern blot analysis of CCUG100 RNA isolated from double-stable CHO cells after induction with Dox (+) and Dox withdrawal (−). Time points (in hours) at which RNA was extracted are shown on the top. Positions of RNA CCUG100 and 28S and 18S RNAs are also shown.
Pulses of Transcription of CCUG36 and CCUG100 Lead to Formation of Nuclear and Cytoplasmic Foci
Similar to the analysis of CUG-positive foci described above, we have examined the kinetics of the formation of CCUG foci in CCUG100-inducible cells. We found that, in CHO cells, even small amounts of CCUG100 repeats form foci at 7 hours after Dox addition (Figure 6A). We have also measured the formation of CCUG foci at 3 hours after Dox addition; however, only weak CCUG signal could be detected after overexposure of the images (data not shown). At 7 hours after Dox addition, approximately 24% of cells showed accumulation of CCUG-positive aggregates (Figure 6A). The number of CCUG-positive aggregates increased at 17 hours after Dox addition and then gradually reduced from 51% to 27% during 24 to 48 hours. Thus, the number of cells with CCUG-foci in CHO monoclonal CCUG100 line correlated with the kinetic of the accumulation and degradation of the mutant CCUG RNA measured by the Northern blot assay.
Figure 6.
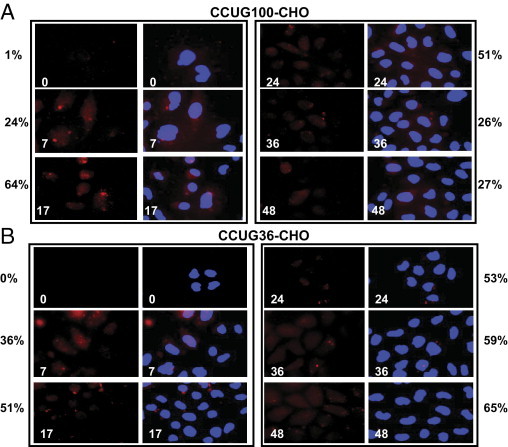
Kinetics of aggregation of CCUG100 and CCUG36 RNAs after transcription pulses in Tet-On CHO monoclonal cell lines. Foci formed by long (A) and short (B) CCUG repeats were detected by FISH assay with CAGG probe (red). Nuclei were stained with DAPI (blue). Images of FISH and overlay of FISH with DAPI staining are shown. Images were taken at brightness 10-fold higher than in Figure 7 to compensate for a weaker signal in CHO cells. Numbers on images (shown in white) indicate time points after Dox addition. Percentage of cells containing aggregated CCUG100 and CCUG36 RNAs at different time points after Dox addition are displayed adjacent to corresponding time point. P values in A are 0.033356, 0.000392, 0.13575, 0.38821, and 0.124414 for 7, 17, 24, 36, and 48 hours, respectively. P values in B are as follows: 0.099972, 0.043283, 0.010648, 0.019951, and 0.039285 for 7, 17, 24, 36, and 48 hours respectively.
Short CCUG repeats also aggregated if expressed at high levels (Figure 6B). This aggregation was observed when the CCUG RNA signal was relatively weak. The number of cells with foci in the CCUG36-induced cells was increased during 36 to 48 hours in the CHO cell line, despite the fact that the signal of CCUG36 RNA was slightly reduced at 48 hours after Dox addition (Figure 5B). The increase of cells with foci in the CCUG36 line was reproducible and statistically significant, with P values 0.02 and 0.039 for 36 and 48 hours, respectively.
The number of cells with CCUG-positive foci was greater in the HeLa CCUG100 line than in the CHO line. In HeLa double-stable cells, 80% to 81% of cells contained foci at 7 and 17 hours and almost all cells (95% to 98%) accumulated CCUG-positive foci during 24 to 48 hours after Dox addition (Figure 7A). The number of cells with foci was also increased at 36 to 48 hours after Dox addition in the CCUG36-regulated HeLa monoclonal line (with P values 0.0087 and 0.00007 for 36 and 48 hours, respectively) (Figure 7B).
Figure 7.
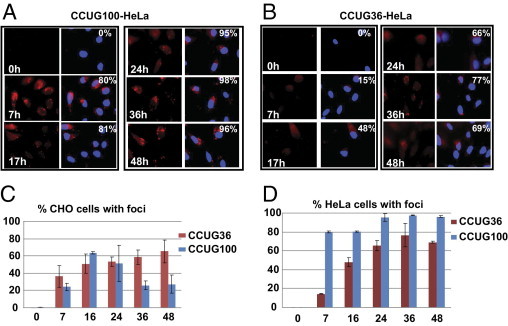
Kinetics of aggregation of CCUG100 and CCUG36 RNAs after transcription pulse in HeLa cells. Images of FISH hybridization of Tet-regulated CCUG100 (A) and CCUG36 (B) using CAGG probe are shown. View is ×60. C and D: Diagrams show percentages of cells accumulating CCUG-positive aggregates in the CCUG100- and CCUG36-expressing CHO (C) and HeLa (D) cells after a single pulse of transcription. X represents hours after Dox addition. Y represents percentage of cells containing CUG-positive aggregates (including nuclear and cytoplasmic foci) based on the analysis of 200 to 500 cells for each time point. P values in A are as follows: 5.12E-05 (7 hours), 1.29E-05 (17 hours), 0.00059 (24 hours), 8.77E-06 (36 hours), and 3.62E-05 (48 hours). P values in B are 0.000396, 0.003597, 0.002342, 0.008783, and 0.00007 for 7, 17, 24, 36, and 48 hours, respectively.
Similar to intracellular distribution of foci in CUG-expressing cells, CCUG-containing foci were observed in nuclei and in cytoplasm, suggesting that CCUG100 RNA migrates from the nucleus to the cytoplasm, ultimately aggregating in both (Figure 8).
Figure 8.
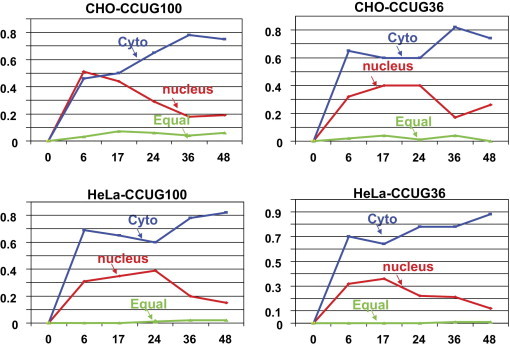
Kinetics of the accumulation of cells with nuclear and cytoplamic foci in CCUG-regulated cell lines. Number of cells with preferentially nuclear and cytoplasmic foci was determined after the single transcription pulse of CCUG100 and CCUG36 RNAs as described in Materials and Methods. X shows time points (hours) after Dox addition at which the distribution of RNA foci in the nuclei and cytoplasm was determined. Y shows ratios of the cells with nuclear foci (red), cytoplasmic foci (blue), or equal number of foci (green) to the total number of cells, with foci counted as 1.
Thus, we conclude the following: i) the low levels of the mutant CCUG100 repeats are sufficient to cause foci formation; ii) CCUG foci are formed in the nuclei and in cytoplasm; and iii) short CCUG repeats also aggregate if expressed at high levels. The increase of cells with foci during the period of time when partial degradation of the CCUG36 RNA occurs suggests that either the products of CCUG36 degradation might interact with other proteins, thereby increasing the number of aggregates, or that the products of CCUG36 degradation might aggregate.
CCUG RNA Repeats Are Stable in Inducible Cell Lines
Intronic CCUG repeats accumulate in DM2 cells after intron excision.34 This accumulation is quite unusual, as introns normally degrade within several minutes after splicing. High aggregation of pure CCUG100 in the Tet-inducible cell line after a transcription pulse also suggested that pure CCUG repeats have increased stability (Figure 6, Figure 7). To examine the decay of the CCUG36 and CCUG100 repeats, we have compared stability of these repeats with the stability of β-globin mRNA, which is recognized as a very stable transcript. To achieve this goal, we have transiently co-transfected two constructs, TRE-GFP-CCUG and pTet-BBB (containing β-globin),46, 47 in Tet-Off CHO stable cells under conditions providing moderate expression of CCUG repeats and β-globin to avoid saturation of cells with transfected RNAs. Control experiments showed that, in CHO Tet-Off cells, transcription of ectopic CCUG repeats and β-globin is rapidly silenced by the addition of Dox; therefore, detection of CCUG and β-globin RNAs after halt of transcription reflects the stability of these transcripts. The stability of CCUG36/100 RNAs was determined by Northern blot analysis of RNAs collected at different time points after silencing of CCUG transcription. The stability of β-globin was determined as an example of highly stable mRNA. In these cells, the half-life of both CCUG36 and CCUG100 is similar to that of β-globin mRNA, showing that pure CCUG repeats are very stable (Figure 9).
Figure 9.
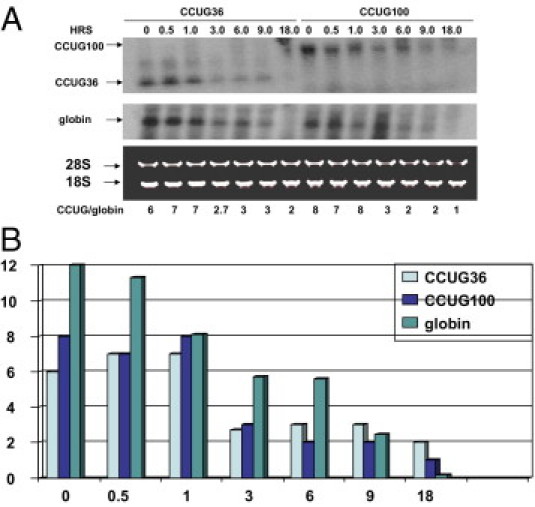
Stability of short and long CCUG repeats. A: Decay of CCUG36 and CCUG100 RNAs in CHO Tet-Off cells determined by Northern blotting. Time points for RNA collection after inhibition of CCUG transcription are shown on the top. CCUG36 and CCUG100 were co-transfected with β-globin as control. After hybridization with CAGG probe, the membrane was re-probed with the β-globin probe. Positions of CCUG36, CCUG100, and β-globin are shown by arrows on the left. Because the transfected plasmid (TRE-CCUG-GFP) also expressed GFP from an independent promoter, the efficiency of transfections was calculated by monitoring green cells. Plates with identical efficiency of transfections were used for experiments. Staining of 18S and 28S ribosomal RNAs shows equal loading of RNA. B: Bar graphs show the half life of the CCUG transcripts β-globin (after adjustment of intensities of CCUG repeats and β-globin to intensity of 18S RNA) as a summary of three independent experiments. X shows time (in hours) after silencing of CCUG transcription. Y shows ratios of intensities of β-globin and CCUG36/100 signals adjusted to the 18S RNA signal.
ZNF9 Reduction and CUGBP1 Elevation Are Early Events in CCUG Toxicity
It has been shown that RNA CCUG repeats have a complex effect on cell biology. One of the critical alterations in DM2 muscle is the reduction of protein levels of ZNF9.29, 31, 48 However, the role of CCUG repeats in the reduction of ZNF9 levels requires additional investigation as some patients with DM2 show reduction of ZNF9, but others do not.29, 31, 34, 48, 49 The analysis of CUGBP1 levels in DM2 also provides controversial results, showing an increase of CUGBP1 in muscle biopsies from some DM2 patients and no changes of CUGBP1 in other patients with DM2.31, 35, 48 To examine whether low levels of CCUG repeats target ZNF9 and CUGBP1, we analyzed the effect of a single pulse of transcription of short and long CCUG repeats on ZNF9 and CUGBP1 levels.
Examination of CUGBP1 in CCUG-inducible cells showed that CUGBP1 is rapidly elevated by low levels of CCUG repeats (Figure 10, A and B). Accumulation of small amounts of both short and long CCUG repeats at 7 hours after Dox addition elevated CUGBP1. In agreement with the elevation of CUGBP1 levels, its translational target, C/EBPβ, was also increased after a transcription pulse of CCUG repeats. CCUG36 RNA elevated C/EBPβ-LAP and C/EBPβ-LIP at 17 hours after Dox addition, whereas CCUG100 increased LAP and LIP at 24 hours (Figure 10A). This difference in the timing of increase of LAP and LIP agrees with the more rapid elevation of CUGBP1 by CCUG36 RNA. Thus, in contrast to CUG repeats, high levels of short CCUG repeats elevated CUGBP1 more rapidly than long CCUG repeats.
Figure 10.
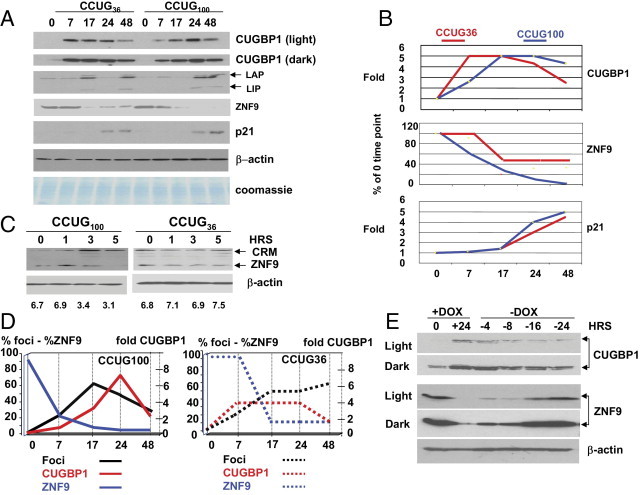
Low amounts of CCUG repeats cause an increase of CUGBP1 and reduction of ZNF9. A: Transcription pulse of CCUG repeats elevates CUGBP1, increases CUGBP1 target, C/EBPβ, reduces ZNF9, and increases p21 levels. Equal amounts of cytoplasmic or nuclear protein extracts from cells described in Figure 5B were examined by Western blot assay with antibodies to CUGBP1, C/EBPβ, ZNF9, and p21. The membrane was re-probed with antibodies to β-actin and stained with Coomassie Blue to verify protein loading. Two exposures (light and dark) for the CUGBP1 signal are shown. B: Levels of CUGBP1, ZNF9, and p21 were calculated as ratios to β-actin after transcription pulses of CCUG36 (red) and CCUG100 (blue). X represents time (in hours) after Dox addition. Y represents fold of CUGBP1 and p21 increase as ratio to β-actin. In the case of ZNF9, Y shows ZNF9 reduction as percentage of ZNF9 levels before Dox addition after adjustment to β-actin levels. C: Long CCUG repeats reduce ZNF9 at early stage after Dox addition. Western blot analysis of the cytoplasmic proteins extracted at 0 to 5 hours after induction of CCUG transcription with Dox. ZNF9 and cross-reactive protein are shown on the right. Bottom image shows the signal of β-actin used as a control for protein loading. Numbers on the bottom show ratio of signals of ZNF9 to β-actin. D: Kinetics of formation of CCUG foci in CHO monoclonal cells with inducible CCUG100 repeats, elevation of CUGBP1, and reduction of ZNF9 are shown. X represents time (in hours) after Dox addition. Y (left) represents percentage of cells with CCUG100 foci (black) and CCUG36 foci (black, punctuated) calculated as a sum of nuclear and cytoplasmic foci based on results in Figure 6. Y (left) also shows kinetics of reduction of ZNF9 after transcription pulses of CCUG100 (blue) and CCUG36 (blue, punctuated), calculated as a percentage of ZNF9 at 0-hours time point after adjustment to the levels of β-actin. Y (right) represents fold of CUGBP1 increase after CCUG100 (red) and CCUG36 transcription pulse (red, punctuated) after adjustment to β-actin levels relative to 0-hours time point (before Dox addition). E: Degradation of CCUG repeats correlates with the normalization of ZNF9 and CUGBP1. Immunoanalysis of CUGBP1 and ZNF9 levels in protein extracts isolated from double-stable cells after a single pulse of CCUG100 transcription, induced with Dox for 24 hours (+), and during degradation of CCUG100 RNA after Dox withdrawal (-). Time points (hrs) at which proteins were extracted are shown on the top. The membrane after CUGBP1 and ZNF9 detection was re-probed with antibodies to β-actin. Two exposures of membrane for CUGBP1 and ZNF9 are shown (light and dark).
To determine whether the reduction of ZNF9 is caused by the low levels of CCUG repeats or whether this reduction is a consequence of late pathological processes in DM2 cells, we analyzed the levels of ZNF9 during the course of accumulation of CCUG repeats. Transcription pulses of both short and long CCUG repeats reduced ZNF9; however, CCUG100 reduced ZNF9 more rapidly and more efficiently than CCUG36 (Figure 10, A and B). Low levels of CCUG100 reduced ZNF9 at 7 hours after Dox addition, whereas CCUG36 at the same 7-hour time point did not change ZNF9 levels (Figure 10, A and B). At 24 to 48 hours after the transcription pulse, CCUG100 RNA completely reduced ZNF9, whereas CCUG36 could not completely decrease ZNF9 levels (Figure 10, A and B). Because CCUG repeats increase the stability of a cdk inhibitor, p21, through the inhibition of the 20S proteasome,32 we determined the levels of p21 after a single pulse of transcription of CCUG repeats, finding that both short and long CCUG repeats increased p21, but that this increase took place at later time points of accumulation of CCUG repeats (Figure 10, A and B). Based on these data, we conclude that the increase of p21 levels is a late event of CCUG accumulation. To determine whether ZNF9 is the primary event of the CCUG toxicity, we measured ZNF9 levels at 1, 3, and 5 hours after Dox addition when the CCUG RNA aggregates were barely seen in a few cells. As shown in Figure 10C, ZNF9 levels were unchanged during 0 to 5 hours after Dox addition in the CCUG36-expressing cells. However, the long CCUG repeats reduced ZNF9 at 3 to 5 hours after Dox addition (Figure 10C). This result shows that ZNF9 reduction is the primary event in the toxicity of the mutant CCUG repeats.
We compared the kinetics of the increase of CUGBP1 and reduction of ZNF9 with the kinetics of accumulation of CCUG foci after a transcriptional pulse of CCUG100. Figure 10D shows that the formation of CCUG foci in CCUG36/100 cells occurred simultaneously (but not proportionally) with the increase of CUGBP1 during the early stage (7 to 17 hours) of repeat accumulation. During later stages (17 to 24 hours), the number of cells with foci in the CCUG100 cell line was decreasing, whereas levels of CUGBP1 continued to grow. This result shows that the correlation between foci accumulation and CUGBP1 increase is poor at later stages after a CCUG100 transcriptional pulse.
CCUG foci formation occurs simultaneously with the reduction of ZNF9 after a pulse of CCUG100 transcription; however, it appears that ZNF9 reduction by CCUG100 RNA is not proportional to the aggregation of CCUG repeats. We compared the kinetics of accumulation of cells with CCUG36 aggregates and ZNF9 reduction. Accumulation of CCUG aggregates in the CCUG36-expressing cells at 7 hours after Dox addition (when 36% of cells contained aggregates) was not sufficient to reduce ZNF9 (Figure 10D). However, accumulation of CCUG aggregates at late stages after Dox addition occurred simultaneously with the reduction of ZNF9. Taken together, these data show that the reduction of ZNF9 by long CCUG repeats is a primary event in the toxicity of the long CCUG repeats and does not seem to be associated with CCUG foci formation.
Degradation of RNA CCUG Repeats Normalizes Levels of CUGBP1 and ZNF9
To examine whether degradation of RNA CCUG repeats is sufficient to reverse elevation of CUGBP1 and reduction of ZNF9, Dox was removed from the growth medium after the accumulation of CCUG repeats. Protein extracts were prepared at different time points of CCUG100 degradation. Analysis of CUGBP1 levels during accumulation of CCUG100 RNA showed that CUGBP1 levels were increased at 24 hours after Dox addition. Degradation of CCUG repeats at 8 to 24 hours after Dox withdrawal reduced CUGBP1 to approximately normal levels (Figure 10E).
ZNF9 levels were reduced on accumulation of CCUG100, but ZNF9 levels rose rapidly following Dox withdrawal. Interestingly, ZNF9 levels started to normalize at early stages of CCUG100 RNA degradation (4 to 8 hours) when CCUG levels were only slightly reduced (Figure 5C). This result shows that ZNF9 protein is a very sensitive target of mutant CCUG repeats. On the complete degradation of CCUG100 RNA, ZNF9 levels returned to normal levels (Figure 10E). Thus, degradation of CCUG100 RNA normalizes expression of CUGBP1 and ZNF9, with this normalization being detectable within a short period of time after CCUG100 RNA degradation.
RNA CCUG Repeats Reduce ZNF9 Expression via Post-Transcriptional Regulation
Rapid reduction of ZNF9 protein levels at the early stages of accumulation of CCUG100 repeats suggested that CCUG repeats might inhibit ZNF9 transcription or ZNF9 RNA stability. To address this issue, we examined the levels of ZNF9 mRNA in stable clones containing short and long CCUG repeats at different time points after a transcriptional pulse. Real-time reverse transcription (RT)–PCR analysis showed that the accumulation of short or long CCUG repeats did not change RNA levels of ZNF9 (Figure 11A). Examination of ZNF9 mRNA in total RNA from primary myoblasts derived from DM2 patients by real-time RT-PCR also showed no significant alterations of ZNF9 RNA levels (Figure 11B). Because ZNF9 mRNA levels could be reduced in the cytoplasmic portion of the total RNA, we analyzed the levels of ZNF9 RNA within poly(A) RNA isolated from control and DM2 myoblasts. We found that ZNF9 (poly A) RNA levels were not changed in DM2 myoblasts (Figure 11C). Thus, it appears that mutant CCUG RNA repeats do not affect the levels of ZNF9 mRNA in DM2 primary myoblasts and in CCUG-expressing cells and reduce ZNF9 protein on the level of posttranscriptional regulation (possibly translation or protein stability).
Figure 11.
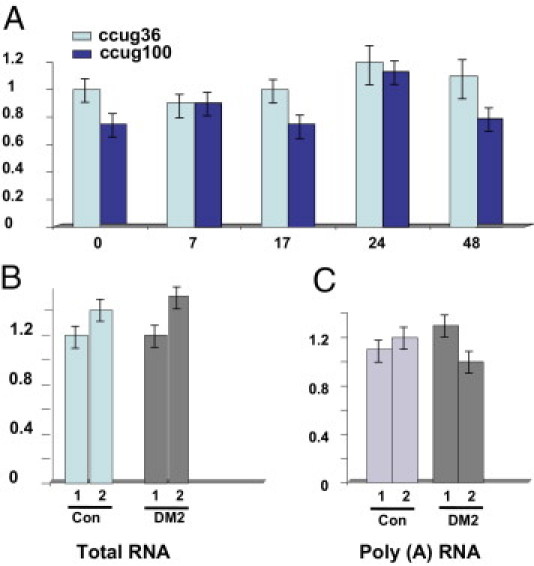
Accumulation of short and long CCUG repeats during transcription pulse does not alter the levels of ZNF9 mRNA. A: Total RNA was extracted at different time points after pulse of transcription as shown in Figure 5B, and was analyzed by real-time RT-PCR with ZNF9-specific primers (set 2, in Materials and Methods). ZNF9 signal was adjusted to GAPDH. X represents time (in hours) after Dox addition. Y represents the intensity of the ZNF9 signal as ratio to GAPDH signal. B: ZNF9 mRNA levels are not reduced in total RNA isolated from DM2 myoblasts. ZNF9 mRNA levels were measured by real-time RT-PCR in normal and DM2 myoblasts with two sets of ZNF9 specific primers and using GAPDH as a standard. C: ZNF9 mRNA levels are not reduced in the poly (A) fraction of RNA from DM2 myoblasts. Poly (A) mRNA was extracted from normal myoblast line and DM2 myoblast line. The levels of ZNF9 were quantified by real-time RT-PCR, with two sets of ZNF9 specific primers and GAPDH as control.
Discussion
The mutant CUG and CCUG repeat expansions are located within the 3′ UTR of DMPK and the intron 1 of ZNF9 genes, respectively. However, multiple studies showed that pure RNA repeats without surrounding sequences are responsible for the majority of the symptoms in DM1 and in DM2. Despite significant progress in understanding the role of CUG and CCUG repeats in DM1/2 pathologies, little is known about primary targets of these repeats. In this study, we used Tet-regulated cell models to determine the sequence of events caused by the mutant CUG and CCUG repeats. We focused our studies on the kinetics of RNA foci formation in relation to ZNF9 reduction and CUGBP1 elevation.
We found that ZNF9 was a primary target of the mutant CCUG repeats. The reduction of ZNF9 was evident at 3 hours after Dox addition before the formation of well-detectable CCUG aggregates. Thus, ZNF9 reduction did not require high amounts of mutant CCUG repeats or CCUG foci. Data described in this paper show that the accumulation of short and long CCUG repeats reduced ZNF9; however, long repeats down-regulated ZNF9 much earlier and to lower levels when compared with the effects of short CCUG repeats (Figure 10 A–D).
The increase of CUGBP1 was an early event in the accumulation of both short and long CUG repeats. However, long CUG repeats had a stronger effect on CUGBP1 elevation relative to high levels of short CUG repeats. CUGBP1 was also elevated by small amounts of CCUG repeats; however, longer CCUG repeats had a slower elevating effect on CUGBP1 than large amounts of short CCUG repeats. These data show that, although CUGBP1 was elevated in both DM1 and DM2, the effects of CUG and CCUG repeats on CUGBP1 were different. This could be due, at least in part, to differences in the binding of CUGBP1 to CUG and CCUG repeats. CUGBP1 binds to CUG repeats as a single protein; however, it binds to CCUG repeats as a component of multiprotein complexes.18, 32 Consistent with elevation of CUGBP1, translation of CUGBP1 targets is altered by CUG and CCUG repeats after CUGBP1 increase.
Examination of the kinetics of foci formation by long CUG and CCUG repeats showed that the accumulation of CUG and CCUG repeats in foci was an early event in the toxicity of CUG/CCUG repeats. This event occurs in parallel with elevation of CUGBP1 and reduction of ZNF9. Accumulation of CUG aggregates in cells expressing long CUG repeats correlated with the increase of CUGBP1. However, there was no evidence that foci accumulation precedes CUGBP1 increase, as these events occurred simultaneously. Moreover, the increase of CUGBP1 was observed even at 1 to 6 hours after Dox addition, when only a few cells contained CUG aggregates, with weak intensity.
Data in the literature show that splicing abnormalities in DM are due to accumulation of nuclear foci that disrupt splicing of mRNAs regulated by MBNL1. On the other hand, soluble mutant repeats outside of foci increased CUGBP1 in DM1.18, 28 This suggests that the misregulation of CUGBP1 function in DM1 and in DM2 might be associated with soluble CUG/CCUG repeats outside of foci. Reduction of ZNF9 in DM2 might be also associated with the accumulation of soluble CCUG repeats or nonspliced ZNF9 pre-mRNA.29, 31
Because the pathology of DM1 and DM2 is caused by long CUG and CCUG repeats correspondingly, the general assumption is that the nondegraded CUG/CCUG repeats are toxic. However, recent data suggest that high levels of short repeats might also be toxic.24, 32 In support of the critical role of high levels of short repeats, our data show that large amounts of short CUG and CCUG repeats cause toxic events such as foci accumulation, elevation of CUGBP1, and reduction of ZNF9. We suggest that the foci formation and elevation of CUGBP1 in CUG25 and CCUG36-inducible cells is caused by the cumulative effect of high levels of CUG and CCUG repeats of normal length. This suggestion is supported by our recent finding that high levels of transiently expressed short CCUG repeats (CCUG36) are sufficient to disrupt protein turnover, mimicking molecular abnormalities in DM2.32 We have previously found that high levels of short CCUG36 repeats form foci.32 Our current data on the status of high levels of CUG25 and CCUG36 RNAs show that short repeats also aggregate when they are expressed under regulation of a CMV promoter (Figure 2, Figure 3, Figure 6, Figure 7, Figure 8). From this we can raise the following question: What is the significance of the toxicity of large amounts of short repeats for patients with DM? We hypothesize that the incomplete degradation of long CUG and CCUG repeats might produce large amounts of short repeats that are also toxic. This hypothesis should be tested by measuring the kinetics of degradation of CUG and CCUG repeats and by examinating the effects of the products of CUG/CCUG degradation on foci, CUGBP1, and ZNF9 using Tet-On cell models after Dox withdrawal.
An important question remains to be answered about the effects of the sequences surrounding CUG and CCUG repeat expansions on the stability of CUG/CCUG repeats. To address this question, we are developing Tet-On monoclonal cells lines expressing regulated DMPK mRNA, different portions of the 3′ UTR of DMPK and an intron 1 of ZNF9 pre-mRNA. It would be interesting to determine whether the sequences surrounding CUG and CCUG expansions have an effect on the degradation and toxicity of these repeats.
The most important result of this study is that the reduction of CUG and CCUG expression corrects levels of CUGBP1 and ZNF9. Thus, it is expected that approaches providing efficient degradation of mutant CUG/CCUG repeats in patients with DM would normalize CUGBP1 and ZNF9 levels and would correct pathways misregulated by these proteins.
Acknowledgments
The authors are thankful to the Muscle Tissue Culture Collection (MTCC) for providing the samples. MTCC is a partner of the EuroBioBank Network established in 2001, thanks to EC funding (01/2003–03/2006).
Footnotes
This work was supported by National Institutes of Health Grants NS063298, AR052791, AR044387, AR044387-ARRA (L.T.T.), GM55188, CA100070, CA159942, AG039885 (N.A.T.), 2T32HL007676-21A1 (K.J.), the German Muscular Dystrophy Network (MD-NET/01GM0601) in partnership with the TREAT-NMD (EC, 6th FP, proposal # 036825) (B.S.) and AFM (G.M.).
K.J. and B.J. contributed equally to the manuscript.
Current address of C.H.: Stem Cell Research Institute (SCRI), San Raffaele Scientific Institute, Milan, Italy.
References
- 1.Harper P.S. WB Saunders; London: 2001. Myotonic Dystrophy. [Google Scholar]
- 2.Ricker K., Koch M.C., Lehmann-Horn F., Pongratz D., Otto M., Heine R., Moxley R.T., 3rd Proximal myotonic myopathy: a new dominant disorder with myotonia, muscle weakness, and cataracts. Neurology. 1994;44:1448–1452. doi: 10.1212/wnl.44.8.1448. [DOI] [PubMed] [Google Scholar]
- 3.Aslanidis C., Jansen G., Amemiya C., Shutler G., Mahadevan M., Tsilfidis C., Clen C., Alleman J., Wormskamp N.G., Vooijs M., Buxton J., Johnson K., Sweets H.J.M., Lennon G.G., Carrano A.V., Korneluk R.G., Wieringa B., deJong P.J. Cloning of essential myotonic dystrophy region and mapping of the putative defect. Nature. 1992;355:548–551. doi: 10.1038/355548a0. [DOI] [PubMed] [Google Scholar]
- 4.Brook J.D., McCurrah M.E., Harley H.G., Buckler A.J., Church D., Aburatani H., Hunter K., Stanton V.P., Thirion J.-P., Hudson T., Sohn R., Zemelman B., Snell R.G., Rundle S.A., Crow S., Davies J., Shelbourne P., Buxton J., Jones C., Juvonen V., Johnson K., Harper P.S., Shaw D.J., Housman D.E. Molecular basis of myotonic dystrophy: expansion of a trinucleotide (CTG) repeats at the 3′ end of a transcript encoding a protein kinase family member. Cell. 1992;68:799–808. doi: 10.1016/0092-8674(92)90154-5. [DOI] [PubMed] [Google Scholar]
- 5.Buxton J., Shelbourne P., Davies J., Jones C., Van Tongeren T., Aslanidis C., de Jong P., Jansen G., Avret M., Riley B., Williamson R., Johnson K. Detection of an unstable fragment of DNA specific to individuals with myotonic dystrophy. Nature. 1992;355:547–548. doi: 10.1038/355547a0. [DOI] [PubMed] [Google Scholar]
- 6.Fu Y.H., Pizzuti A., Fenwick R.G., Jr, King J., Rajnarayan S., Dunne P.W., Dubel J., Nasser G.A., Ashizawa T., de Jong P., Wieringa B., Korneluk R., Perryman M.B., Epstein H.F., Caskey C.T. An unstable triplet repeat in a gene related to myotonic muscular dystrophy. Science. 1992;255:1256–1258. doi: 10.1126/science.1546326. [DOI] [PubMed] [Google Scholar]
- 7.Harley H.G., Brook J.D., Rundle S.A., Crow S., Reardon W., Buckler A.J., Harper P.S., Housman D.E., Shaw D.J. Expansion of an unstable DNA region and phenotype variation in myotonic dystrophy. Nature. 1992;355:545–546. doi: 10.1038/355545a0. [DOI] [PubMed] [Google Scholar]
- 8.Mahadevan M., Tsilfidis C., Sabourin L., Shutler G., Amemiya C., Jansen G., Neville C., Narang M., Barcelo J., O'Hoy K., Leblond S., Earle-Macdonald J., de Jong P.J., Wieringa B., Korneluk R.G. Myotonic dystrophy mutation: an unstable CTG repeat in the 3′ untranslated region of the gene. Science. 1992;255:1253–1255. doi: 10.1126/science.1546325. [DOI] [PubMed] [Google Scholar]
- 9.Liquori C.L., Ricker K., Moseley M.L., Jacobsen J.F., Kress W., Naylor S.L., Day J.W., Ranum L.P. Myotonic dystrophy type 2 caused by a CCTG expansion in intron 1 of ZNF9. Science. 2001;293:864–867. doi: 10.1126/science.1062125. [DOI] [PubMed] [Google Scholar]
- 10.Wang J., Pegoraro E., Menegazzo E., Gennarelli M., Hoop R.C., Angelini C., Hoffman E.P. Myotonic dystrophy: evidence for a possible dominant-negative RNA mutation. Hum Mol Genet. 1995;4:599–606. doi: 10.1093/hmg/4.4.599. [DOI] [PubMed] [Google Scholar]
- 11.Timchenko L.T., Timchenko N.A., Caskey C.T., Roberts R. Novel proteins with binding specificity to DNA CTG and RNA CUG repeats: implications for myotonic dystrophy. Hum Mol Genet. 1996;5:115–121. doi: 10.1093/hmg/5.1.115. [DOI] [PubMed] [Google Scholar]
- 12.Timchenko L.T., Miller J.W., Timchenko N.A., DeVore D.R., Datar K.V., Lin L., Roberts R., Caskey C.T., Swanson M.S. Identification of a (CUG)n triplet repeat binding protein and its expression in myotonic dystrophy. Nucl Acids Res. 1996;24:4407–4414. doi: 10.1093/nar/24.22.4407. [DOI] [PMC free article] [PubMed] [Google Scholar]
- 13.Philips A.V., Timchenko L.T., Cooper T.A. Disruption of splicing of regulated by CUG binding protein in myotonic dystrophy. Science. 1998;280:737–741. doi: 10.1126/science.280.5364.737. [DOI] [PubMed] [Google Scholar]
- 14.Timchenko L.T. Myotonic dystrophy: the role of RNA CUG repeats. Am J Hum Genet. 1999;64:360–364. doi: 10.1086/302268. [DOI] [PMC free article] [PubMed] [Google Scholar]
- 15.Mankodi M., Logigian E., Callahan L., McClain C., White R., Henderson D., Krym M., Thornton C.A. Myotonic dystrophy in transgenic mice expressing an expanded CUG repeat. Science. 2000;289:1769–1772. doi: 10.1126/science.289.5485.1769. [DOI] [PubMed] [Google Scholar]
- 16.Miller J.W., Urbinati C.R., Teng-Umnuay P., Stenberg M.G., Byrne B.J., Thornton C.A., Swanson M.S. Recruitment of human muscleblind proteins to (CUG)n expansions associated with myotonic dystrophy. EMBO J. 2000;19:4439–4448. doi: 10.1093/emboj/19.17.4439. [DOI] [PMC free article] [PubMed] [Google Scholar]
- 17.Seznec H., Agbulut O., Sergeant N., Savouret C., Ghestem A., Tabti N., Willer J.C., Ourth L., Duros E., Brisson E., Fouquet C., Butler-Browne G., Delacourte A., Junien C., Gourdon G. Mice transgenic for human myotonic dystrophy with expanded CTG repeats display muscular and brain abnormalities. Hum Mol Genet. 2001;10:2717–2726. doi: 10.1093/hmg/10.23.2717. [DOI] [PubMed] [Google Scholar]
- 18.Timchenko N.A., Cai Z.-J., Welm A.L., Reddy S., Ashizawa T., Timchenko L.T. RNA CUG repeats sequester and alter protein levels and activity of CUGBP1. J Biol Chem. 2001;276:7820–7826. doi: 10.1074/jbc.M005960200. [DOI] [PubMed] [Google Scholar]
- 19.Timchenko N.A., Iakova P., Cai Z.-J., Smith J.R., Timchenko L.T. Molecular basis for impaired muscle differentiation in myotonic dystrophy. Mol Cell Biol. 2001;21:6927–6938. doi: 10.1128/MCB.21.20.6927-6938.2001. [DOI] [PMC free article] [PubMed] [Google Scholar]
- 20.Savcur R.S., Philips A.V., Cooper T.A. Aberrant regulation of insulin receptor alternative splicing is associated with insulin resistance in myotonic dystrophy. Nat Genet. 2001;29:40–47. doi: 10.1038/ng704. [DOI] [PubMed] [Google Scholar]
- 21.Kanadia R.N., Johnstone K.A., Mankodi A., Lungu C., Thornton C.A., Esson D., Timmers A.M., Hauswirth W.W., Swanson M.S. A muscleblind knockout model for myotonic dystrophy. Science. 2003;302:1978–1980. doi: 10.1126/science.1088583. [DOI] [PubMed] [Google Scholar]
- 22.Timchenko N.A., Patel R., Iakova P., Cai Z.-J., Quan L., Timchenko L.T. Overexpression of CUG triplet repeat-binding protein: CUGBP1, in mice inhibits myogenesis. J Biol Chem. 2004;279:13129–13139. doi: 10.1074/jbc.M312923200. [DOI] [PubMed] [Google Scholar]
- 23.Ho T.H., Bundman D., Amstrong D.L., Cooper T.A. Transgenic mice expressing CUG-BP1 reproduce splicing mis-regulation observed in myotonic dystrophy. Hum Mol Genet. 2005;14:1539–1547. doi: 10.1093/hmg/ddi162. [DOI] [PubMed] [Google Scholar]
- 24.Mahadevan M.S., Yadava R.S., Yu Q., Balijepalli S., Frenzel-McCardell C.D., Bourne T.D., Phillips L.H. Reversible model of RNA toxicity and cardiac conduction defects in myotonic dystrophy. Nat Genet. 2006;38:1066–1070. doi: 10.1038/ng1857. [DOI] [PMC free article] [PubMed] [Google Scholar]
- 25.Orengo J., Chambon P., Metzger D., Mosier D.R., Snipes G.L., Cooper T.A. Expanded CTG repeats within the DMPK 3′ UTR causes severe skeletal muscle wasting in an inducible mouse model for myotonic dystrophy. Proc Natl Acad Sci (USA) 2008;105:2646–2651. doi: 10.1073/pnas.0708519105. [DOI] [PMC free article] [PubMed] [Google Scholar]
- 26.Salisbury E., Sakai K., Schoser B., Huichalaf C., Schneider-Gold C., Nguen H., Wang G.-L., Albrecht J.H., Timchenko L.T. Ectopic expression of cyclin D3 corrects differentiation of DM1 myoblasts through activation of RNA CUG-binding protein. CUGBP1 Exp Cell Res. 2008;314:2266–2278. doi: 10.1016/j.yexcr.2008.04.018. [DOI] [PMC free article] [PubMed] [Google Scholar]
- 27.Zhang L., Lee J.E., Wilusz J., Wilusz C.J. The RNA-binding protein CUGBP1 regulates stability of tumor necrosis factor mRNA in muscle cells. J Biol Chem. 2008;283:22457–22463. doi: 10.1074/jbc.M802803200. [DOI] [PMC free article] [PubMed] [Google Scholar]
- 28.Ebralidze A., Wang Y., Petkova V., Ebralidze K., Junghans R.P. RNA leaching of transcription factors disrupts transcription in myotonic dystrophy. Science. 2004;303:383–387. doi: 10.1126/science.1088679. [DOI] [PubMed] [Google Scholar]
- 29.Huichalaf C., Schoser B., Schneider-Gold C., Jin B., Sarkar P., Timchenko L. Reduction of the rate of protein translation in patients with myotonic dystrophy 2. J Neurosci. 2009;29:9042–9049. doi: 10.1523/JNEUROSCI.1983-09.2009. [DOI] [PMC free article] [PubMed] [Google Scholar]
- 30.Schneider-Gold C., Timchenko L.T. CCUG repeats reduce the rate of global protein synthesis in myotonic dystrophy type 2. Rev Neurosci. 2010;21:19–28. doi: 10.1515/revneuro.2010.21.1.19. [DOI] [PubMed] [Google Scholar]
- 31.Raheem O., Olufemi S.E., Bachinski L.L., Vihola A., Sirito M., Holmlund-Hampf J., Haapasalo H., Li Y.P., Udd B., Krahe R. Mutant (CCTG)n expansion causes abnormal expression of zinc finger protein 9 (ZNF9) in myotonic dystrophy type 2. Am J Pathol. 2010;177:3025–3036. doi: 10.2353/ajpath.2010.100179. [DOI] [PMC free article] [PubMed] [Google Scholar]
- 32.Salisbury E., Schoser B., Schneider-Gold C., Wang G.-L., Huichalaf C., Jin B., Sirito M., Sarkar P., Krahe R., Timchenko N.A., Timchenko L.T. Expression of RNA CCUG repeats dysregulates translation and degradation of proteins in myotonic dystrophy 2 patients. Am J Pathol. 2009;175:748–762. doi: 10.2353/ajpath.2009.090047. [DOI] [PMC free article] [PubMed] [Google Scholar]
- 33.Schoser B., Timchenko L. Myotonic dystrophies 1 and 2: complex diseases with complex mechanisms. Current Genomics. 2010;11:79–90. doi: 10.2174/138920210790886844. [DOI] [PMC free article] [PubMed] [Google Scholar]
- 34.Margolis J.M., Schoser B.G., Moseley M.L., Day J.W., Ranum L.P.W. DM2 intronic expansions: evidence for CCUG accumulation without flanking sequence or effects on ZNF9 mRNA processing or protein expression. Hum Mol Genet. 2006;15:1808–1815. doi: 10.1093/hmg/ddl103. [DOI] [PubMed] [Google Scholar]
- 35.Lin X., Miller J.W., Mankodi A., Kanadia R.N., Yuan Y., Moxley R.T., Swanson M.S., Thornton C.A. Failure of MBNL1-dependent post-natal splicing transitions in myotonic dystrophy. Hum Mol Genet. 2006;15:2087–2097. doi: 10.1093/hmg/ddl132. [DOI] [PubMed] [Google Scholar]
- 36.Le Mee G., Ezzeddine N., Capri M., Ait-Ahmed O. Repeats length and RNA expression level are not primary determinants in CUG expansion toxicity in Drosophila models. PloS One. 2008;3:1–10. doi: 10.1371/journal.pone.0001466. [DOI] [PMC free article] [PubMed] [Google Scholar]
- 37.Ho H.T.H., Savcur R.S., Poulos M.G., Mancini M.A., Swanson M.S., Cooper T.A. Colocalization of muscleblind with RNA foci is separable from mis-regulation of alternative splicing in myotonic dystrophy. J Cell Sci. 2005;118:2923–2933. doi: 10.1242/jcs.02404. [DOI] [PubMed] [Google Scholar]
- 38.Huichalaf C., Sakai K., Jin B., Jin B., Jones K., Wang G.-L., Schoser B., Schneider-Gold C., Sarkar P., Olivia Pereira-Smith O.M., Timchenko N., Timchenko L. Expansion of CUG RNA repeats causes stress and inhibition of translation in myotonic dystrophy 1 cells. FASEB J. 2010;24:3706–3719. doi: 10.1096/fj.09-151159. [DOI] [PMC free article] [PubMed] [Google Scholar]
- 39.Wang G.S., Kearney D.L., De Biasi M., Taffet G., Cooper T.A. Elevation of RNA-binding protein CUGBP1 is an early event in an inducible heart-specific mouse model of myotonic dystrophy. J Clin Invest. 2007;117:2802–2811. doi: 10.1172/JCI32308. [DOI] [PMC free article] [PubMed] [Google Scholar]
- 40.Taneja K.L., McCurrach M., Schalling M., Housman D., Singer R.H. Foci of trinucleotide repeat transcripts in nuclei of myotonic dystrophy cells and tissues. J Cell Biol. 1995;128:995–1002. doi: 10.1083/jcb.128.6.995. [DOI] [PMC free article] [PubMed] [Google Scholar]
- 41.Davis B.M., McCarrach M.E., Taneja K.L., Singer R.H., Housman D.E. Expansion of a CUG trinucleotide repeat in the 3′ untranslated region of myotonic dystrophy protein kinase transcripts results in nuclear retention of transcripts. Proc Natl Acad Sci USA. 1997;94:7388–7393. doi: 10.1073/pnas.94.14.7388. [DOI] [PMC free article] [PubMed] [Google Scholar]
- 42.Krol J., Fiszer A., Mykowska A., Sobczak K., de Mezer M., Krzyzosiak W.J. Ribonuclease Dicer cleaves triplet repeat hairpins into shorter repeats that silence specific targets. Mol Cell. 2007;25:575–586. doi: 10.1016/j.molcel.2007.01.031. [DOI] [PubMed] [Google Scholar]
- 43.Descombes P., Schibler U. A liver-enriched transcriptional activator protein LAP, and a transcriptional inhibitory protein LIP, are translated from the same mRNA. Cell. 1991;67:569–579. doi: 10.1016/0092-8674(91)90531-3. [DOI] [PubMed] [Google Scholar]
- 44.Timchenko N.A., Welm A.L., Lu X., Timchenko L.T. CUG repeat binding protein (CUGBP1) interacts with the 5′ region of C/EBP beta mRNA and regulates translation of C/EBPbeta isoforms. Nucl Acids Res. 1999;27:4517–4525. doi: 10.1093/nar/27.22.4517. [DOI] [PMC free article] [PubMed] [Google Scholar]
- 45.Timchenko L.T., Salisbury E., Wang G.-L., Nguyen H., Albrecht J.H., Hershey J.W.B., Timchenko N.A. Age-specific CUGBP1-eIF2 complex increases translation of CCAAT/Enhancer-binding protein beta in old liver. J Biol Chem. 2006;281:32806–32819. doi: 10.1074/jbc.M605701200. [DOI] [PubMed] [Google Scholar]
- 46.Chen C.A., Yamashita Y., Chang T.-C., Yamashita A., Zhu W., Zhong Z., Shyu A.B. Versatile applications of transcriptional pulsing to study mRNA turnover in mammalian cells. RNA. 2007;13:1775–1786. doi: 10.1261/rna.663507. [DOI] [PMC free article] [PubMed] [Google Scholar]
- 47.Chen A., Shyu A.B. Rapid deadenylation triggered by a nonsense codon precedes decay of the RNA body in a mammalian cytoplasmic nonsense-mediated decay pathway. Mol Cell Biol. 2003;14:4805–4813. doi: 10.1128/MCB.23.14.4805-4813.2003. [DOI] [PMC free article] [PubMed] [Google Scholar]
- 48.Pelletier R., Hamel F., Beaulieu D., Patry L., Haineault C., Tarnopolsky M., Schoser B., Puymirat J. Absence of a differentiation defect in muscle satellite cells from DM2 patients. Neurobiol Dis. 2009;36:181–190. doi: 10.1016/j.nbd.2009.07.009. [DOI] [PubMed] [Google Scholar]
- 49.Botta A., Caldarola S., Vallo L., Bonifazi E., Fruci D., Gullotta F., Massa R., Novelli G., Loreni F. Effect of the [CCTG]n repeat expansion on ZNF9 expression in myotonic dystrophy II (DM2) Biochem Biophys Acta. 2006;1762:329–334. doi: 10.1016/j.bbadis.2005.11.004. [DOI] [PubMed] [Google Scholar]