Autophagy can be induced in response to more subtle changes in nutritional state, without severe nitrogen starvation. The Iml1p-Npr2p-Npr3p complex selectively regulates this form of autophagy.
Abstract
Autophagy is an evolutionarily conserved pathway for the degradation of intracellular contents. How autophagy is regulated, especially upon changes in metabolic and nutritional state, remains poorly understood. By using a prototrophic strain of Saccharomyces cerevisiae, we observed that, unexpectedly, autophagy is strongly induced simply upon switch from a rich medium to a minimal medium in the complete absence of nitrogen starvation. This novel form of autophagy was termed “non-nitrogen-starvation (NNS)–induced autophagy.” A visual screen uncovered three regulators of autophagy—Iml1p, Npr2p, and Npr3p—which function in the same complex and are selectively required for NNS-induced autophagy. During NNS-induced autophagy, Iml1p localized to either preautophagosomal structures (PAS) or non-PAS punctate structures. This localization suggests that Iml1p or the Iml1p-Npr2p-Npr3p complex might regulate autophagosome formation. Ultrastructural analysis confirmed that autophagosome formation was strongly impaired in Δiml1, Δnpr2, and Δnpr3 cells during NNS-induced autophagy. Moreover, Iml1p contains a conserved domain that is required for NNS-induced autophagy as well as complex formation. Collectively, our findings have revealed the existence of additional mechanisms that regulate autophagy under previously unrecognized conditions, in response to relatively more subtle changes in metabolic and nutritional state.
INTRODUCTION
Autophagy is an important cellular pathway that enables the delivery of cytoplasmic contents and organelles to the vacuole or lysosome for degradation. Given its essential role in the maintenance of cellular homeostasis, autophagy has been closely associated with a variety of human diseases (Mizushima et al., 2008). One fundamental question in the autophagy field is how autophagy is regulated in coordination with cellular physiology and metabolism. In eukaryotes, deprivation of essential nutrients strongly induces autophagic degradation of proteins and organelles for survival (Levine and Klionsky, 2004). Therefore nutrient starvation is a commonly used model for the study of the metabolic regulation of autophagy. In Saccharomyces cerevisiae, it is known that nitrogen starvation induces autophagy primarily by inhibiting the activity of the Target of Rapamycin Complex 1 (TORC1), which leads to the dephosphorylation of Atg13p and the activation of the Atg1p-Atg13p initiation complex (Nakatogawa et al., 2009). The mechanism by which nitrogen availability regulates TORC1 activity remains poorly understood, however. Moreover, how other metabolic perturbations might regulate the autophagy pathway also remains unclear. In this study, we discovered that yeast cells induce autophagy following switch from a rich to a minimal medium, in the absence of nitrogen starvation. Subsequently, we used this novel autophagy-inducing condition as a model to investigate the mechanisms by which autophagy is triggered in response to finer changes in metabolic and nutritional state.
RESULTS
Induction of autophagy upon switch from a rich to a minimal medium, without nitrogen starvation
Instead of auxotrophic strains commonly used in previous studies of autophagy, we chose a prototrophic strain of S. cerevisiae, CEN.PK (van Dijken et al., 2000), to study the regulation of autophagy. Because severe nutrient starvation is a well-known trigger for autophagy in both yeast and mammalian cells (Levine and Klionsky, 2004), we first asked whether autophagy could also be induced in the CEN.PK strain by nitrogen starvation. To address this question, wild-type (WT) prototrophic cells were grown in a rich medium with lactate as the carbon source (YPL) to log phase and then switched into two kinds of nitrogen-starvation media (minimal medium with glucose but no nitrogen [SD-N] and minimal medium with lactate but no nitrogen [SL-N]). In contrast to glucose, lactate is a nonfermentable carbon source that requires mitochondria to be metabolized. Non-nitrogen-starvation media (SD and SL) were used as controls. As expected, both general autophagy and organelle autophagy were strongly induced by nitrogen starvation (Figure 1A and Supplemental Figure S1).
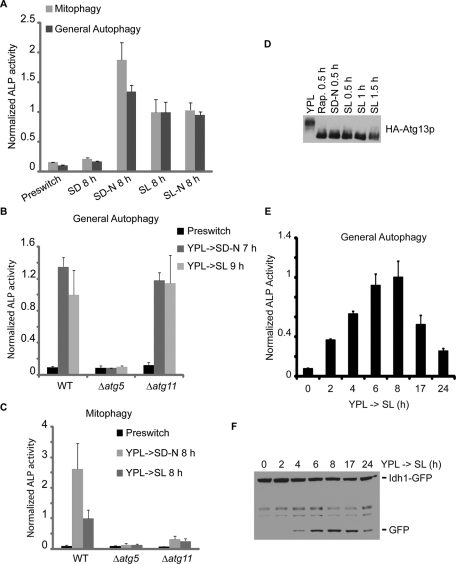
FIGURE 1:
Induction of autophagy upon switch from a rich medium to a minimal, non-starvation medium. Cells were grown in rich medium (YPL) to log phase before switch to nitrogen-starvation medium (SD-N or SL-N). Non-starvation media (SD and SL) were used as controls. At the indicated time points, general autophagy or mitophagy was measured by ALP activity assay or by Western blot using Idh1-GFP as the reporter for mitophagy. IDH1 encodes a mitochondrial matrix protein. (A) As expected, autophagy was induced in starvation media (SD-N and SL-N) but not in the control medium (SD). Surprisingly, autophagy was also significantly induced upon switch to SL medium. (B) NNS-induced general autophagy and nitrogen-starvation-induced general autophagy were inhibited in Δatg5 cells, and not affected in Δatg11 cells. (C) NNS-induced mitophagy and nitrogen-starvation-induced mitophagy were inhibited in both Δatg5 and Δatg11 cells. (D) Dephosphorylation of Atg13p triggered by autophagy-inducing conditions. Rapamycin treatment and nitrogen starvation led to dephosphorylation of Atg13p as reported previously (Kamada et al., 2000). Atg13p was also dephosphorylated upon switch to SL medium. Cells were grown in YPL to log phase before switch to rapamycin-containing (0.2 μg/ml) YPL medium, nitrogen-starvation medium (SD-N), or SL medium. At the indicated time points, 5 OD cells were quenched by mixing with TCA to a final concentration of 5-6% and incubated on ice for at least 5 min before centrifugation. Cell pellets were then subject to whole-cell TCA extraction and analyzed by immunoblotting. Rap., rapamycin. (E and F) Time course experiments revealed that autophagic activity became detectable after 2–4 h, peaked at approximately 6–8 h, and started to decrease after 17–24 h following switch to SL medium. In (A–C and E), data represent averages of three to five samples with error bars for standard deviations.
Surprisingly, however, the activity of the alkaline phosphatase (ALP) reporter for either general autophagy or mitophagy was also significantly elevated upon switch to SL medium, in the complete absence of nitrogen starvation (Figure 1A). Two additional events that were previously shown to be associated with mitophagy, the translocation of mitochondria to the vacuole and the release of free green fluorescent protein (GFP) from Om45-GFP (Kanki et al., 2009b; Okamoto et al., 2009), were observed upon switch to SL medium as well (Supplemental Figure S2, A and B). Autophagic degradation of peroxisomes was also up-regulated as assessed by the release of free GFP from Pex14-GFP (Supplemental Figure S1). Furthermore, all three reporters for autophagic activity were significantly reduced when previously characterized ATG genes were deleted (Nakatogawa et al., 2009; Figure 1, B and C, and Supplemental Figure S2, B–E). Consistently, medium switch from YPL to SL led to dephosphorylation of Atg13p (Figure 1D), which is thought to be one of the early steps during autophagy initiation (Nakatogawa et al., 2009). Taken together, these results demonstrate that autophagy is induced upon switch from the rich medium (YPL) to the minimal, non-nitrogen-starvation medium (SL). This novel autophagy-inducing condition will henceforth be referred to as non-nitrogen-starvation (NNS)-induced autophagy. In subsequent experiments, we assessed the levels of NNS-induced autophagy by measuring both general autophagy and mitophagy.
To better understand NNS-induced autophagy, we measured autophagic activity at different time points after switching to SL medium (Figure 1, E and F). The time-course experiments showed that NNS-induced autophagy became detectable after 2–4 h following medium switch. The autophagic activity peaked after 6–8 h, and started to decrease after 17–24 h. We then tested whether NNS-induced autophagy could occur in the prototrophic versions of W303 and S288C, the auxotrophic derivatives of which have been extensively used in yeast studies. Although autophagy was induced by nitrogen starvation in both strain backgrounds, NNS-induced autophagy was observed in W303 cells but not in S288C cells (Supplemental Figure S3, A and B). Because NNS-induced autophagy is robust in both CEN.PK and W303, we propose that NNS-induced autophagy is a fundamental phenomenon in S. cerevisiae. The failure of S288C cells to trigger autophagy upon switch to SL medium might be due to genetic polymorphisms among the different yeast strains.
NNS-induced autophagy is important for cellular homeostasis and growth following medium switch
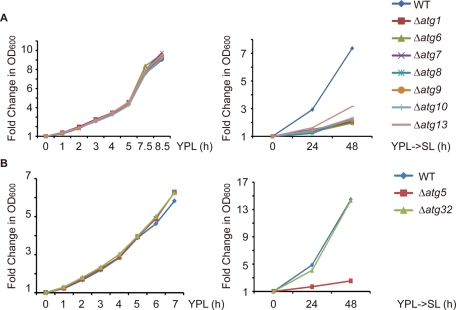
What is the physiological role of NNS-induced autophagy? To address this question, we disrupted the core machinery for autophagosome formation and tested whether a panel of atg mutants might exhibit growth phenotypes upon switch from YPL to SL medium. To ensure that potential growth phenotypes were caused by inhibition of autophagy and not due to gene-specific effects, we tested eight ATG genes—ATG1, ATG5, ATG6, ATG7, ATG8, ATG9, ATG10, and ATG13—which each encodes a core Atg protein (Nakatogawa et al., 2009). For all eight atg mutants, the growth rate in YPL was comparable to that of WT cells (Figure 2, A and B, left panel). Upon switch to SL medium, however, cell growth was severely compromised in the atg mutants (Figure 2, A and B, right panel). These results clearly show that NNS-induced autophagy is important for cell growth upon switch from YPL to SL medium and indicate that NNS-induced autophagy is required for the maintenance of cellular homeostasis in response to changes in medium composition and cellular metabolic state. Furthermore, because mitophagy is strongly induced upon switch to SL medium (Figure 1A), we asked whether inhibition of mitophagy alone was sufficient to impair cell growth. Selective disruption of mitophagy by deleting ATG32 had no effect on cell growth upon switch to SL medium (Figure 2B, right panel), however. Deletion of ATG32 has been recently shown to cause near-complete inhibition of mitophagy (Kanki et al., 2009b; Okamoto et al., 2009).
FIGURE 2:
NNS-induced autophagy is important for cell growth upon switch from YPL to SL medium. (A) Growth curve of WT and atg mutant cells in YPL medium and after switch to SL medium. For growth measurements in YPL, cells of the indicated genotypes were cultured in YPL to log phase and then diluted to OD600 0.05–0.1. OD600 was measured every 1–3 h after dilution and normalized against the first time point. For growth measurements after switch from YPL to SL medium, cells of the indicated genotypes were grown in YPL to log phase (OD600 0.1–0.15) and then switched to SL medium. OD600 was measured every 24 h after medium switch and normalized against the first time point. (B) Growth curve of WT, Δatg5, and Δatg32 cells in YPL medium and after switch to SL medium. Growth measurements were performed as described in (A).
Visual screen to identify genes required for NNS-induced autophagy
To identify genes that are selectively required for NNS-induced autophagy, we conducted a visual screen using a collection of insertion mutants (see Materials and Methods). Briefly, a prototrophic CEN.PK strain expressing a visual reporter for mitophagy was transformed with a transposon-based insertional library to randomly generate insertion mutants (Burns et al., 1994). In the primary screen, individual mutants were grown in YPL in 96-well plates to log phase and then switched to SL medium to induce autophagy. Eight hours following medium switch, mitochondrial images were acquired using an automated imaging setup. Mutants with little or no vacuolar mitochondrial signal were saved for the secondary screen. The purpose of the secondary screen was to eliminate mutants in which the autophagy core machinery had been disrupted. The integrity of the autophagy core machinery was examined by monitoring the translocation of GFP-Atg8p from the cytoplasm to the vacuole during nitrogen-starvation-induced autophagy (Kirisako et al., 1999). After induction of autophagy by nitrogen starvation, the mutants in which GFP-Atg8p predominantly remained in the cytoplasm were discarded, whereas the mutants with strong vacuolar GFP-Atg8p signal were saved for further characterization.
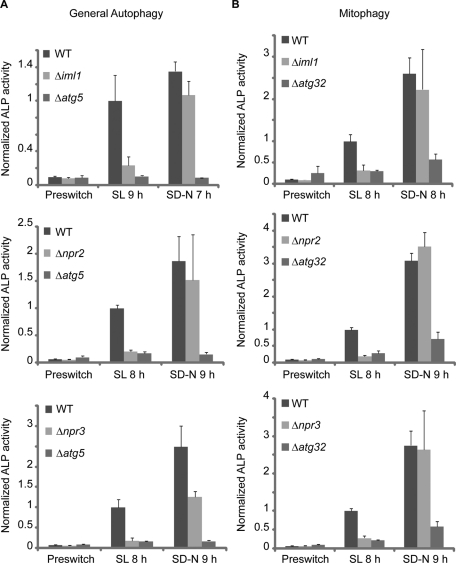
From the visual screen, we identified mutant clones for two of the previously characterized ATG genes, ATG11 and ATG32 (Kanki and Klionsky, 2008; Kanki et al., 2009b; Okamoto et al., 2009), which validates the efficacy of our visual screen. More importantly, the visual screen revealed three poorly characterized genes, IML1, NPR2, and NPR3, the deletion of which led to significant inhibition of NNS-induced autophagy but, strikingly, had minimal to no effect on nitrogen-starvation-induced autophagy (Figure 3 and Supplemental Figure S4). All three genes are essential for NNS-induced autophagy in the W303 strain background as well (Supplemental Figure S3, C and D).
FIGURE 3:
Visual screen uncovers three regulators of autophagy that are selectively required for NNS-induced autophagy. Cells were cultured in YPL to log phase before switch to nitrogen-starvation medium (SD-N) or non-starvation medium (SL). Seven to nine hours following medium switch, general autophagy or mitophagy was measured by the ALP activity assay. Data represent averages of three to five samples with error bars for standard deviations. (A and B) NNS-induced general autophagy and mitophagy were strongly inhibited in Δiml1, Δnpr2, and Δnpr3 cells. Deletion of IML1, NPR2, or NPR3, however, had minimal to no effect on nitrogen-starvation-induced autophagy. Δatg5 and Δatg32 mutants were used as positive controls.
Because Npr2p and Npr3p have been linked to the negative regulation of TORC1 activity (Neklesa and Davis, 2009), and it is known that autophagy can be induced upon inhibition of TORC1 by rapamycin treatment (Noda and Ohsumi, 1998), we tested whether IML1, NPR2, and NPR3 are required for rapamycin-induced autophagy. Although Δatg5 cells failed to up-regulate autophagic activity upon addition of rapamycin and became more sensitive to rapamycin treatment, deletion of IML1, NPR2, or NPR3 had no effect on rapamycin-induced autophagy, and consistently did not affect sensitivity to rapamycin (Supplemental Figure S5). Recent studies reported that Npr2p and Npr3p might be important for nitrogen-starvation-induced autophagy (Dokudovskaya et al., 2011; Graef and Nunnari, 2011). We observed, however, that Npr2p and Npr3p are selectively required for NNS-induced autophagy using multiple assays (Figure 3 and Supplemental Figure S4A).
Iml1p, Npr2p, and Npr3p function in one complex
Because IML1, NPR2, and NPR3 are all selectively involved in SL-induced autophagy, and Npr2p and Npr3p are known to interact with each other (Neklesa and Davis, 2009), we hypothesized that the three proteins might function in one complex to regulate autophagy. To examine a potential interaction among Iml1p, Npr2p, and Npr3p, we generated strains with N- or C-terminal epitope-tagged versions of the three proteins.
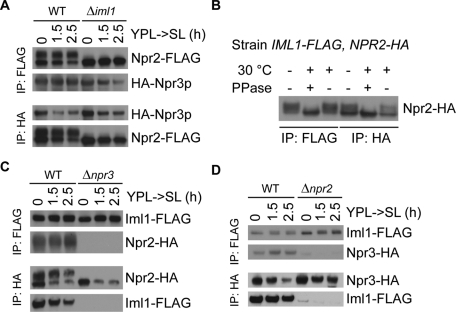
We verified the interaction between Npr2p and Npr3p as assessed by coimmunoprecipitation (Figure 4). Their interaction, however, is independent of IML1 (Figure 4A). As reported previously (Spielewoy et al., 2010), we also observed the phosphorylation of Npr2p as assessed by phosphatase treatment of immunoprecipitated Npr2p (Figure 4B). Npr3p bound to both phosphorylated and dephosphorylated Npr2p (Figure 4A). In contrast, Iml1p primarily interacts with phosphorylated Npr2p, the phosphorylation of which is dependent on both NPR3 and IML1 (Figure 4, A–C). We also detected an interaction between Iml1p and Npr3p, and deletion of NPR2 severely abolished the interaction (Figure 4D). Collectively, we have shown that Iml1p indeed forms a complex with Npr2p and Npr3p, and loss of either NPR2 or NPR3 disrupts the binding between the other two components in the complex. In support of these data, a recent study reported that Iml1p, Npr2p, and Npr3p are present within a complex by mass spectrometry analysis (Dokudovskaya et al., 2011). The Iml1p-Npr2p-Npr3p complex will henceforth be termed “the Iml1p complex.”
FIGURE 4:
Iml1p, Npr2p, and Npr3p function in one complex. Cells were grown in YPL to log phase and then switched to SL medium. At the indicated time points, 80-150 OD cells of the specified double-tagged strains were collected and subject to FLAG or HA immunoprecipitation. (A) Npr2-FLAG and HA-Npr3 interact with each other. Two forms of Npr2p were observed on the immunoblot. Npr3p associates with both forms of Npr2p. Deletion of IML1 led to loss of the slower migrating band of Npr2p, but did not affect the interaction between Npr2p and Npr3p. (B) Iml1p primarily interacts with the phosphorylated form of Npr2p. Cells grown in YPL to log phase were collected and subjected to FLAG or HA immunoprecipitation followed by phosphatase treatment. The slower migrating band of Npr2p was eliminated by phosphatase treatment, which indicates that Npr2p is a phosphorylated protein. Iml1p primarily pulled down the phosphorylated form of Npr2p, which collapsed into a signal band after phosphatase treatment. (C) NPR3 is required for both Npr2p phosphorylation and the Iml1p-Npr2p interaction. In the absence of Npr3p, dephosphorylated Npr2p was unable to pull down Iml1p. (D) Iml1p also associates with Npr3p. The Iml1p-Npr3p interaction was disrupted in the absence of NPR2. There appeared to be no significant changes in the degree of Iml1p-Npr2p-Npr3p interaction or the phosphorylation status of Npr2p upon switch to SL medium.
Iml1p forms punctate structures that occasionally colocalize with preautophagosomal structures
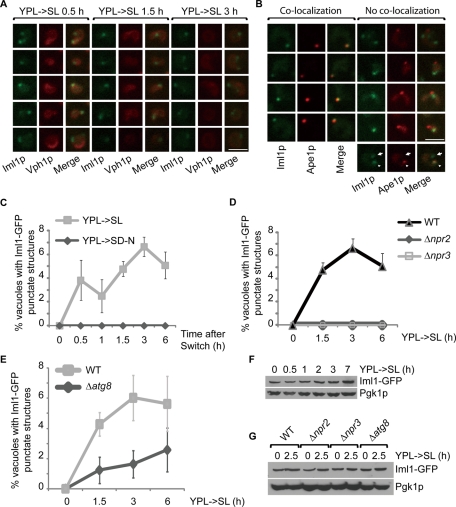
We then monitored the localization of the Iml1p complex by tagging the proteins with GFP. Iml1-GFP is undetectable when cells are grown in YPL. Upon switch from YPL to SL medium, however, we observed that Iml1-GFP formed punctate structures proximal to the vacuole in a small fraction of cells (Figure 5, A and C). The failure to detect Iml1-GFP punctate structures in YPL is not due to a difference in Iml1-GFP expression because the expression of Iml1-GFP did not change at early time points following switch to SL medium (Figure 5F). We then asked whether the punctate structures could be detected under other autophagy-inducing conditions. Similar structures, however, were not observed upon switch to the nitrogen-starvation medium (SD-N; Figure 5C). Therefore Iml1-GFP forms punctate structures specifically during NNS-induced autophagy, which is consistent with the autophagy phenotype of Δiml1.
FIGURE 5:
Iml1-GFP localizes to both PAS and non-PAS punctate structures during NNS-induced autophagy. (A) On switch to SL medium, Iml1-GFP formed punctate structures proximal to the vacuole marked by Vph1-mCherry. Vph1p is a vacuole-resident protein. Representative images from different time points are shown. Scale bar, 5 μm. (B) On switch to SL medium, Iml1-GFP localized to both PAS (arrowhead) and non-PAS punctate foci (arrow). PAS is marked by Ape1-mRFP1 (Suzuki et al., 2007). Representative images from different time points (YPL->SL 1.5–3 h) are shown. Scale bar, 5 μm. (C) Iml1-GFP punctate structures were detected in a small fraction of cells upon switch to SL medium. Medium switch from YPL to nitrogen-starvation medium (SD-N), however, did not induce the formation of Iml1-GFP punctate structures. (C–E) Quantification of the percentage of vacuoles with Iml1-GFP punctate structures under different conditions. At least 200 cells were counted for each time point. Data represent averages from three independent experiments, with error bars for standard deviations. (D) Iml1-GFP punctate structures were not detectable in Δnpr2 and Δnpr3 cells after switch to SL medium. (E) The formation of Iml1-GFP punctate structures was partially inhibited in Δatg8 cells at early time points following switch to SL medium. (F) The abundance of Iml1-GFP did not change at the early time points following switch to SL medium, but modestly increased at later time points. At the indicated time points, 5 OD cells were collected for whole-cell TCA extraction and then analyzed by immunoblotting. Pgk1p was used as the loading control. (G) The expression of Iml1-GFP is not affected in Δnpr2, Δnpr3, and Δatg8 cells. TCA-precipitated, whole-cell extracts from either control or mutant cells were analyzed by immunoblotting.
Although Npr2-GFP and Npr3-GFP signals were undetectable in YPL and SL media (unpublished data), deletion of NPR2 or NPR3 led to complete loss of Iml1-GFP punctate structures without affecting the expression of Iml1-GFP (Figure 5, D and G). The failure to detect Iml1-GFP in YPL medium and Npr2-GFP and Npr3p-GFP in both YPL and SL media could probably be due to their low expression. Iml1p, Npr2p, and Npr3p were undetectable in typical whole cell extracts (unpublished data). We could detect them only using trichloroacetic acid (TCA)-precipitated whole cell extracts (Figure 5F and unpublished data).
In S. cerevisiae, upon induction of autophagy by rapamycin, most of the Atg proteins identified thus far are recruited to preautophagosomal structures (PAS), the organization and dynamics of which are important for autophagosome formation (Suzuki and Ohsumi, 2010). Because both PAS and Iml1-GFP punctate structures are observed proximal to the vacuole and functionally related to autophagy, we suspected that Iml1-GFP might localize to PAS. To address this possibility, we used Ape1p as a marker for PAS (Suzuki et al., 2007), and performed dual-color imaging for both Iml1-GFP and Ape1-mRFP1 after switch to SL medium for a few hours. Interestingly, we observed that Iml1-GFP punctate structures localized to both Ape1-positive PAS and Ape1-negative, non-PAS (Figure 5B). The localization of Iml1p to PAS is consistent with the functional role of IML1 in autophagy and suggests that Iml1p or the Iml1p complex might be involved in the regulation of autophagosome formation.
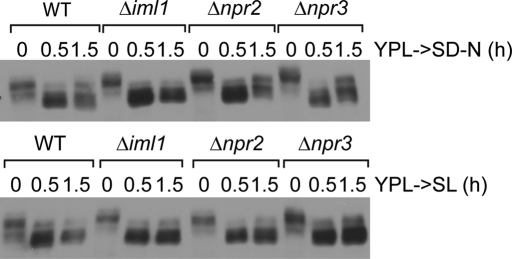
Similarly, Atg8p has been previously shown to form punctate foci that localize to both PAS and non-PAS, like isolation membranes (Kirisako et al., 1999; Suzuki et al., 2007). Therefore we tested whether ATG8 might regulate Iml1p localization. Deletion of ATG8 partially blocked the formation of Iml1-GFP punctate structures at earlier time points upon switch to SL medium, without affecting the expression of Iml1-GFP (Figure 5, E and G). In contrast, Atg8-GFP dot formation is not affected in Δiml1, Δnpr2, or Δnpr3 cells (Supplemental Figure S6). On the basis of these results, we hypothesize that Iml1p or the Iml1p complex functions at a step downstream of Atg8p during autophagosome formation. Consistent with this idea, loss of IML1, NPR2, or NPR3 did not reverse the dephosphorylation of Atg13p upon switch to SL medium (Figure 6), even though Npr2p and Npr2 have been linked to the negative regulation of TORC1 (Neklesa and Davis, 2009).
FIGURE 6:
IML1, NPR2, and NPR3 do not regulate Atg13p phosphorylation. Cells were grown in YPL to log phase before switch to nitrogen-starvation medium (SD-N) or SL medium. At the indicated time points, cells were collected and processed as described in Figure 1D.
The Iml1p complex regulates autophagosome formation during NNS-induced autophagy
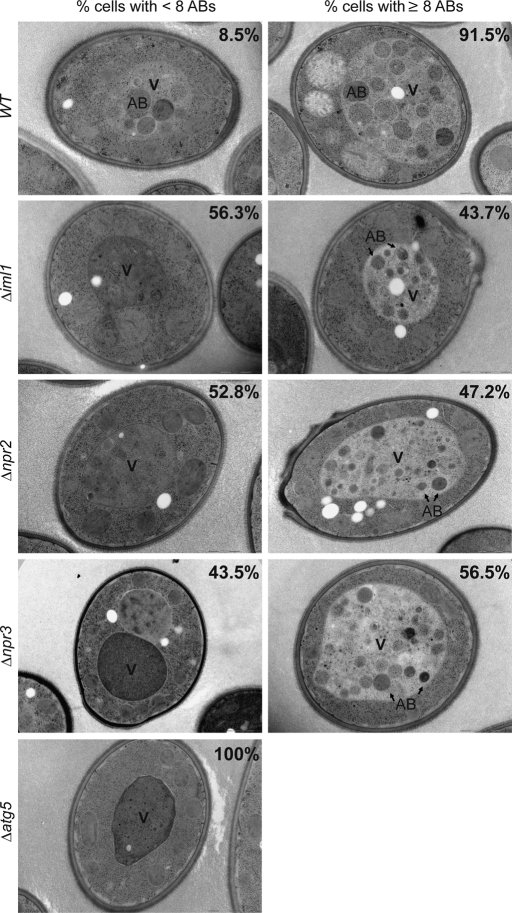
To determine whether the Iml1p complex affects autophagosome formation or the fusion between autophagosomes and vacuole during NNS-induced autophagy, we performed electron microscopy analysis of WT, Δiml1, Δnpr2, Δnpr3, and Δatg5 cells after switching medium from YPL to SL for 9 h. The fusion between autophagosomes and the vacuole is not affected in Δiml1, Δnpr2, and Δnpr3 cells because we did not observe significant accumulation of autophagosomes outside the vacuole. We observed, however, that Δiml1, Δnpr2, and Δnpr3 cells contained fewer autophagic bodies (ABs) in the vacuole. To analyze autophagosome formation more quantitatively, we classified the cells into two groups based on the number of ABs observed in each cell. Cells with fewer than eight ABs were counted as the first group, whereas cells with eight or more ABs were counted as the second group. Only 8.5% of WT cells contained fewer than eight ABs, whereas in striking contrast 56.3% of Δiml1 cells, 52.8% of Δnpr2 cells, 43.5% of Δnpr3 cells, and 100% of Δatg5 in cells contained fewer than eight ABs (Figure 7). Taken together, these results indicate that the Iml1p complex regulates autophagosome formation during NNS-induced autophagy.
FIGURE 7:
Iml1p-Npr2p-Npr3p complex regulates autophagosome formation during NNS-induced autophagy. After 9 h following medium switch from YPL to SL, cells of the indicated genotypes were collected and processed for ultrastructural analysis. Representative images for cells with fewer than eight ABs or cells with eight or more ABs are shown. The percentages of cells classified into each group are indicated in the corresponding images. Total number of cells counted for each genotype: 271 (WT), 256 (Δiml1), 337 (Δnpr2), 232 (Δnpr3), 134 (Δatg5). V, vacuole. All strains used for electromicroscopy analysis contained the deletions Δpep4 and Δprb1, including the WT (Supplemental Table S1).
Iml1p contains a conserved domain required for NNS-induced autophagy
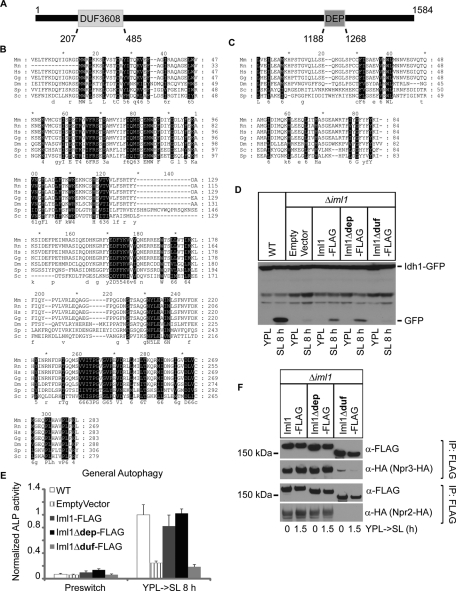
IML1 encodes an ∼182 kDa protein with two potential functional domains: a Domain of Unknown Function (DUF)3608 domain (henceforth referred to as DUF domain) at the N terminus and a Dishevelled, Egl-10, and Pleckstrin (DEP) domain at the C terminus (Figure 8A). The DUF domain is a previously uncharacterized domain. Similar to NPR2 and NPR3 (Neklesa and Davis, 2009), IML1 is also predicted to have orthologues in higher eukaryotes, including Homo sapiens. All the orthologues are similar to IML1 in terms of size and domain architecture but have not been characterized before either. The full-length alignment between Iml1p and its orthologues shows that the highly conserved residues are dispersed throughout the whole protein (Supplemental Figure S7). Some regions are relatively more conserved, such as the DUF domain, whereas other regions contain fewer or even no conserved residues, such as the DEP domain (Figure 8, B and C).
FIGURE 8:
Iml1p contains an evolutionarily conserved domain that is important for NNS-induced autophagy and formation of the Iml1p complex. (A) A schematic representation of the domain structure of Iml1p. (B and C) Multiple sequence alignment for the DUF domain (B) and the DEP domain (C) between Iml1p and its orthologues. Highly conserved residues are in black. Mm, Mus musculus; Rn, Rattus norvegicus; Hs, Homo sapiens; Gg, Gallus gallus; Dm, Drosophila melanogaster; Sp, Schizosaccharomyces pombe; Sc, Saccharomyces cerevisiae. (D and E) The DUF domain of Iml1p is required for NNS-induced autophagy as assessed by Western blot and ALP activity assay. The coding sequence for full-length IML1-FLAG, iml1Δdep-FLAG, or iml1Δduf-FLAG was cloned into a centromeric plasmid under the control of the CYC1 promoter. Empty vector or plasmids expressing Iml1-FLAG, Iml1Δdep-FLAG, or Iml1Δduf-FLAG were transformed into Δiml1 cells to determine whether they could rescue NNS-induced autophagy. WT cells are shown for comparison. In (E), data represent averages of three to five samples, with error bars for standard deviations. (F) The DUF (RANS) domain of Iml1p is required for its interaction with Npr2p and Npr3p. Empty vector or plasmids expressing Iml1-FLAG, Iml1Δdep-FLAG, or Iml1Δduf-FLAG were transformed into Δiml1 cells and then used to pull down Npr2p or Npr3p.
We tested whether the DUF and DEP domains were important for the function of Iml1p in autophagy by introducing Iml1Δdep or Iml1Δduf back into Δiml1 cells to determine whether they could rescue NNS-induced autophagy. We observed that autophagy was significantly, but not fully, rescued by plasmids that express full-length Iml1p or Iml1Δdep (Figure 8, D and E). The expression of Iml1p or Iml1Δdep did not fully match the expression of Iml1p from the endogenous chromosomal locus, which could account for the partial rescue (Supplemental Figure S8). In contrast, Iml1Δduf was not able to rescue NNS-induced autophagy (Figure 8, D and E), which is likely due to the near-complete loss of interaction with Npr2p and Npr3p (Figure 8F). Because the DUF domain is more evolutionarily conserved than the DEP domain and indeed plays an important role in NNS-induced autophagy, we speculate that other orthologues in the IML1 family might also be involved in the regulation of autophagy under particular conditions. In support of this idea, it has been shown that the human orthologues of Npr2p and Npr3p also interact with each other as observed in yeast cells (Neklesa and Davis, 2009). Because to our knowledge this is the first characterization of the function of the DUF3608 domain, we propose to rename it the RANS (Required for Autophagy induced under Non-Nitrogen-Starvation conditions) domain to signify its functional role in autophagy.
DISCUSSION
We have discovered a previously unrecognized autophagy-inducing condition, which is referred to as NNS-induced autophagy. The observation of NNS-induced autophagy implies that, besides severe nitrogen or carbon starvation, autophagy can also be regulated by relatively more subtle changes in medium composition and cellular metabolic state. The nature of these metabolic changes and how they are sensed by the autophagy machinery remain unknown and will be an area for future investigation.
Importantly, NNS-induced autophagy plays a critical role in maintaining cellular homeostasis upon changes in medium composition and metabolic state, because blocking NNS-induced autophagy by disruption of the autophagy core machinery leads to a severe growth phenotype upon switch to SL medium. Thus NNS-induced autophagy might be important for enabling cells to rapidly adapt to changing growth environments.
Another interesting feature of NNS-induced autophagy is that such autophagy is carbon source-dependent, unlike starvation-induced autophagy. Autophagy is not induced upon switch to SD medium, in which glucose is the carbon source (Figure 1A). Consistently, glucose addition to SL medium completely blocked the induction of autophagy upon switch to SL (Supplemental Figure S9). These results imply that NNS-induced autophagy is strictly controlled by cellular metabolic state and may be subject to glucose repression. For example, the up-regulation of mitochondrial respiratory function triggered by lactate, a nonfermentable carbon source, might be essential for NNS-induced autophagy. Alternatively, the abundance of a rich, fermentable carbon source such as glucose may repress the pathways that regulate NNS-induced autophagy. On the basis of these observations, we predict that studies of NNS-induced autophagy will improve our understanding of how the induction of autophagy is intimately coordinated with metabolism.
In addition, we propose that prototrophic strains of S. cerevisiae, such as CEN.PK, will be valuable for the study of the metabolic regulation of autophagy. Such prototrophic strains do not have genomic lesions that disrupt the biosynthetic pathways for certain essential metabolites, such as amino acids and nucleotides, which could impact the regulation of autophagy and other metabolic processes (Boer et al., 2008; Tu, 2010; Tu et al., 2005). Therefore the metabolic behavior of prototrophic cells is presumably more realistic and representative of wild yeast cells.
By conducting a visual screen designed based on these considerations, we have identified a protein complex, termed “the Iml1p complex,” which is selectively required for NNS-induced autophagy and regulates autophagosome formation. Thus our study has revealed the existence of proteins that specifically regulate NNS-induced autophagy as opposed to nitrogen-starvation-induced autophagy. We propose that the Iml1p complex might be evolutionarily conserved for three reasons. First, all three components of the complex—Iml1p, Npr2p, and Npr3p—are predicted to have orthologues in higher eukaryotes. Second, the Npr2p-Npr3p interaction has previously been shown to be conserved in human cells (Neklesa and Davis, 2009). Finally, we have demonstrated that Iml1p contains an evolutionarily conserved domain (RANS domain), which is not only important for the formation of the Iml1p complex but also critical for NNS-induced autophagy.
Interestingly, the dephosphorylation of Atg13p indicates that TORC1 might be inactivated upon switch from the rich YPL medium to minimal SL medium (Figure 6). Our identification of additional factors that are selectively involved in the regulation of NNS-induced autophagy suggests, however, that the molecular mechanisms underlying NNS-induced autophagy might be distinct from those regulating nitrogen-starvation-induced autophagy. Moreover, our findings suggest the possibility that the upstream signals that feed into TORC1 might be distinct under these two autophagy-inducing conditions, assuming that NNS-induced autophagy functions through TORC1. Because disruption of the Iml1p complex has no effect on rapamycin-induced autophagy (Supplemental Figure S5), we speculate that the Iml1p complex does not function at steps downstream of TORC1. Moreover, the failure of the Iml1p complex to regulate Atg13p phosphorylation implies that the Iml1p complex does not regulate TORC1 activity (Figure 6). Therefore our study suggests that additional mechanisms could differentially regulate autophagy depending on the inducing stimulus. Future studies will be required to identify the upstream signals that trigger NNS-induced autophagy and to elucidate how the Iml1p complex regulates NNS-induced autophagy.
MATERIALS AND METHODS
Yeast strains and media
Strains used in this study are listed in Supplemental Table S1.
Media used in this study (Sherman, 2002) are YPL (1% yeast extract, 2% peptone, and 2% lactate); SL (0.17% yeast nitrogen base without amino acids and ammonium sulfate, 0.5% ammonium sulfate, 2% lactate); SD (0.17% yeast nitrogen base without amino acids and ammonium sulfate, 0.5% ammonium sulfate, 2% glucose); SD-N (0.17% yeast nitrogen base without amino acids and ammonium sulfate, 2% glucose); and SL-N (0.17% yeast nitrogen base without amino acids and ammonium sulfate, 2% lactate).
Plasmids
Plasmid pFA6a-OM-KanMX6 was created for making ALP reporters (Pho8Δ60 and Om-pho8Δ60). OM stands for mitochondria outer-membrane targeting. To generate plasmid pFA6a-OM-KanMX6, we first made p417-TEF1 by replacing the CYC1 promoter in p417-CYC1 (Dualsystems Biotech, Schlieren, Switzerland) with ∼411 base pair–long TEF1 promoter at SacI and XbaI sites. Primers used to amplify TEF1 promoter are 5′-ATTGCGAGCTCATAGCTTCAAAATGTTTCTACTCCTTT-3′ (forward primer) and 5′-ATTGCTCTAGAAAACTTAGATTAGATTGCTATGCTTTC-3′ (reverse primer). Base pairs 1–96 of TOM20, which encodes the mitochondria outer-membrane targeting sequence, were inserted into p417-TEF1 at XbaI and EcoRV sites. Primers used to amplify the targeting sequence are 5′-GACTTCTAGAATGTCCCAGTCGAACCCTATCTTAC -3′ (forward primer) and 5′-CAGTGATATCTTGATAGTCAAAGTAGATAGCATAAC-3′ (reverse primer). Then the TEF1 promoter, together with the outer membrane targeting sequence, was digested at SacI and EcoRV sites and inserted into pFA6a-KanMX6 (Longtine et al., 1998) to make pFA6a-OM-KanMX6.
The plasmid HO-poly-MtRFP-KanMX4-HO for generating the mitophagy-imaging reporter was created as described later in this section. Plasmid vt100-DsRed, a generous gift from the Nunnari lab (Westermann and Neupert, 2000), was cut with SphI, and the resulting fragment containing the mitochondria-targeting sequence and the coding sequence for DsRed was blunted with Klenow and cloned into the SmaI site of plasmid HO-poly-KanMX4-HO (Voth et al., 2001).
The GFP-Atg8p–expressing plasmid p417-GFP-ATG8 was generated as described later in this section. The 500 base pair–long ATG8 promoter was inserted into plasmid p417-TEF1 at SacI/BamHI sites. Then the GFP coding sequence was inserted into the resulting plasmid at BamHI/EcoRI sites. Finally, the ATG8 coding sequence was cloned into the plasmid at EcoRI/SalI sites. To make plasmid pRS41N/H-GFP-ATG8, the coding sequence for GFP-ATG8 was cut from p417-GFP-ATG8 and cloned into the vector pRS41N/H (Taxis and Knop, 2006) at SacI/SpeI sites.
Using plasmid p417-CYC1 as the backbone, we created plasmid p417-CYC1-IML1-FLAG, p417-CYC1-iml1Δdep-FLAG, and p417-CYC1-iml1Δduf-FLAG for the rescue experiments in Figure 7. Genomic DNA prepared from cells that express Iml1-FLAG was used as the template to amplify the coding sequence for Iml1-FLAG. Because it was difficult for us to amplify the whole coding sequence in one PCR, we split the gene into two pieces by introducing an EcoRI site right before the DEP domain and cloned the N- or C-terminal fragments into the p417-CYC1 at SpeI/EcoRI sites or EcoRI/SalI sites, respectively. Similar procedures were performed to clone plasmids that express Iml1Δdep-FLAG or Iml1Δduf-FLAG except that the sequences encoding the DEP domain or the DUF domain were skipped in the PCRs.
Assays to monitor autophagy
Imaging.
A dual-color reporter strain expressing mitochondria-localized DsRed (MtRFP) and GFP-tagged vacuole membrane protein Vph1p (Vph1-GFP) was constructed to visualize mitophagy. An increase in the signal of MtRFP in the vacuole indicates the induction of mitophagy.
Western blot.
The release of free GFP from Om45-GFP, Idh1-GFP, and Pex14-GFP was examined to assay mitophagy or pexophagy based on a previously described method (Kanki et al., 2009a). Om45p is a mitochondrial outer-membrane protein. Idh1p is a mitochondrial matrix protein. Pex14p is a peroxisomal membrane protein.
ALP activity assay.
Cells that express cytosolic Pho8Δ60p or mitochondria-outer-membrane–targeted Om-pho8Δ60p were subject to ALP activity assay to measure the level of general autophagy or mitophagy, respectively.
The protocol for ALP assay essentially followed previously described methods (Noda et al., 1995) with some modifications. Briefly, cell pellets were resuspended with 400 μl of lysis buffer (250 mM Tris-HCl pH 9, 25 mM MgSO4, 1% Triton, 1X EDTA-free protease inhibitor cocktail [Roche, Basel, Switzerland]). After adding ∼100 μl of glass beads (Sigma, St. Louis, MO), cells were lysed by three rounds of bead beating: 1 min of beating, then 1 min of cooling on ice. Cell debris and glass beads were separated from the cell extracts by centrifugation at maximum speed for 10 min at 4°C. For each sample, 70 μl of cell extracts were added to triplicate wells in 96-well, flat bottom plates. Plates were kept on ice before the substrate was added. Lysis buffer (70 μl) was added to the blank well. Substrate solution (250 mM Tris-HCl pH 9, 25 mM MgSO4, 1% Triton, 2.7 mM p-nitrophenyl phosphate [MP Biomedicals Life Sciences, Solon, OH]; 70 μl) was then added to each well. Then the plate was incubated at room temperature for 5 min before the reaction was stopped with 140 μl of stop buffer (1 M glycine, pH 11). The plates were read at 400 nm to measure the production of p-nitrophenol.
Visual screen
The founder strain MtRFP, Δleu2 was transformed with the yeast genomic mini-Tn3:: lacZ::LEU2 transposon insertion library to randomly generate insertion mutants by homologous recombination (Burns et al., 1994). Approximately 5000 mutants were made and tested in the primary screen. Individual mutants were grown in YPL in 96-well plates to log phase and then switched to SL medium for 8 h. Then the cells were transferred to 384-well, glass-bottom plates for imaging. The MtRFP signal was automatically captured at 40× magnification using a BD Pathway 855 microscope (BD Biosciences, Franklin Lakes, NJ). Approximately 60 mutants were found to have little or no vacuolar MtRFP signal and were saved for the secondary screen. The purpose of the secondary screen was to eliminate the mutants in which the autophagy core machinery had been disrupted by random insertion. To do this, a centromeric plasmid expressing GFP-Atg8p was transformed into the mutants isolated from the primary screen. The mutants were then grown in YPL to log phase and then switched to the nitrogen starvation medium (SD-N). Approximately 6 h following medium switch, cells were imaged at 100× magnification to visualize both GFP-Atg8p and MtRFP. Twenty-four mutants with vacuolar Atg8p signal but little or no vacuolar MtRFP signal were found and saved for further characterization. The sites of insertion in these mutants were then mapped using the Vectorette PCR method (Riley et al., 1990).
Western blot
For whole cell extract preparation, cell pellets were resuspended with 300 μl of yeast lysis buffer (50 mM NaCl, 50 mM NaF, 100 mM Tris-HCl [pH 7.5], 1 mM EDTA, 1 mM EGTA, 1% Triton X-100, 10% glycerol, 14 mM 2-mercaptoethanol, 1X EDTA-free protease inhibitor cocktail [Roche], 2 mM phenylmethylsulfonyl fluoride, 5 μM Pepstatin A, 10 μM leupeptin). After the addition of ∼80 μl of glass beads, cells were lysed by three rounds of bead beating: 1 min of beating and then 1 min of cooling on ice.
Antibodies used were mouse anti-GFP monoclonal antibody (clones 7.1 and 13.1; Roche), mouse anti-Pgk1 monoclonal antibody (Invitrogen, Carlsbad, CA), mouse anti–FLAG M2 antibody (Sigma), and mouse anti-HA monoclonal antibody (clone 12CA5; Roche).
Microscopy
Cells were imaged using a Yokogawa (Tokyo, Japan) CSU-22 spinning confocal disk on a Nikon (Melville, NY) ECLIPSE Ti microscope. GFP was excited with the 488 nm solid state laser line and red fluorescent protein with the 568 nm solid state laser line. Images were recorded with a 100×/1.45NA CFI apochromat objective with an Andor ix897 electron multiplying charge-coupled device (Andor Technology, Belfast, Northern Ireland).
Immunoprecipitation
At the indicated time points, 80–150 OD (optical density) equivalent of cells were harvested, flash frozen with liquid nitrogen, and stored at –80°C until cell lysis. Then the cell pellet was thawed on ice and resuspended with 500 μl of yeast lysis buffer. After the addition of ∼500 μl of glass beads, cells were lysed by bead beating 9–10 times: 20 s of beating followed by 3 min of cooling on ice. The crude cell extracts were subjected to centrifugation (16,100 × g) for 5 min at 4°C. The supernatant was transferred to a new tube, and 500 μl of lysis buffer was added to the tubes with glass beads. The beads were washed twice. The supernatant was collected by centrifugation and combined with that obtained from the first round of bead beating. The combined supernatant was subjected to centrifugation to eliminate cell debris and glass beads. The cleared supernatant was then mixed with 15 μl of magnetic beads (Invitrogen) that had been conjugated with 2 μg of FLAG or HA antibody and incubated at 4°C for 4 h for FLAG immunoprecipitation or 8 h for HA immunoprecipitation.
Preparation of TCA-precipitated, whole-cell extracts
The TCA-precipitated, whole-cell extracts were prepared following a previously described protocol (Keogh et al., 2006) with slight modifications. Briefly, at the indicated time points, five OD cells were pelleted, washed with 20% TCA, flash frozen with liquid nitrogen, and then stored at –80°C until cell lysis. Then the cell pellet was thawed on ice and resuspended with 250 μl of 20% TCA. After adding ∼250 μl of glass beads, cells were lysed by bead beating three times: 1 min of beating and then 1 min of cooling on ice. The precipitates were collected by centrifugation and washed once with 5% TCA and once with 100% ethanol. The washed pellet was then solubilized in 120 μl of buffer (40 μl of 1 M Tris-HCl, pH 8.0, plus 80 μl of 2× SDS sample buffer) and boiled for 5–10 min.
Electron microscopy
Electron microscopy analysis was performed by the UT Southwestern Medical Center electron microscopy core facility using the rapid freezing and freezing-substitution method. Sample preparation was done according to the protocol described in Baba (2008) except that yeast cells were subject to high-pressure freezing instead of plunge freezing. Ultrastructural images were captured using a FEI (Lausanne, Switzerland) Tecnai G2 Spirit transmission electron microscope.
Protein sequence alignment for IML1 family members
Sequence alignment was performed using ClustalW. The alignment results were analyzed by Genedoc.
Accession numbers for protein sequences are as follows: S. cerevisiae, NP_012672.1 Schizosaccharomyces pombe, NP_596645.1 Drosophila melanogaster, NP_728621.1 Gallus gallus, XP_415249.2 Mus musculus, NP_001020597.1 Rattus norvegicus, NP_001100699.1 Homo sapiens, NP_055477.1.
Supplementary Material
Acknowledgments
We thank Jodi Nunnari for sharing the mtRFP construct, Andrew Murray for the W303 prototroph strain, Michael Snyder for the yeast transposon library, the UTSW high-throughput screening core facility for assistance with automated image acquisition, the UTSW electron microscopy core facility for assistance with sample processing, and members of the Tu lab for helpful discussions. This work was supported by a Burroughs Wellcome Fund Career Award in Biomedical Sciences (B.P.T.), the UTSW Endowed Scholars Program (B.P.T.), a Welch Foundation Research Grant I-1697 (B.P.T.), award R01GM094314 from the National Institute of General Medical Sciences, a David and Lucile Packard Foundation Fellowship (B.P.T.), a fellowship from the Chilton Foundation (X.W.), and a Med into Grad Initiative sponsored by Howard Hughes Medical Institute (X.W.)
Abbreviations used:
- AB
autophagic body
- ALP
alkaline phosphatase
- DEP
Dishevelled, Egl-10, and Pleckstrin
- DUF
domain of unknown function
- GFP
green fluorescent protein
- NNS
non-nitrogen-starvation
- PAS
preautophagosomal structures
- TCA
trichloroacetic acid
- TORC1
Target of Rapamycin Complex 1
- WT
wild type
Footnotes
This article was published online ahead of print in MBoC in Press (http://www.molbiolcell.org/cgi/doi/10.1091/mbc.E11-06-0525) on September 7, 2011.
REFERENCES
- Baba M. Electron microscopy in yeast. Methods Enzymol. 2008;451:133–149. doi: 10.1016/S0076-6879(08)03210-2. [DOI] [PubMed] [Google Scholar]
- Boer VM, Amini S, Botstein D. Influence of genotype and nutrition on survival and metabolism of starving yeast. Proc Natl Acad Sci USA. 2008;105:6930–6935. doi: 10.1073/pnas.0802601105. [DOI] [PMC free article] [PubMed] [Google Scholar]
- Burns N, Grimwade B, Ross-Macdonald PB, Choi EY, Finberg K, Roeder GS, Snyder M. Large-scale analysis of gene expression, protein localization, and gene disruption in Saccharomyces cerevisiae. Genes Dev. 1994;8:1087–1105. doi: 10.1101/gad.8.9.1087. [DOI] [PubMed] [Google Scholar]
- Dokudovskaya S, et al. A conserved coatomer-related complex containing Sec13 and Seh1 dynamically associates with the vacuole in Saccharomyces cerevisiae. Mol Cell Proteomics. 2011;10 doi: 10.1074/mcp.M110.006478. 10.1074/mcp.M110.006478. [DOI] [PMC free article] [PubMed] [Google Scholar]
- Graef M, Nunnari J. Mitochondria regulate autophagy by conserved signalling pathways. EMBO J. 2011;30:2101–2114. doi: 10.1038/emboj.2011.104. [DOI] [PMC free article] [PubMed] [Google Scholar]
- Kamada Y, Funakoshi T, Shintani T, Nagano K, Ohsumi M, Ohsumi Y. Tor-mediated induction of autophagy via an Apg1 protein kinase complex. J Cell Biol. 2000;150:1507–1513. doi: 10.1083/jcb.150.6.1507. [DOI] [PMC free article] [PubMed] [Google Scholar]
- Kanki T, Kang D, Klionsky DJ. Monitoring mitophagy in yeast: the Om45-GFP processing assay. Autophagy. 2009a;5:1186–1189. doi: 10.4161/auto.5.8.9854. [DOI] [PMC free article] [PubMed] [Google Scholar]
- Kanki T, Klionsky DJ. Mitophagy in yeast occurs through a selective mechanism. J Biol Chem. 2008;283:32386–32393. doi: 10.1074/jbc.M802403200. [DOI] [PMC free article] [PubMed] [Google Scholar]
- Kanki T, Wang K, Cao Y, Baba M, Klionsky DJ. Atg32 is a mitochondrial protein that confers selectivity during mitophagy. Dev Cell. 2009b;17:98–109. doi: 10.1016/j.devcel.2009.06.014. [DOI] [PMC free article] [PubMed] [Google Scholar]
- Keogh MC, et al. A phosphatase complex that dephosphorylates gammaH2AX regulates DNA damage checkpoint recovery. Nature. 2006;439:497–501. doi: 10.1038/nature04384. [DOI] [PubMed] [Google Scholar]
- Kirisako T, Baba M, Ishihara N, Miyazawa K, Ohsumi M, Yoshimori T, Noda T, Ohsumi Y. Formation process of autophagosome is traced with Apg8/Aut7p in yeast. J Cell Biol. 1999;147:435–446. doi: 10.1083/jcb.147.2.435. [DOI] [PMC free article] [PubMed] [Google Scholar]
- Levine B, Klionsky DJ. Development by self-digestion: molecular mechanisms and biological functions of autophagy. Dev Cell. 2004;6:463–477. doi: 10.1016/s1534-5807(04)00099-1. [DOI] [PubMed] [Google Scholar]
- Longtine MS, McKenzie A 3rd, Demarini DJ, Shah NG, Wach A, Brachat A, Philippsen P, Pringle JR. Additional modules for versatile and economical PCR-based gene deletion and modification in Saccharomyces cerevisiae. Yeast. 1998;14:953–961. doi: 10.1002/(SICI)1097-0061(199807)14:10<953::AID-YEA293>3.0.CO;2-U. [DOI] [PubMed] [Google Scholar]
- Mizushima N, Levine B, Cuervo AM, Klionsky DJ. Autophagy fights disease through cellular self-digestion. Nature. 2008;451:1069–1075. doi: 10.1038/nature06639. [DOI] [PMC free article] [PubMed] [Google Scholar]
- Nakatogawa H, Suzuki K, Kamada Y, Ohsumi Y. Dynamics and diversity in autophagy mechanisms: lessons from yeast. Nat Rev Mol Cell Biol. 2009;10:458–467. doi: 10.1038/nrm2708. [DOI] [PubMed] [Google Scholar]
- Neklesa TK, Davis RW. A genome-wide screen for regulators of TORC1 in response to amino acid starvation reveals a conserved Npr2/3 complex. PLoS Genet. 2009;5:e1000515. doi: 10.1371/journal.pgen.1000515. [DOI] [PMC free article] [PubMed] [Google Scholar]
- Noda T, Matsuura A, Wada Y, Ohsumi Y. Novel system for monitoring autophagy in the yeast Saccharomyces cerevisiae. Biochem Biophys Res Commun. 1995;210:126–132. doi: 10.1006/bbrc.1995.1636. [DOI] [PubMed] [Google Scholar]
- Noda T, Ohsumi Y. Tor, a phosphatidylinositol kinase homologue, controls autophagy in yeast. J Biol Chem. 1998;273:3963–3966. doi: 10.1074/jbc.273.7.3963. [DOI] [PubMed] [Google Scholar]
- Okamoto K, Kondo-Okamoto N, Ohsumi Y. Mitochondria-anchored receptor Atg32 mediates degradation of mitochondria via selective autophagy. Dev Cell. 2009;17:87–97. doi: 10.1016/j.devcel.2009.06.013. [DOI] [PubMed] [Google Scholar]
- Riley J, Butler R, Ogilvie D, Finniear R, Jenner D, Powell S, Anand R, Smith JC, Markham AF. A novel, rapid method for the isolation of terminal sequences from yeast artificial chromosome (YAC) clones. Nucleic Acids Res. 1990;18:2887–2890. doi: 10.1093/nar/18.10.2887. [DOI] [PMC free article] [PubMed] [Google Scholar]
- Sherman F. Getting started with yeast. Methods Enzymol. 2002;350:3–41. doi: 10.1016/s0076-6879(02)50954-x. [DOI] [PubMed] [Google Scholar]
- Spielewoy N, Guaderrama M, Wohlschlegel JA, Ashe M, Yates JR 3rd, Wittenberg C. Npr2, yeast homolog of the human tumor suppressor NPRL2, is a target of Grr1 required for adaptation to growth on diverse nitrogen sources. Eukaryot Cell. 2010;9:592–601. doi: 10.1128/EC.00192-09. [DOI] [PMC free article] [PubMed] [Google Scholar]
- Suzuki K, Kubota Y, Sekito T, Ohsumi Y. Hierarchy of Atg proteins in pre-autophagosomal structure organization. Genes Cells. 2007;12:209–218. doi: 10.1111/j.1365-2443.2007.01050.x. [DOI] [PubMed] [Google Scholar]
- Suzuki K, Ohsumi Y. Current knowledge of the pre-autophagosomal structure (PAS) FEBS Lett. 2010;584:1280–1286. doi: 10.1016/j.febslet.2010.02.001. [DOI] [PubMed] [Google Scholar]
- Taxis C, Knop M. System of centromeric, episomal, and integrative vectors based on drug resistance markers for Saccharomyces cerevisiae. Biotechniques. 2006;40:73–78. doi: 10.2144/000112040. [DOI] [PubMed] [Google Scholar]
- Tu BP. Ultradian metabolic cycles in yeast. Methods Enzymol. 2010;470:857–866. doi: 10.1016/S0076-6879(10)70035-5. [DOI] [PubMed] [Google Scholar]
- Tu BP, Kudlicki A, Rowicka M, McKnight SL. Logic of the yeast metabolic cycle: temporal compartmentalization of cellular processes. Science. 2005;310:1152–1158. doi: 10.1126/science.1120499. [DOI] [PubMed] [Google Scholar]
- van Dijken JP, et al. An interlaboratory comparison of physiological and genetic properties of four Saccharomyces cerevisiae strains. Enzyme Microb Technol. 2000;26:706–714. doi: 10.1016/s0141-0229(00)00162-9. [DOI] [PubMed] [Google Scholar]
- Voth WP, Richards JD, Shaw JM, Stillman DJ. Yeast vectors for integration at the HO locus. Nucleic Acids Res. 2001;29:E59–E59. doi: 10.1093/nar/29.12.e59. [DOI] [PMC free article] [PubMed] [Google Scholar]
- Westermann B, Neupert W. Mitochondria-targeted green fluorescent proteins: convenient tools for the study of organelle biogenesis in Saccharomyces cerevisiae. Yeast. 2000;16:1421–1427. doi: 10.1002/1097-0061(200011)16:15<1421::AID-YEA624>3.0.CO;2-U. [DOI] [PubMed] [Google Scholar]
Associated Data
This section collects any data citations, data availability statements, or supplementary materials included in this article.


