Abstract
Background & objective
ARDS is characterised by bilateral pulmonary infiltrates and refractory hypoxemia attributed to V/Q mismatch. We used dynamic CT to characterise changes in lung composition, regional perfusion and tissue distribution in patients with ARDS in comparison to healthy subjects.
Methods
The Fick principle was applied to serial attenuation measurements constructed from sequential CT images acquired during the passage of a bolus of iodinated contrast medium in healthy subjects (n=3) and patients with ARDS (n=11). Perfusion was calculated by the Mullani-Gould method and mapped throughout both lungs. Gradients of perfusion and tissue density against vertical height were constructed.
Results
In comparison to normal individuals, the tissue component of lungs from patients with ARDS was significantly increased (p<0.05). Blood fraction was unchanged. There was a discernable gradient in tissue density from non dependent to dependent regions in the patients with ARDS that was significantly different from controls. The proportion of perfusion applied to consolidated areas (ie shunt) correlated significantly (p<0.05) with the severity of hypoxaemia.
Conclusions
In patients with ARDS there are changes in both lung composition and the distribution of tissue and perfusion that may account in part for the physiological changes that define the syndrome.
Keywords: regional blood flow, acute lung injury, physiology, pulmonary perfusion, ARDS
Introduction
ARDS is associated with a wide range of pulmonary and systemic insults and is defined clinically by bilateral pulmonary infiltrates and refractory hypoxemia,1 the latter being attributable primarily to V/Q mismatch. CT has increased understanding of the respiratory abnormalities of ARDS, demonstrating that a patchy distribution of disease results in preferential ventilation of relatively spared and more compliant lung regions.2, 3 However, how changes to lung composition (eg lung water fraction) alter the distribution of pulmonary perfusion remains unclear. Thus, in normal subjects a gravitational distribution of pulmonary perfusion from non-dependent to dependent regions persists regardless of posture, determined by interrelationships between hydrostatic, alveolar and interstitial pressures.4, 5 How this is modified in patients with ARDS is unknown, but is highly relevant in assessing the effects of ventilatory support, which itself influences pulmonary perfusion.
CT has been used to measure perfusion, particularly in the myocardium, and validated by comparison to techniques employing injected microspheres.6-8 In work published previously we and others have quantified pulmonary perfusion using CT in humans and animals respectively9,10 thus providing the potential to quantify lung composition and perfusion simultaneously in patients with ARDS.
The aims of the current study were therefore threefold. First, to examine changes in the composition of the lung that occur in patients with ARDS compared to normal individuals; and second, to analyze how the distribution of parenchymal consolidation and tissue perfusion might differ in the same populations. Finally, we aimed to identify associations between these anatomical changes and changes in gas exchange that define the syndrome.
Methods
Study design
This was a prospective observational study enrolling sequential patients in whom the attending Consultant confirmed the diagnosis of ARDS, defined by American European Consensus Guidelines,1 and of three normal subjects. Patients from the adult intensive care unit of the Royal Brompton Hospital who required CT as part of their routine clinical investigation11 were enrolled, as well as three normal volunteers. The protocol was approved by the Research Ethics Committee of the Royal Brompton & Harefield Hospitals NHS Trust. Healthy subjects provided written, informed consent and the relatives of patients unable to provide informed consent provided informed assent.
Subjects & patients
Normal subjects and patients were positioned supine. To permit comparisons with patients, in whom the application of ventilatory support alters pulmonary perfusion, subjects received intermittent positive pressure ventilation via a mouthpiece, using an inspired gas concentration (FiO2) of 0.21 and 5 cm of positive end-expiratory pressure (PEEP), delivered via a machine identical to that employed in the support of those with ARDS (Drager Evita II, Drager, Lubeck, Germany). Subjects were left for 15 minutes, following which a preview scan was performed. A multi-sequence scan was then acquired 2-3 cm above the right hemi-diaphragm during an inspiratory breath-holding maneuver, performed using the inspiratory pause function of the ventilator. Patients received therapies and monitoring during transport and were supported in the scanning suite using identical ventilator settings, according to our institution’s protocol for ARDS.11 During the course of each study, no changes were made to the ventilatory parameters, nor to FiO2. The CT protocol was identical to that used in healthy volunteers.
Scanning protocol
An electron beam CT scanner was used in single slice mode (Imatron Inc, California, USA). Scans for flow studies were obtained with a kVp of 140, tube current of 120 mA, acquisition time of 100 ms and slice width of 6mm. A sequence of 15 cardiac-gated scans were performed, each triggered by successive heart-beats. A field of view of 35cm was used with a resolution of 360 × 360 pixels, so that each pixel was approximately 1 × 1 × 6mm. The scanning protocol administered a total radiation dose of 3.3 mSv, equivalent to 1.6 years of background radiation exposure in London. Intravenous contrast was administered by rapid automated intravenous injection (60 ml of Iohexol, 300mgI/ml, over 3 seconds) via pre-existing central venous catheters (patients) or a 16G catheter placed in an antecubital vein (volunteers).
Data analysis
Images were segmented semi-automatically, and air / tissue volumes were measured based on Hounsfield unit density using the Pulmonary Analysis Software Suite.12 The lung parenchyma was defined in terms of the lung water fraction, composed of tissue (itself mainly composed of water) and blood. In the presence of the widespread consolidation that characterizes ARDS, the complement of water fraction (air fraction, an index of accessible or ventilated alveoli) was employed. Quantitative regional perfusion was determined from the ratio of peak parenchymal density enhancement to the area under the time-density curve of the pulmonary artery in contrast injection images13 using Time-Series Image Analysis software.14 The proportion of a region of interest (ROI) comprised of blood was derived from the ratio of the areas under the tissue and arterial time-density curves respectively. Both software packages were developed by the University of Iowa Division of Physiologic Imaging (http://dpi.radiology.uiowa.edu/). Data handling and statistical analysis were performed with Splus Professional 6.1 software (TIBCO, Somerville, USA). For comparisons between scans or groups, non-parametric analyses (Wilcoxon rank sum test) were used. P values equal to or less than 0.05 were considered significant.
Results
Healthy controls & patients
As required by the Research Ethics Committee, the minimum number of normal subjects (n=3, male, non smoking 30-48 years) necessary to confirm previous findings in normal individuals10 was studied. Conventional CT analyses revealed no abnormality. Eleven patients with ARDS were scanned (Table 1), categorized by the nature of the underlying insult (n=9 direct pulmonary insult, n=2 indirect) and lung injury score15 (an amalgam of chest radiograph appearances, hypoxemia assessed by PaO2 : FiO2 ratio, PEEP applied and respiratory system compliance; > 2.5 = severe, n=10). No adverse clinical incidents occurred during CT transfer nor scanning.
Table 1.
Demographics for ARDS patients
| Subject | S | Age (yrs) | Diagnosis | Days since ARDS onset | Lung injury score (LIS) | PaO2:FiO2 (kPa) | Survival |
|---|---|---|---|---|---|---|---|
| 1 | M | 28 | Trauma | 15 | 2.5 | 27.2 | Yes |
| 2 | F | 18 | Pneumonia | 10 | 3.0 | 15.6 | No |
| 3 | M | 33 | Trauma | 11 | 3.75 | 8.9 | Yes |
| 4 | F | 27 | Pneumonia | 5 | 3.5 | 16.8 | No |
| 5 | M | 25 | Pneumonia | 10 | 3.5 | 16.2 | Yes |
| 6 | M | 31 | Pneumonia | 7 | 3.0 | 19.8 | Yes |
| 7 | F | 42 | Pneumonia | 2 | 3.0 | 19.8 | Yes |
| 8 | F | 66 | Post lung resection | 6 | 2.3 | 20.6 | No |
| 9 | M | 27 | Pneumonia | 16 | 3.3 | 11.2 | Yes |
| 10 | F | 28 | Pneumonia | 6 | 3.3 | 17.7 | Yes |
| 11 | M | 47 | Pneumonia | 15 | 3.5 | 19.1 | Yes |
| Mean ± sd | 33.3 ± 13.6 | 9.4 ± 4.6 | 3.2 ± 0.44 | 16.5 ± 5.4 |
Composition of lungs
In comparison to normal subjects, patient scans revealed patchy consolidation throughout both lung fields with a predominantly basal distribution. The lung water fraction (tissue + blood) of the lung parenchyma occupied a significantly (p<0.05) greater proportion of each voxel in patients, most of which was accounted for by the tissue component. The blood fraction was not significantly different between patients and controls (Figure 1).
Figure 1.
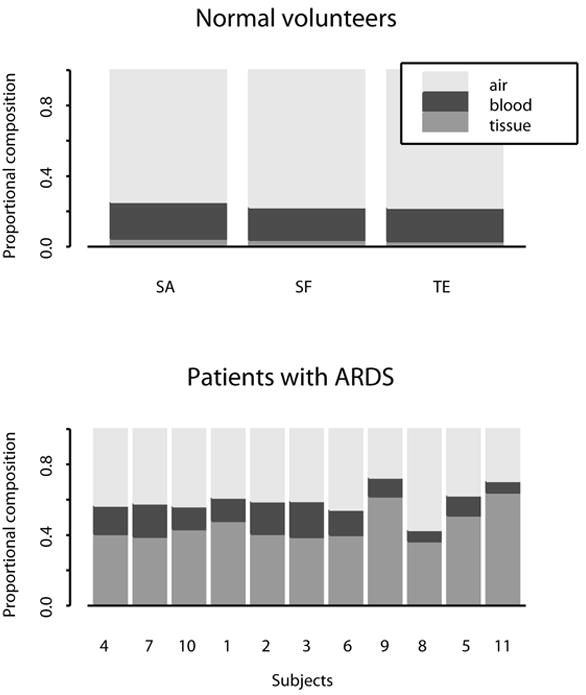
Composition of lungs in normal subjects (upper panel) and patients with ARDS (lower panel). In comparison to normal subjects, water fraction occupied a greater proportion of each voxel. Most of this accounted for by an increase in the tissue component, with the blood fraction remaining unchanged.
Distribution of CT tissue density (Figure 2)
Figure 2.
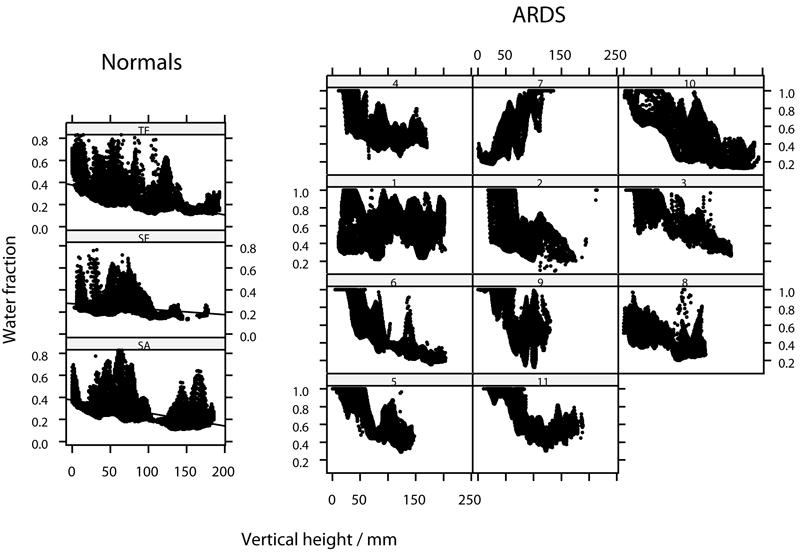
Distribution of lung density (as water fraction) throughout the axial plane for normal subjects and for patients with ARDS. The right lung only is represented. Location in the axial plane expressed as vertical height above the scanning table. Linear regression lines added for normal subjects.
In normal subjects, the distribution of CT tissue density appeared linear throughout most of the range of vertical height, with a negative gradient (ie density decreasing) against vertical height above the scanning table and each being significantly different to zero (p<0.05)(Figure 2). Median gradient of tissue density against vertical height was -3.2 (range -5.5 to -2.0). In most patients with ARDS, there was a discernible gradation in tissue density from ventral to dorsal. However, the group was heterogenous, both between and within (ie comparing the left and right lungs) individuals. Thus, in two subjects (1 and 8) there was a uniform tissue distribution and in one (7) a reverse trend from dorsal to ventral was apparent.
CT distribution of perfusion
For normal subjects, the median inter-subject value of perfusion mapped throughout both lungs was 1.7 ml min-1 ml-1, with no significant left / right difference. Perfusion showed a gravitational bias, increasing in a linear fashion along the antero-posterior ordinate, making for a negative gradient against vertical height. In the most dorsal (dependent) portion of lung there was a reduction in perfusion, in keeping with a four-zone model of perfusion. The gradients of the linear fit of perfusion against vertical height were all negative, and each was significantly different from zero (p<0.05). The median gradient of perfusion (expressed as percent change from the mean per cm vertical height) was -4.1 (range -6 to -2). Using a linear model, vertical height was shown to account for a median of 16% of the variation in raw perfusion. In patients with ARDS, the distribution of perfusion showed a gravitational bias in five of the eleven scans (1, 2, 3, 5), a uniform distribution in four (7, 8, 9, 11) and an bell-shaped distribution in three (4, 6, 10) (Figures 3 & 4). The inter-subject median perfusion was not significantly greater than that of normals, at 1.9 ml min-1 ml-1.
Figure 3.
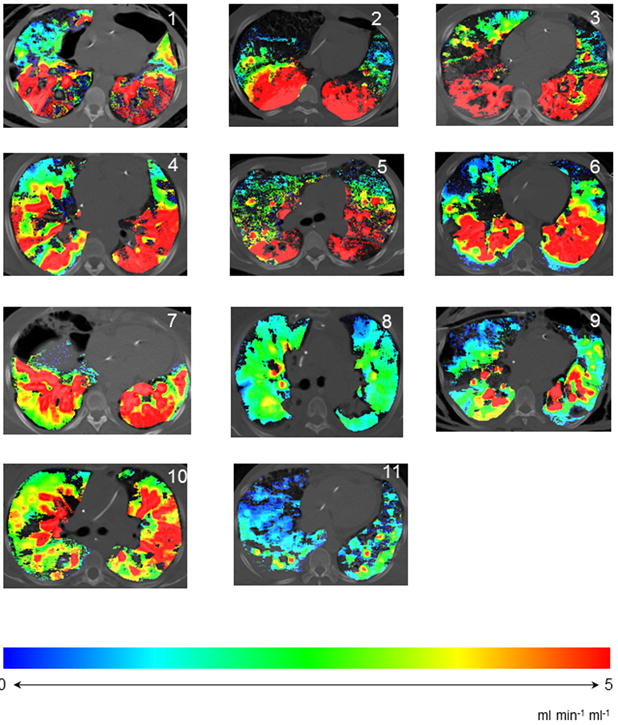
Color-maps, showing distribution of perfusion throughout and axial slice of lung in patients with ARDS. Spectrum changing from blue to red indicates increasing perfusion.
Figure 4.
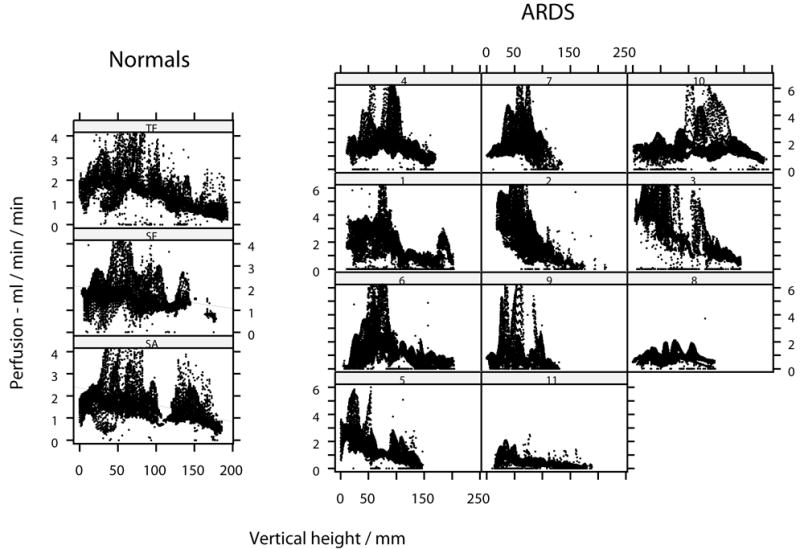
Distribution of raw perfusion throughout the axial plane for lungs of each normal subject and for patients with ARDS. The right lung only is represented. Location in the axial plane expressed as vertical height above the scanning table. Linear regression lines added for normal subjects.
Distribution of perfusion in relation to tissue density
In normal subjects, the mean perfusion of denser voxels was significantly higher than of those with more air. Thus, maximum perfusion values were recorded in those voxels with lung water fractions of 0.6-0.8 (Fig 5, panel A). However, a greater proportion of blood flow was actually directed toward voxels of lower water content, as low density voxels were significantly greater in number in normal subjects (Fig 5, panel C). By contrast, in patients with ARDS, a greater proportion of blood flow was directed toward voxels with greater water fraction, or less air (Figure 5 panel D). Overall, the total proportion of perfusion directed to voxels with water fraction greater than 0.7 was 0.3% in normal subjects and 37% in patients with ARDS (p<0.05). Using linear regression to model variability in perfusion between individuals, the proportion of total perfusion within the slice of lung which was directed to consolidated tissue (ie anatomical shunt) correlated significantly with FiO2 / PaO2 ratio (Fig 6). Thus, the proportion of total perfusion within the slice of lung which was applied to voxels with a water fraction greater than 0.7 accounted for 50% of the variance in FiO2:PaO2 between patients (p=0.015). The ‘fit’ of this model improved as perfusion of higher water fractions was considered (with water fraction > 0.8 or > 0.9, R2 = 0.6, p=0.005). There was no correlation between oxygenation and consolidation alone, as indicated by the mean water fraction of a scan; nor with the number of high density voxels using thresholds water fractions of 0.7, 0.8 nor 0.9.
Figure 5.
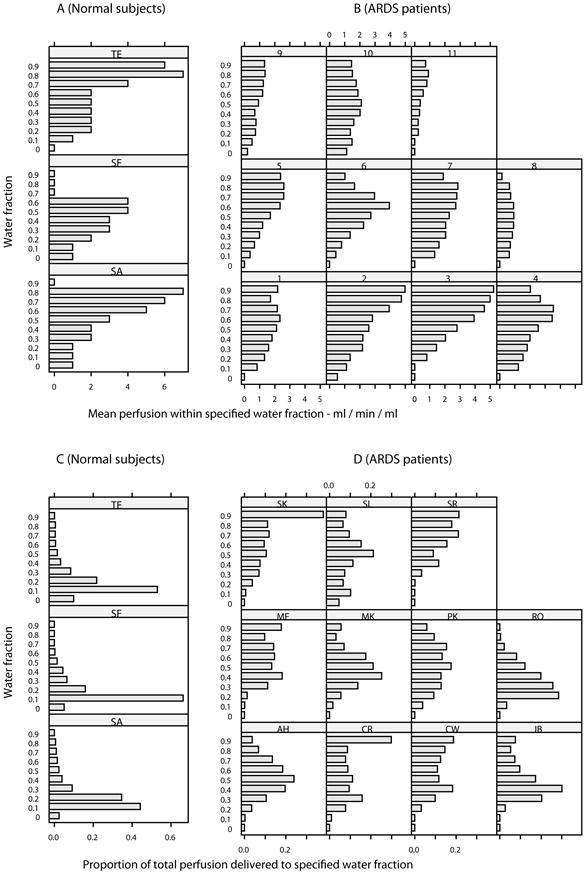
Mean perfusion within specified (ml/min/mil) for normal subjects and patients with ARDS (B). A significantly greater proportion of blood flow was directed toward denser voxels (p<0.05). Proportion of total perfusion delivered to specified water fraction in normal subjects (C) and patients with ARDS (D). The total proportion of perfusion directed to voxels with water fraction of greater than 0.7 was 0.3% in normal subjects and 37% in patients with ARDS (p<0.05).
Figure 6.
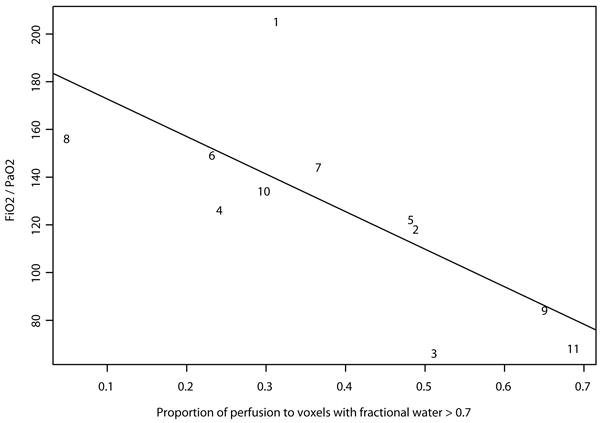
Using linear regression to model variability in perfusion between individuals, the proportion which was directed to consolidated tissue correlated with oxygen requirement, as indicated by FiO2/PaO2 ratio.
Discussion
In this study we have confirmed that in comparison to normal subjects, the distribution of perfusion is profoundly disturbed in ARDS, and have demonstrated for the first time that the proportion of perfusion applied to consolidated lung (ie anatomical shunt) correlated significantly (p<0.05) with the severity of hypoxaemia. Secondly, in comparison to normal individuals, the tissue component of lungs is significantly increased in patients with ARDS, whilst the blood fraction is unchanged. Thirdly, we have confirmed the previous finding that a discernable gradient in tissue density exists from non-dependent to dependent regions in ARDS, which was significantly different from controls.
The dye dilution methodology for quantifying blood flow we employed is established in both theoretical and experimental terms.13, 16 Thus, we expressed perfusion data as flow per spatial voxel (ml min-1 ml-1). Using CT, it is possible to measure tissue density, and thence express perfusion data per tissue density, giving data analogous to microsphere studies. Such a method is desirable in a non-rigid organ such as the normal lung, in which the dependent region otherwise registers greater perfusion merely as a reflection of greater alveolar density. This issue is discussed at length elsewhere.9 By contrast, in the lungs of patients with ARDS most of this increased density is attributable to air spaces that are obliterated or filled with proteinaceous material, and thereby reflects non-functioning lung. In the presence of widespread consolidation, the complement of tissue density (ie air fraction) would be a more rational denominator, as this is an index of accessible alveoli. However, many of the values for the air fraction lie close to zero, producing a very wide range of perfusion values if this quantity is incorporated as the denominator, rendering it unsuitable. We therefore concluded that perfusion per spatial voxel is the most useful parameter to consider in patients with ARDS, and expressed the data from healthy subjects in the same manner.
The overall perfusion gradient (-4.1cm-1) measured in the normal subjects was somewhat less than previously reported, though of a similar order. Thus, a gradient of perfusion which increased by 14% for every cm below the right ventricular border has been demonstrated using PET.17 In a subsequent study, a mean gradient of 4% cm-1 was reported.18 Mean compositional values in humans were similar to those obtained by others using PET (air=0.73), although the mean Q of 1.7 ml min-1 ml-1 is very similar (1.92 ml min-1 mg-1).19
Whilst the gravitational tissue gradient seen in patients with ARDS was expected, the actual distribution of perfusion was highly variable and has not previously been described in humans. In dogs with oleic acid-induced lung injury the redirection of perfusion by hypoxic pulmonary vasoconstriction has previously been shown to be preserved. The beneficial effect of this mechanism was demonstrated by a dramatic worsening of oxygenation when vasoconstriction was inhibited by either alkalosis or endotoxin.20 Moreover, a previous study using dynamic CT to examine distribution of perfusion in sheep lungs before and after induction of lung injury showed a re-distribution of flow away from areas of lung injury induced by saline, but not by lipopolysaccharide.21 By contrast, in patients with ALI this mechanism was found to be severely blunted in a PET-based study.22 The results of the present investigation suggest that perfusion of consolidated alveoli is greatly variable between individuals with ARDS, and displays a distribution which cannot be accounted for by gravity alone. Whether this is explicable by a variation in the extent to which the physiological control of pulmonary V/Q remains intact in different anatomical regions of the lung is unclear. Nevertheless, it is interesting to note that anatomical shunt correlated strongly with hypoxaemia. Using PET to study dogs subjected to oleic acid lung injury, the correlation between improvement of oxygenation and perfusion redistribution was only slight (though significant), suggesting that mechanisms other than hypoxic vasoconstriction may affect regional perfusion after lung injury, and that variation in flow to an injured area has an important influence on oxygenation.23 However, in a carefully conducted study using CT in patients with ARDS, no correlation was found between venous admixture and anatomical shunt fraction, defined as the proportion of uninflated lung tissue and determined using a range of density thresholds between values of -500 and -100 HU (water fractions of 0.5-0.9 respectively) could be demonstrated.24 Whilst our own data revealed no correlation between hypoxaemia and lung inflation, estimated by water fraction, the former was predicted by the proportion of perfusion applied to consolidated tissue. Quantifying the extent of consolidation alone was not predictive. Thus, effectively ‘mapping’ shunt using this technique provided results that are in accordance with previously published physiological data.
Our patients (mean duration of ARDS 9 days) had suffered direct (n=9) and indirect (n=2) pulmonary insults. Whether our findings would have differed in patients with uniform precipitating conditions, or with earlier or more established lung injury is unclear. We and others have shown that ARDS arising from pulmonary or extra-pulmonary insults varies in terms of distribution of disease defined using CT25 or lung mechanics,26 or in response to prone positioning.27 However, only patients who required imaging as part of their clinical management and at a time relevant to that need were permitted to enter the study.
In summary, patients with ARDS demonstrate changes in both lung composition and the distribution of tissue and perfusion that correlated with the physiological perturbations that define the syndrome. Whether this system could be employed to provide a more precise evaluation of changes in regional pulmonary perfusion to optimize mechanical ventilatory support remains unclear.
Acknowledgments
The data analysis tools were developed with the assistance of Chulho Won and Hidenori Shikata (VIDA). Data and statistical analyses were performed with the advice of Blake Robinswood. Jonathan Dakin was funded by the Doverdale Fellowship, Royal Brompton & Harefield NHS Trust. This work was supported in part by NIH-RO1-HL-064368 and HL-060158; and by the National Institute of Health Research Respiratory disease Biomedical Research Unit at the Royal Brompton & Harefield NHS Foundation Trust and Imperial college London.
Footnotes
Conflict of interest statement: EH is a share-holder in VIDA Diagnostics which markets the Pulmonary Analysis Software Suite used in this work.
References
- 1.Bernard GR, Artigas A, Brigham KL, et al. The American-European Consensus Conference on ARDS. Definitions, mechanisms, relevant outcomes, and clinical trial coordination. Am J Respir Crit Care Med. 1994;149:818–24. doi: 10.1164/ajrccm.149.3.7509706. [DOI] [PubMed] [Google Scholar]
- 2.Gattinoni L, Mascheroni D, Torresin A, et al. Morphological response to positive end expiratory pressure in acute respiratory failure. Computerized tomography study. Intensive Care Med. 1986;12:137–42. doi: 10.1007/BF00254928. [DOI] [PubMed] [Google Scholar]
- 3.Maunder RJ, Shuman WP, McHugh JW, Marglin SI, Butler J. Preservation of normal lung regions in the adult respiratory distress syndrome. Analysis by computed tomography. Jama. 1986;255:2463–5. [PubMed] [Google Scholar]
- 4.Hughes JM, Glazier JB, Maloney JE, West JB. Effect of extra-alveolar vessels on distribution of blood flow in the dog lung. J Appl Physiol. 1968;25:701–12. doi: 10.1152/jappl.1968.25.6.701. [DOI] [PubMed] [Google Scholar]
- 5.West J, Dollery C, Naimark A. Distribution of blood-flow in isolated lung: relation to vascular and alveolar presures. J Appl Physiol. 1964;19:713–24. doi: 10.1152/jappl.1964.19.4.713. [DOI] [PubMed] [Google Scholar]
- 6.Wolfkiel CJ, Ferguson JL, Chomka EV, et al. Measurement of myocardial blood flow by ultrafast computed tomography. Circulation. 1987;76:1262–73. doi: 10.1161/01.cir.76.6.1262. [DOI] [PubMed] [Google Scholar]
- 7.Rumgerger J, Fiering A, Lipton MJ. Use of ultrafast computed tomography to quantitate regional myocardial perfusion. A preliminary report. Journal of American College of Cardiologists. 1987;9:59. doi: 10.1016/s0735-1097(87)80083-9. [DOI] [PubMed] [Google Scholar]
- 8.Gould RG, Lipton MJ, McNamara MT, et al. Measurement of regional myocardial blood flow in dogs by ultrafast CT. Invest Radiol. 1988;23:348–53. [PubMed] [Google Scholar]
- 9.Chon D, Beck KC, Larsen RL, Shikata H, Hoffman EA. Regional pulmonary blood flow in dogs by 4D-X-ray CT. J Appl Physiol. 2006;101:1451–65. doi: 10.1152/japplphysiol.01131.2005. [DOI] [PubMed] [Google Scholar]
- 10.Dakin JH, Evans TW, Hansell DM, Hoffman EA. Regional pulmonary blood flow in humans and dogs by 4D computed tomography. Acad Radiol. 2008;15:844–52. doi: 10.1016/j.acra.2007.12.019. [DOI] [PMC free article] [PubMed] [Google Scholar]
- 11.Leaver SK, Evans TW. Acute respiratory distress syndrome. BMJ. 2007;335:389–94. doi: 10.1136/bmj.39293.624699.AD. [DOI] [PMC free article] [PubMed] [Google Scholar]
- 12.Hoffman EA, Reinhardt JM, Sonka M, et al. Characterization of the interstitial lung diseases via density-based and texture-based analysis of computed tomography images of lung structure and function. Acad Radiol. 2003;10:1104–18. doi: 10.1016/s1076-6332(03)00330-1. [DOI] [PubMed] [Google Scholar]
- 13.Wu X, Latson LA, Wang T, et al. Regional pulmonary perfusion estimated by high-speed volume scanning CT. Am J Physiol Imaging. 1988;3:73–80. [PubMed] [Google Scholar]
- 14.Won C, Chon D, Tajik J, et al. CT-based assessment of regional pulmonary microvascular blood flow parameters. J Appl Physiol. 2003;94:2483–93. doi: 10.1152/japplphysiol.00688.2002. [DOI] [PubMed] [Google Scholar]
- 15.Murray JF, Matthay MA, Luce JM, Flick MR. An expanded definition of the adult respiratory distress syndrome. Am Rev Respir Dis. 1988;138:720–3. doi: 10.1164/ajrccm/138.3.720. [DOI] [PubMed] [Google Scholar]
- 16.Rumberger JA, Bell M. Measurement of myocardial perfusion using electron-beam (ultra-fast) computed tomography. In: Brundage BH, editor. Cardiac Imaging. WB Saunders; Philadelphia: 1996. [Google Scholar]
- 17.Brudin LH, Rhodes CG, Valind SO, Jones T, Hughes JM. Interrelationships between regional blood flow, blood volume, and ventilation in supine humans. J Appl Physiol. 1994;76:1205–10. doi: 10.1152/jappl.1994.76.3.1205. [DOI] [PubMed] [Google Scholar]
- 18.Musch G, Layfield JD, Harris RS, et al. Topographical distribution of pulmonary perfusion and ventilation, assessed by PET in supine and prone humans. J Appl Physiol. 2002;93:1841–51. doi: 10.1152/japplphysiol.00223.2002. [DOI] [PubMed] [Google Scholar]
- 19.Brudin LH, Rhodes CG, Valind SO, Wollmer P, Hughes JM. Regional lung density and blood volume in nonsmoking and smoking subjects measured by PET. J Appl Physiol. 1987;63:1324–34. doi: 10.1152/jappl.1987.63.4.1324. [DOI] [PubMed] [Google Scholar]
- 20.Brimioulle S, Julien V, Gust R, et al. Importance of hypoxic vasoconstriction in maintaining oxygenation during acute lung injury. Crit Care Med. 2002;30:874–80. doi: 10.1097/00003246-200204000-00027. [DOI] [PubMed] [Google Scholar]
- 21.Easley RB, Fuld MK, Fernandez-Bustamante A, Hoffman EA, Simon BA. Mechanism of hypoxemia in acute lung injury evaluated by multidetector-row CT. Acad Radiol. 2006;13:916–21. doi: 10.1016/j.acra.2006.02.055. [DOI] [PubMed] [Google Scholar]
- 22.Schuster DP, Anderson C, Kozlowski J, Lange N. Regional pulmonary perfusion in patients with acute pulmonary edema. J Nucl Med. 2002;43:863–70. [PubMed] [Google Scholar]
- 23.Schuster DP, Marklin GF. The effect of regional lung injury or alveolar hypoxia on pulmonary blood flow and lung water measured by positron emission tomography. Am Rev Respir Dis. 1986;133:1037–42. doi: 10.1164/arrd.1986.133.6.1037. [DOI] [PubMed] [Google Scholar]
- 24.Cressoni M, Caironi P, Polli F, et al. Anatomical and functional intrapulmonary shunt in acute respiratory distress syndrome. Crit Care Med. 2008;36:669–75. doi: 10.1097/01.CCM.0000300276.12074.E1. [DOI] [PubMed] [Google Scholar]
- 25.Desai SR, Wells AU, Suntharalingam G, et al. Acute respiratory distress syndrome caused by pulmonary and extrapulmonary injury: a comparative CT study. Radiology. 2001;218:689–93. doi: 10.1148/radiology.218.3.r01mr31689. [DOI] [PubMed] [Google Scholar]
- 26.Gattinoni L, Pelosi P, Suter PM, Pedoto A, Vercesi P, et al. Acute respiratory distress syndrome caused by pulmonary and extrapulmonary disease. Different syndromes? Am J Respir Crit Care Med. 1998;158:3–11. doi: 10.1164/ajrccm.158.1.9708031. [DOI] [PubMed] [Google Scholar]
- 27.Lim CM, Kim EK, Lee JS, Shim TS, Lee SD, et al. Comparison of the response to the prone position between pulmonary and extrapulmonary acute respiratory distress syndrome. Intensive Care Med. 2001;27:477–85. doi: 10.1007/s001340000848. [DOI] [PubMed] [Google Scholar]


