Abstract
Introduction
Western blotting is a basic technique for protein detection. For proteins of less abundance or antibodies of poorer quality, an increased sensitivity is often desired. Although it is commonly known that higher concentrations of antibodies and prolonged film exposure times will help improve sensitivity in western blots, both measures come with their own risks, and it is often unclear to which extent these measures should be applied.
Methods
We conducted time-course studies to investigate protein-antibody interactions and primary antibody-secondary antibody interactions in western blotting. We also propose a protocol of stacked film exposure and have tested it in standard curves and cancer cell samples.
Results
Our study found that protein-primary antibody interactions and primary antibody-secondary antibody interactions could take a longer time than commonly used “one hour” or “overnight”, and in some cases longer than 48 hours, to reach its maximum binding. We also show that the modified protocol of stacked film exposure works well for both standard curves and biological samples, reaching a maximum sensitivity in western blots without blurring target signals or increasing backgrounds.
Discussion
In addition to regular optimization of antibody concentrations and film exposure time, a prolonged incubation with antibodies and stacked film exposure will also help improve sensitivity and reduce background in western blotting.
Keywords: Western blotting, Methods, Sensitivity, Incubation time, Stacked film exposure
1. Introduction
Western blotting has long been a standard technique for detecting and quantifying proteins with specificity [Paladichuk, 1999]. This technique typically separates proteins based on their size by sodium dodecyl sulfate polyacrylamide gel electrophoresis (SDS-PAGE), and involves the transfer of protein to a nitrocellulose or polyvinylidene fluoride (PVDF) membrane. The membrane is further blocked, incubated with primary and secondary antibodies (Abs), and visualized with various methods corresponding to the secondary Ab labels [Kurien et al., 2003; Towbin et al., 1979]. A widely used label is horse radish peroxidase (HRP). HRP catalyzes oxidation of luminol by peroxide to produce 3-aminophthalate, which decays and produces light that can be captured with an x-ray film or a charge-coupled device (CCD) camera [Fournier et al., 2003]. While western blotting is a basic technique in many laboratories today, protocols are less strictly defined, with instructions of “incubate with primary Ab for one hr”, “incubate with primary Ab overnight”, “incubate with 2nd Ab for one hr” and “expose to x-ray film for one minute” most commonly seen. This is partly because the western blotting protocol is target protein- and primary antibody-dependent, with abundant proteins and high-affinity antibodies (such as antibodies against Glyceraldehyde 3-phosphate dehydrogenase, GAPDH) requiring shorter incubation and/or exposure time, while others require longer times. To improve the sensitivity of western blotting for low-abundance proteins, increased Ab concentrations and film exposure time is regularly applied with risks of raised background. To explore alternative approaches, we conducted time course studies on several antibodies and tested a modified protocol of film exposure in this study.
2. Materials and Methods
2.1 Interaction between protein and primary antibody in western blotting
Ovarian cancer cells (OVCAR-3) were cultured as previously described [Luo et al., 2011], and cells were harvested with M-PER Mammalian Protein Extraction Reagent (Pierce) per the manufacturer’s directions. Cell lysate (25 μg in 5 μL) was dotted on nitrocellulose membranes (Fisher Scientific) and air-dried. The membranes were wetted with distilled water for 5 min, blocked with 5% non-fat milk in Tris-Buffered Saline with 0.1% Tween 20 (TBST) for 1 hour, washed with distilled water, air-dried, and cut into individual pieces. Primary Abs against human GAPDH, Bad, cMyc (Santa Cruz), and Hypoxia-inducible factor 1β (HIF-1β, BD Biosciences) were utilized. The primary Abs were prepared at 0.25 μg/mL in 50 mL 5% milk. At each different time point, a piece of membrane was wetted with distilled water, and incubated in 5 mL primary Ab at room temperature with shaking. The first membrane piece was incubated 48 hours before the end of time course, and the last membrane piece was incubated 5 minutes before the end of time course. At the end of the time course, all membrane pieces were washed with distilled water for 5 times, incubated with 250 ng/mL Goat-Anti-Mouse-Poly-HRP (Pierce) in 5% milk overnight, and visualized with SuperSignal West Pico Chemiluminescent Substrate (Pierce) and blue x-ray films (Phenix Research Products). Dot values were quantitated with NIH ImageJ software and the 48-hr and 0-min incubation dots were set as 100% and 0%, respectively, for normalization and plotting. OVCAR-3 cell lysates were also subjected to SDS-PAGE and Western Blotted with GAPDH and HIF-1β antibodies for 5 hours at room temperature to evaluate possible contribution from binding with non-specific proteins in this dot-blot experiment.
2.2 Interaction between primary antibody and secondary antibody in western blotting
The four primary Abs aforementioned were prepared in 5% milk and dotted (1 ng in 5 μL) on nitrocellulose membranes, and the membranes were dried and blocked as described above. The secondary Ab, Goat-Anti-Mouse-Poly-HRP, was prepared at 50 ng/mL (for GAPDH and HIF-1β) or 100 ng/mL (for Bad and cMyc) in 50 mL 5% milk. At each different time point, a piece of membrane was wetted and incubated with 5 mL secondary Ab at room temperature with shaking. The first membrane piece was incubated 48 hours before the end of time course, and the last membrane piece was incubated 5 minutes before the end of time course. At the end of the time course, all membrane pieces were washed, detected and analyzed as described above.
2.3 Test of stacked film exposure in standard curves
To reduce the uncertainty associated with trial-and-error exposure with x-ray films in the darkroom, a protocol of stacked film exposure was tested with standard curves. The first film (closest) will be able to capture the weakest signal to reach a maximum sensitivity, but risks being blurred if the signal is too strong. These too-strong signals can then be captured at the 2nd, 3rd, or even 4th film with clarity, and the properly exposed film can be chosen for quantification and documentation. To test this protocol in standards, two-fold serial dilutions of Goat-Anti-Mouse-Poly-HRP were prepared in 5% milk and dotted on a nitrocellulose membrane to give a final level of 0 to 1 ng Poly-HRP per dot. The membrane was air-dried, wetted again with distilled water, incubated with SuperSignal West Pico Chemiluminescent Substrate, and exposed overnight to four stacked blue x-ray films in a cassette. The experiment was repeated three more times and film images were quantified with NIH ImageJ software. Data from the four experiments were combined for plotting at both linear and log-log scales.
2.4 Test of stacked film exposure in biological samples
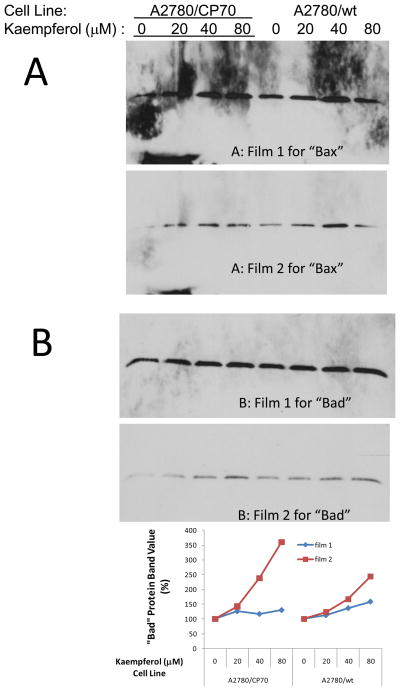
Two ovarian cancer cell lines, A2780/CP70 and A2780/wt, were maintained in RPMI 1640 medium (Sigma) supplemented with 10% fetal bovine serum (Invitrogen) at 37 °C with 5% CO2. Cells were treated with kaempferol (0–80 μM) (Sigma) for 24 hours, which is known to induce apoptosis [Luo et al., 2011] and inhibit angiogenesis and proliferation [Luo et al., 2009] in ovarian cancer cells. Cell lysates were then subjected to SDS-PAGE, and western blots prepared using Bax and Bad as the primary Abs. These blots were visualized by exposure to two stacked blue x-ray films for 90 minutes. Blot images for Bax were shown to contrast background, and protein bands of Bad were further quantitated with NIH ImageJ software to illustrate improvement in signal fold-changes.
3. Results
3.1 Interaction between cell lysates and primary antibodies might take more than 48 hours to reach its maximum
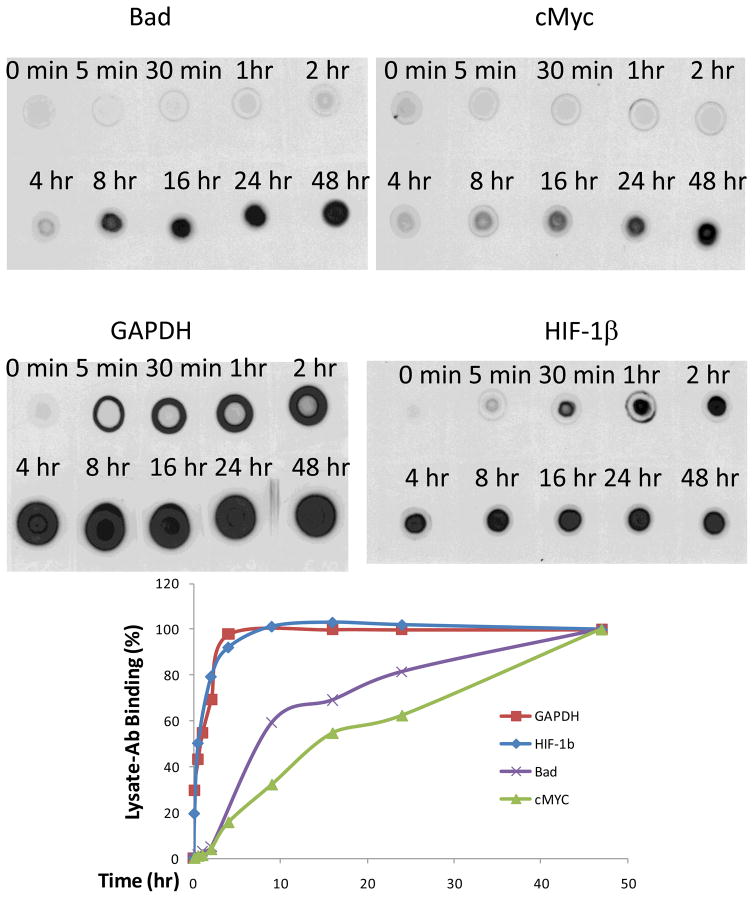
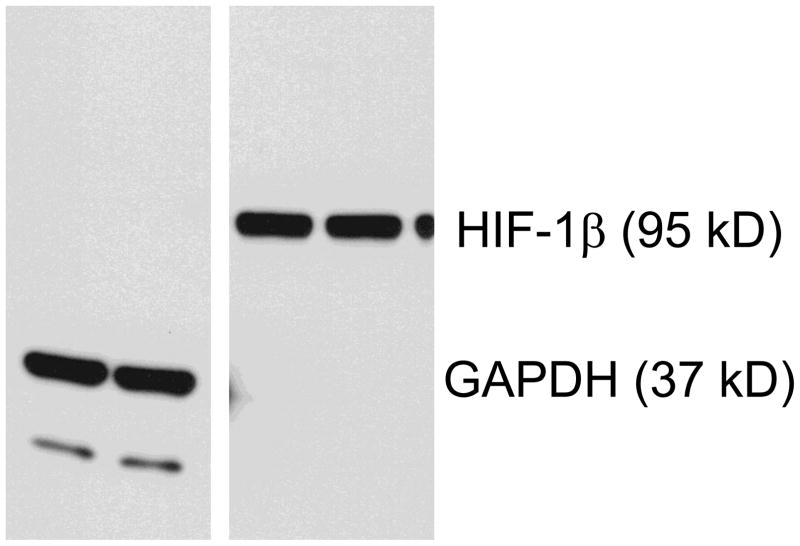
The time course study on cell lysates-primary Ab interaction indicates that primary Abs have different profiles in western blotting (Figure 1). Without any discernable differences in background, signals increased with longer incubation time, but reached a plateau at 4–8 hours for GAPDH and HIF-1β. Signal increase during this period is exclusively specific for HIF-1β, although a small amount of non-specific proteins contributed to the GAPDH profile (Figure 2). Meanwhile, a plateau was not reached even after 48 hours’ incubation for Bad and cMyc (Figure 1), suggesting that further cell lysate-primary Ab binding might continue to increase after this 48 hours incubation.
Figure 1.
Time course of cell lysate-primary antibody binding in nitrocellulose membranes.
Nitrocellulose membrane were dotted with OVCAR-3 ovarian cancer cell lysates at 25 μg per 5 μL, air-dried, wetted with distilled water, and blocked with 5% milk for 1 hour. The membrane pieces were washed, dried, and wetted with water before incubation with 250 ng/mL Bad, cMyc, GAPDH, or HIF-1β primary antibodies in 5% milk with shaking for varying time at room temperature. These membrane pieces were then washed and incubated with 250 ng/mL Goat-anti-mouse-poly-HRP in 5% milk overnight. The membrane pieces were washed and detected with SuperSignal West Pico Chemiluminescent Substrate and x-ray films. Shown above is the image of cell lysate dots incubated with different primary antibodies for varying times. Dot values were quantitated with NIH ImageJ software and the 48-hr and 0-min incubation dots were set as 100% and 0%, respectively, for normalization and plotting.
Figure 2.
Cell lysate-primary Antibody binding in nitrocellulose membrane after SDS-PAGE.
OVCAR-3 cell lysates were subjected to SDS-PAGE and proteins were transferred to nitrocellulose membranes. The membranes were blocked with 5% milk for 1 hour, and incubated with 0.25 μg/mL GAPDH or HIF-1β antibodies, at room temperature with shaking, for 5 hours. The blots were further washed and incubated with Goat-Anti-Mouse-Poly-HRP in 5% milk, and visualized with SuperSignal West Pico Chemiluminescent Substrate and x-ray film to evaluate possible contributions from non-specific bands.
3.2 Interaction between primary antibodies and secondary antibody might take more than 48 hours to reach its maximum
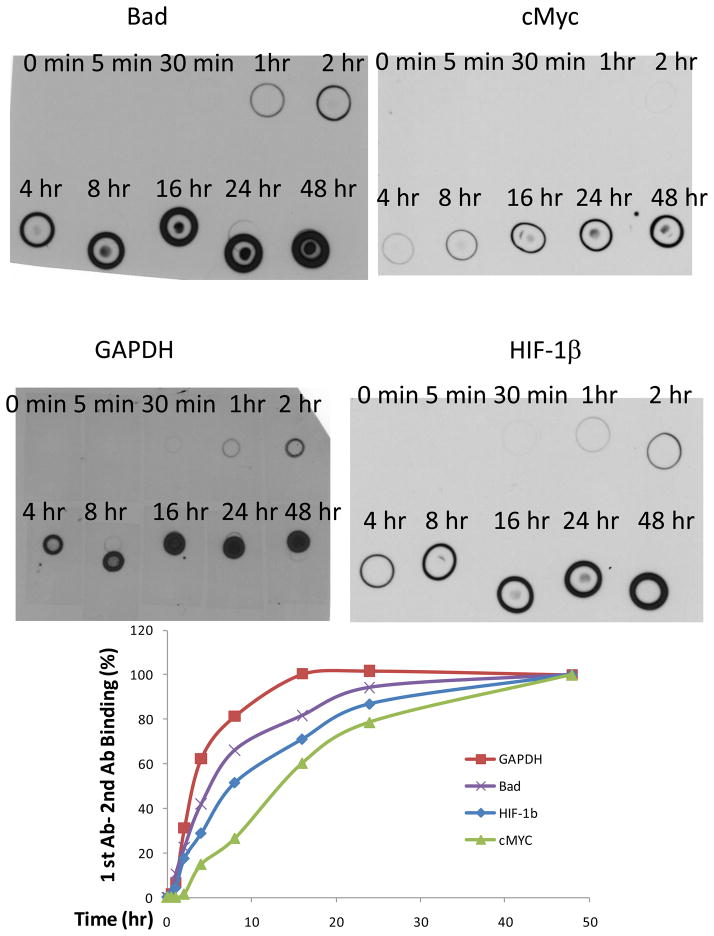
Incubation with secondary Abs for one hour is a universally used standard protocol in western blotting. In contrast to common belief, interactions between primary Abs and secondary Abs are not always easy and fast. The current results indicate that for Bad, HIF-1β, and cMyc, a plateau detection limit is not reached even after 48 hours incubation, and a 16 hour incubation is needed for GAPDH to reach its plateau (Figure 3). Again, no increase in background is observed with longer incubations.
Figure 3.
Time course of primary antibody-secondary antibody binding in nitrocellulose membranes.
Nitrocellulose membrane were dotted with GAPDH, Bad, cMYC, or HIF-1β mouse antibody in 5% milk at 1 ng per 5 μL, dried, wetted with water, and blocked with 5% milk for 1 hour. The membrane pieces were washed, dried, and wetted with water before incubation with 50 ng/mL (for GAPDH and HIF-1β) or 100 ng/mL (for Bad and cMyc) Goat-anti-Mouse-Poly-HRP in 5% milk with shaking for varying times at room temperature. These membrane pieces were then washed and detected with SuperSignal West Pico Chemiluminescent Substrate and x-ray film. Shown above is the image of primary Ab dots incubated with secondary antibodies for varying times. Dot values were quantitated with NIH ImageJ software and the 48-hr and 0-min incubation dots were set as 100% and 0%, respectively, for normalization and plot.
3.3 Stacked film exposure showed differential linear ranges and slopes for standard curves
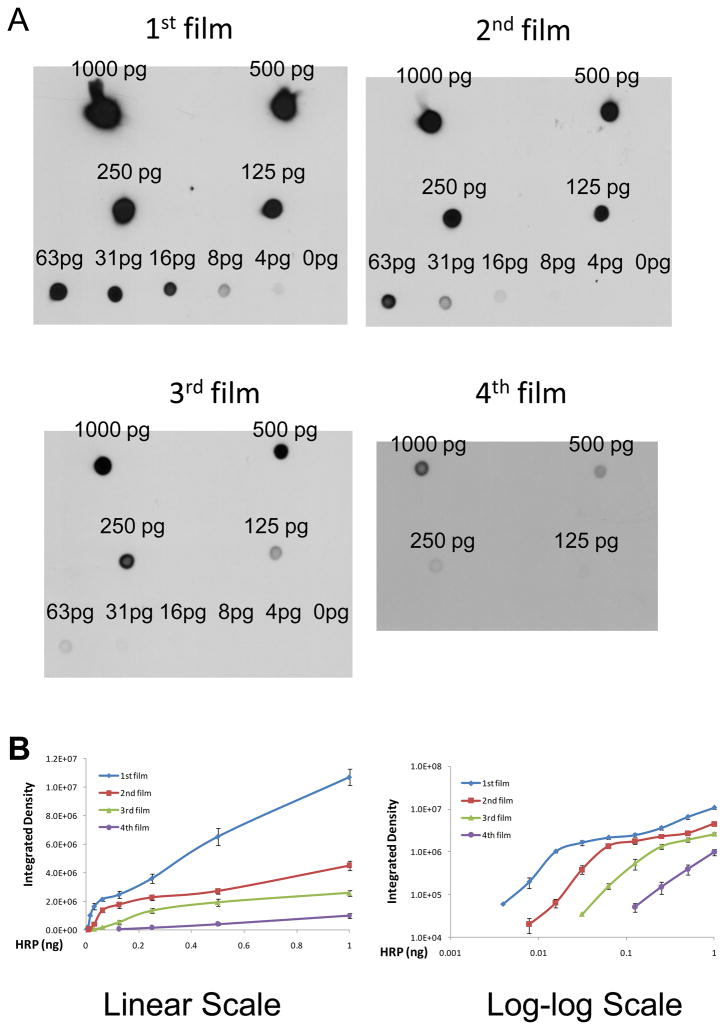
Standard curves generated from four independent experiments demonstrated that the best sensitivity could be reached by the first (the closet) film, while the fourth film is good at describing the linearity among the strongest signals (Figure 4A). Although linearity is apparent for all four films when plotted on a linear scale, weak signals cannot be viewed clearly because they cluster toward the origin, and strong signals overwhelm and occupy the majority of the figure space. (Figure 4B). To better visualize linearity at both ends of this dynamic range and give an equal weight to each dot analyzed, these data were further plotted on a log-log scale, and the latter revealed that linearity from films 1–3 on linear scale mostly reflects a saturation of signals by those highest HRP dots, and the four layers of film demonstrated non-saturated linearity over different ranges of HRP (Figure 4B). The linearity on each film typically exists for up to three or four points without compromising slope, indicating a dynamic range of 4–8 fold change can be accurately captured by x-ray film, which should be large enough for many biological experiments (increase up to 400–800% or decrease down to 25–13%). For larger fold-changes in biological samples, western blots with x-ray film images cannot be used for accurate quantification due to the saturation problems intrinsic to x-ray films.
Figure 4.
Standard curves by stacked film exposure.
Goat-Anti-Mouse-Poly-HRP standards were prepared in 5% milk and dotted to a nitrocellulose membrane to give a final level of 0–1 ng Poly-HRP per dot. The membrane was air-dried, wetted again in distilled water, incubated with SuperSignal West Pico Chemiluminescent Substrate, and exposed to stack of four x-ray films in a cassette overnight. These films were developed/fixed, and the dot signals were quantified with NIH ImageJ software, and plotted on linear and log-log scales. A. Typical images of the standards on the four films. B. Standard curves plotted at both linear (left) and log-log (right) scales. Data represent Means ± SE from four independent experiments.
3.4 Stacked film exposure reduced background and increased fold-changes in biological samples
The stacked film exposure protocol was also tested in biological samples. It was found that by choosing the right layer/exposure of film, background could be reduced (Figure 5A) and sensitivity (fold-changes) increased by minimizing saturation problems (Figure 5B). For example, expression of “Bad” protein in A2780/CP70 cells was shown up-regulated by kaempferol treatment. However, this increase is less than 2-fold as captured by film 1 due to saturation problems. When captured in film 2, the increase was improved up to 3–4 fold changes. More importantly, by setting a long exposure time (ranging from 10 minutes to two days), the trial-and-error darkroom guesswork becomes a one-step cassette assembling process, and the right exposure can always be chosen from these multiple layers of films.
Figure 5.
Stacked film exposure improves background and signal in western blots.
Two ovarian cancer cell lines, A2780/CP70 and A2780/wt, were treated with different concentrations of kaempferol for 24 hours and harvested for SDS-PAGE and western blot with two different primary antibodies (Bax and Bad) and the same Goat-Anti-Mouse-Poly-HRP antibody. Blots were incubated with SuperSignal West Pico Chemiluminescent Substrate and exposed to two stacked films for 90 minutes. A. The 2nd film reduces background shown on the 1st film. B. Signal fold-changes were larger at film 2 because the strong signals may have reached saturation at film 1.
4. Discussion
Although western blotting has long been a standard technique in protein detection, its protocol has never been standardized and multiple variables have to be determined empirically for each protein-antibody pair. To improve the immunoblot procedure and analysis of data, various approaches have been developed by scientists. CCD camera and antibodies labelled with visible/infrared fluorophores provide a larger dynamic range, better accuracy, and convenience for multiplexing [Mathews et al., 2009]. However, they require expensive imaging systems that are not accessible to all scientists. Despite our knowledge that interaction between antibodies and solid-phase immobilized antigen (such as in Western Blotting), even not limited by diffusion, can be 1000-fold slower than that in a liquid solution [Nygren et al., 1989], costly devices have been marketed to accelerate Western Blotting to less than 30 minutes [Millipore, 2011]. Typical Western Blotting protocols call for an incubation time of one hour or overnight, and an x-ray exposure time of one minute for western blotting. When encountered with a protein of less abundance or an antibody of less than perfect, where an increased sensitivity is desired, scientists intuitively increase the concentration of antibodies and time for film exposure, but rarely challenge the ill-defined incubation time or exposure protocol.
As revealed by our data, the common protocol of “incubate for one hour” or “incubate overnight” in western blotting appears to be insufficient to reach the maximum sensitivity that primary Abs and secondary Abs could provide in some cases. The current results also reduced two common concerns about prolonged incubation with antibodies: the background and the signal strength. As demonstrated in Figures 1 to 3, prolonged incubation with primary or secondary Abs (at a reasonable concentration) does not increase background, neither does it loose signal strength over time. Of course, the best incubation time is often unknown in western blotting, and timing of incubation could be performed to help determine maximum sensitivity for individual Abs, in addition to titrating antibody concentrations. Also, antibody providers could assist investigators by including timing data for maximum sensitivity in datasheets for each Ab.
Signals from a western blot can be captured, visualized, and documented by proper exposure to an x-ray film. It sometimes can be difficult if the images come out too weak/strong, and the blot will have to be re-exposed for a newly estimated time, with plenty of uncertainty because the strength of signal keeps dropping over time. This uncertainty can be reduced with imaging systems which can capture blot images in a real-time manner, eliminating guess-work on the appropriate exposure [Akhavan-Tafti et al., 1994]. However, imaging systems for western blots are not always accessible due to their costs. These results indicate that exposing a blot to stacked films for a long time will generate multiple images, from which a proper exposure can be chosen.
Overall, the results of this study revealed that antigen-antibody interactions often take a longer time than “one hour” or “overnight” as instructed by most western blot protocols, and suggest that if a better sensitivity in western blotting is desired, prolonged incubation with primary antibodies and especially with secondary antibodies will help enhance signal intensity without darkening the background. Also, the protocol of stacked film exposure worked well with both standard curves and biological samples, providing a modified protocol to further improve sensitivity and reduce background. As to how long is enough for antibody incubation or x-ray film exposure, it depends on practical schedules and can range from 2 hours in a day to 2 days in a weekend, and has to be determined empirically. In addition to traditional adjustments in Ab concentrations and film exposure times, both prolonged incubation and stacked film exposure will be helpful alternative protocols in western blotting.
Acknowledgments
We thank Dr. Bing-Hua Jiang at West Virginia University for providing the OVCAR-3 and A2780/CP70 ovarian cancer cell lines and thank Dr. Kenneth Tew at the Medical University of South Carolina for providing the A2780/wt ovarian cancer cell line. We thank Ms. Megan Smith for her technical assistance. This research was supported by NIH grant P20 RR016477 from the National Center for Research Resources awarded to the West Virginia IDeA Network of Biomedical Research Excellence.
Footnotes
Publisher's Disclaimer: This is a PDF file of an unedited manuscript that has been accepted for publication. As a service to our customers we are providing this early version of the manuscript. The manuscript will undergo copyediting, typesetting, and review of the resulting proof before it is published in its final citable form. Please note that during the production process errors may be discovered which could affect the content, and all legal disclaimers that apply to the journal pertain.
References
- Akhavan-Tafti H, Schaap AP, Arghavani Z, DeSilva R, Eickholt RA, Handley RS, Schoenfelner BA, Sugioka K, Sugioka Y. CCD camera imaging for the chemiluminescent detection of enzymes using new ultrasensitive reagents. J Biolumin Chemilumin. 1994;9:155–64. doi: 10.1002/bio.1170090309. [DOI] [PubMed] [Google Scholar]
- Fournier C, Brons S, Taucher-Scholz G. Quantification of chemiluminescent signals using photon-sensitive films or a CCD camera. Biotechniques. 2003;35:284–90. doi: 10.2144/03352bi01. [DOI] [PubMed] [Google Scholar]
- Kurien BT, Scofield RH. Protein blotting: a review. J Immunol Methods. 2003;274:1–15. doi: 10.1016/s0022-1759(02)00523-9. [DOI] [PubMed] [Google Scholar]
- Luo H, Rankin GO, Liu L, Daddysman MK, Jiang BH, Chen YC. Kaempferol Inhibits Angiogenesis and VEGF Expression through both HIF Dependent and Independent Pathways in Human Ovarian Cancer Cells. Nutrition and Cancer. 2009;61:554–563. doi: 10.1080/01635580802666281. [DOI] [PMC free article] [PubMed] [Google Scholar]
- Luo H, Rankin GO, Li Z, DePriest L, Chen YC. Kaempferol induces apoptosis in ovarian cancer cells through activating p53 in the intrinsic pathway. Food Chemistry. 2011;128:513–519. doi: 10.1016/j.foodchem.2011.03.073. [DOI] [PMC free article] [PubMed] [Google Scholar]
- Mathews ST, Plaisance EP, Kim T. Imaging Systems for Westerns: Chemiluminescence vs. Infrared Detection. Methods Mol Biol. 2009;536:499–513. doi: 10.1007/978-1-59745-542-8_51. [DOI] [PubMed] [Google Scholar]
- Millipore SNAP id Protein Detection System. 2011 http://www.millipore.com/immunodetection/id3/snap_id.
- Nygren H, Stenberg M. Immunochemistry at Interfaces. Immunology. 1989;66:321–327. [PMC free article] [PubMed] [Google Scholar]
- Paladichuk A. How the Western was won. The Scientist. 1999;13:18–21. [Google Scholar]
- Towbin H, Staehelin T, Gordon J. Electrophoretic transfer of proteins from polyacrylamide gels to nitrocellulose sheets: procedure and some applications. Proc Natl Acad Sci USA. 1979;76:4350–4. doi: 10.1073/pnas.76.9.4350. [DOI] [PMC free article] [PubMed] [Google Scholar]


